

Backtest Validation Checklist: 10 Checks Before You Trade a Strategy Live
A backtest validation checklist: 10 checks to run before going live, from costs, fills and repainting to out-of-sample, Monte Carlo and forward tests.
By Tessera Trades · Updated · 13 min read
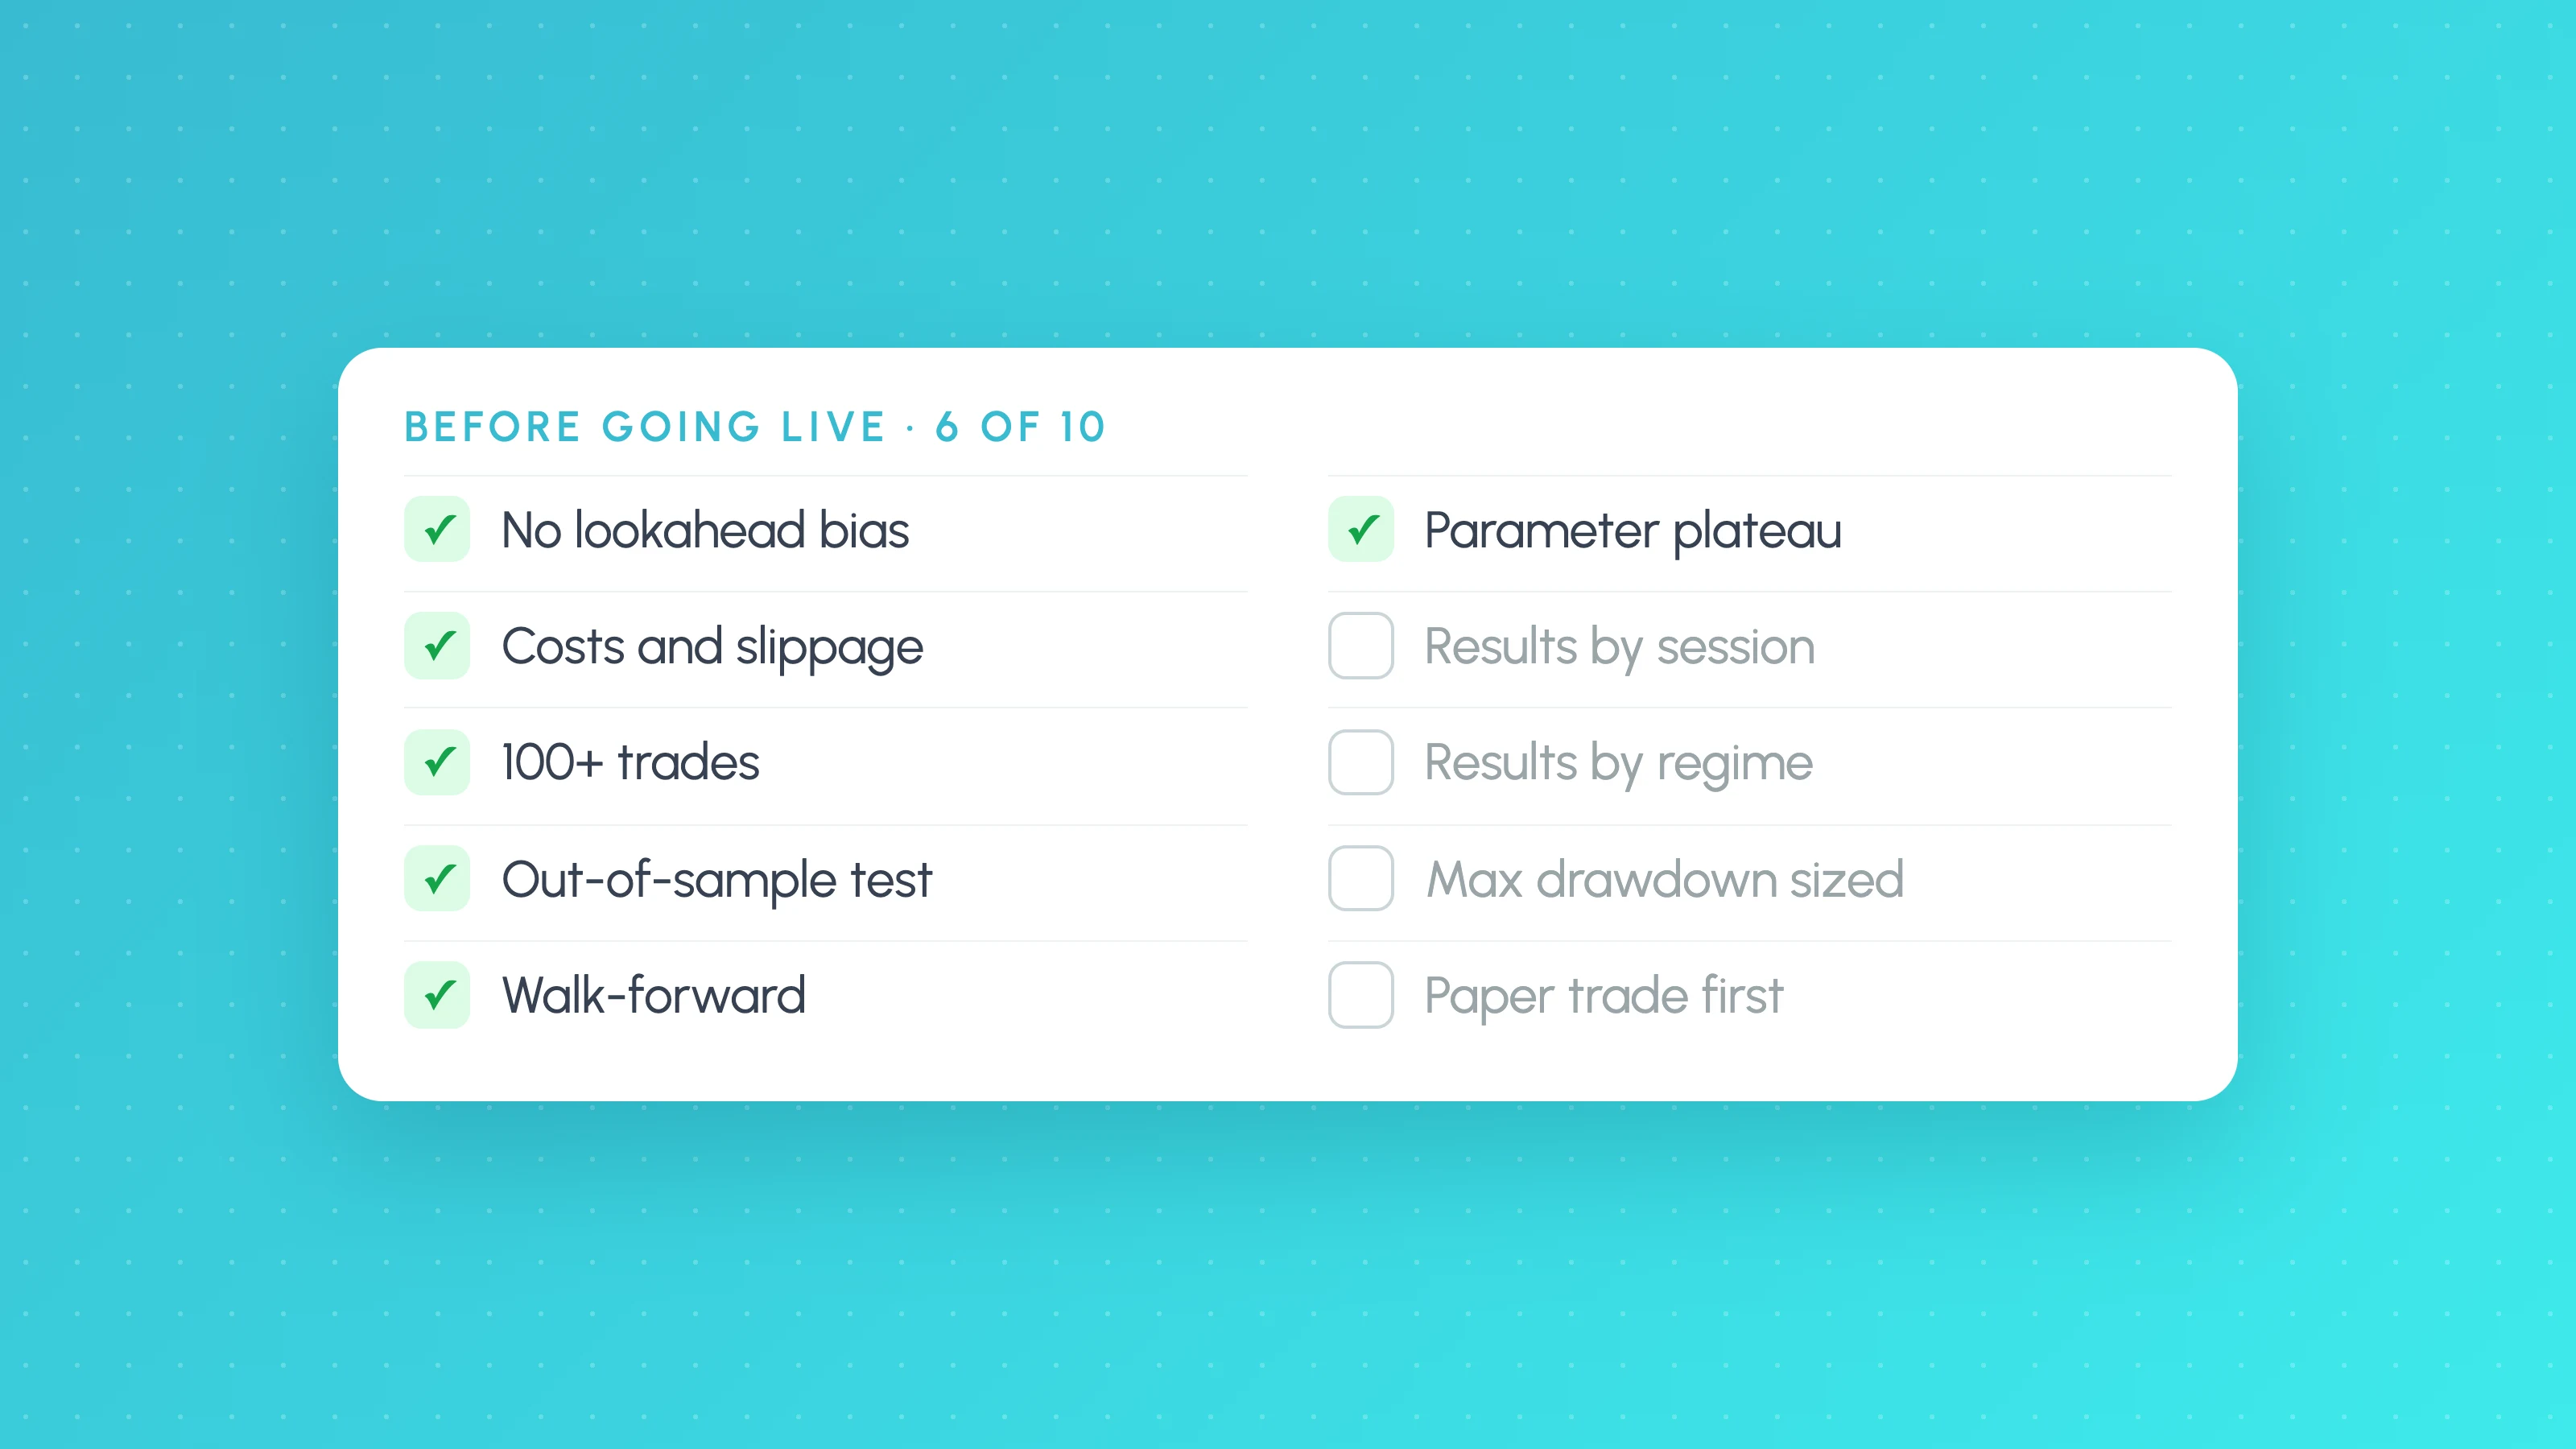
A backtest validation checklist tests two things before you go live: that the trades themselves are real (no lookahead or repainting, realistic costs, honest fill assumptions, enough of them), and that the edge is robust (it survives out-of-sample data, nearby parameter values, different market conditions and reshuffled trade order), finished with a forward test and ongoing live-vs-backtest comparison. A strategy that passes all ten checks below is not guaranteed to make money, but one that fails any of them has not been validated.
The order matters. The first four checks ask whether the backtest's trades could have happened at all; if they couldn't, every later test is checking trades that never would have happened. The next four ask whether the edge is robust or fitted. The last two move from history to real time.
Each section is a summary with a pass condition and a link to the in-depth guide. The thresholds are rules of thumb, not statistical standards; set them before you look at results.
The checklist at a glance
Print it and fill in the last column for every strategy before it goes live.
| # | Check | What it catches | Pass (rule of thumb) | Result |
|---|---|---|---|---|
| 1 | Lookahead and repainting | Signals that used future data | Trades unchanged after a chart reload and a few days live | |
| 2 | Costs and slippage | Edge that only exists at zero cost | Still profitable with your broker's commission and measured slippage | |
| 3 | Fill assumptions | Lucky intrabar fills, limit fills on a touch | Results hold with finer bar detail and stricter limit fills | |
| 4 | Sample size | Results decided by a handful of trades | 100+ trades overall, 30+ in any slice you act on | |
| 5 | Out-of-sample and walk-forward | Parameters fitted to one period | Out-of-sample positive and in a similar range to in-sample | |
| 6 | Parameter sensitivity | One lucky combination of inputs | Broad plateau when inputs move 10 to 20% | |
| 7 | Market condition breakdown | Edge that lives in one session, year or regime | Profit spread across conditions, no single slice carries it | |
| 8 | Monte Carlo drawdown | Drawdown understated by one lucky trade order | 95th percentile drawdown is one you could sit through | |
| 9 | Forward or paper test | Anything the backtest couldn't model | Results inside the backtest's range for the same trade count | |
| 10 | Live vs backtest monitoring | Slow decay, execution problems | Gap explained by known costs, drawdown within the Monte Carlo range |
1. Lookahead and repainting
A strategy repaints when it behaves differently on historical bars than it did in real time. The worst form is lookahead: TradingView's repainting documentation warns that request.security() with lookahead = barmerge.lookahead_on and no [1] offset will return data from the future on historical bars. A backtest built on that is impossible, not just weak.
Check: search the script for lookahead_on, calc_on_order_fills, calc_on_every_tick and varip. Then run it on a live chart for a few days, note the trades it shows, reload the chart and compare. Trades that move or disappear after a reload are repainting.
Pass: the trades are identical after a reload. Why a strategy works in backtest but not live lists the common causes and fixes.
2. Costs and slippage
Pine Script strategies apply no commission unless you specify one, and the slippage default is 0, according to TradingView's strategies documentation.
Check: set commission to your broker's actual rate and slippage to what you see on your fills (or a conservative estimate if you have no fills yet), then re-run. If costs eat most of the average trade, the edge is too thin.
Pass: the strategy is still profitable after costs, with some headroom. Profit factor after costs is a better headline number than net profit before them. For how to pick a slippage figure and then measure the real one on live fills, see how much slippage to assume in a backtest.
3. Fill assumptions and bar detalization
On historical bars the broker emulator only knows each bar's open, high, low and close, so it guesses the order prices were hit in. That matters most when a stop and target sit inside one bar, and for limit orders, which by default fill as soon as price touches the level.
TradingView reworked these settings in July 2026. According to the Pine Script release notes, the Bar Magnifier checkbox became a Bar detalization menu, "Verify price for limit orders" became a Limit order execution dropdown, and the fill-on-close checkbox became an Order execution delay input. As of 2026-10, the strategies documentation says Premium and Ultimate users can use bar detalization to fill orders from more precise intrabar data, and the limit order setting lets a limit fill only once price trades one tick beyond the level.
Check: re-run with higher bar detalization if your plan allows it, with limit fills set to require a tick beyond the price, and with no same-bar-close fills. Trades lasting zero or one bar are the most exposed to the intrabar guess.
Pass: results drop a little or not at all. A sharp drop means the original backtest depended on fills that probably wouldn't have happened. TradingView bar detalization, limit fills and order delay explained covers each setting.
4. Sample size
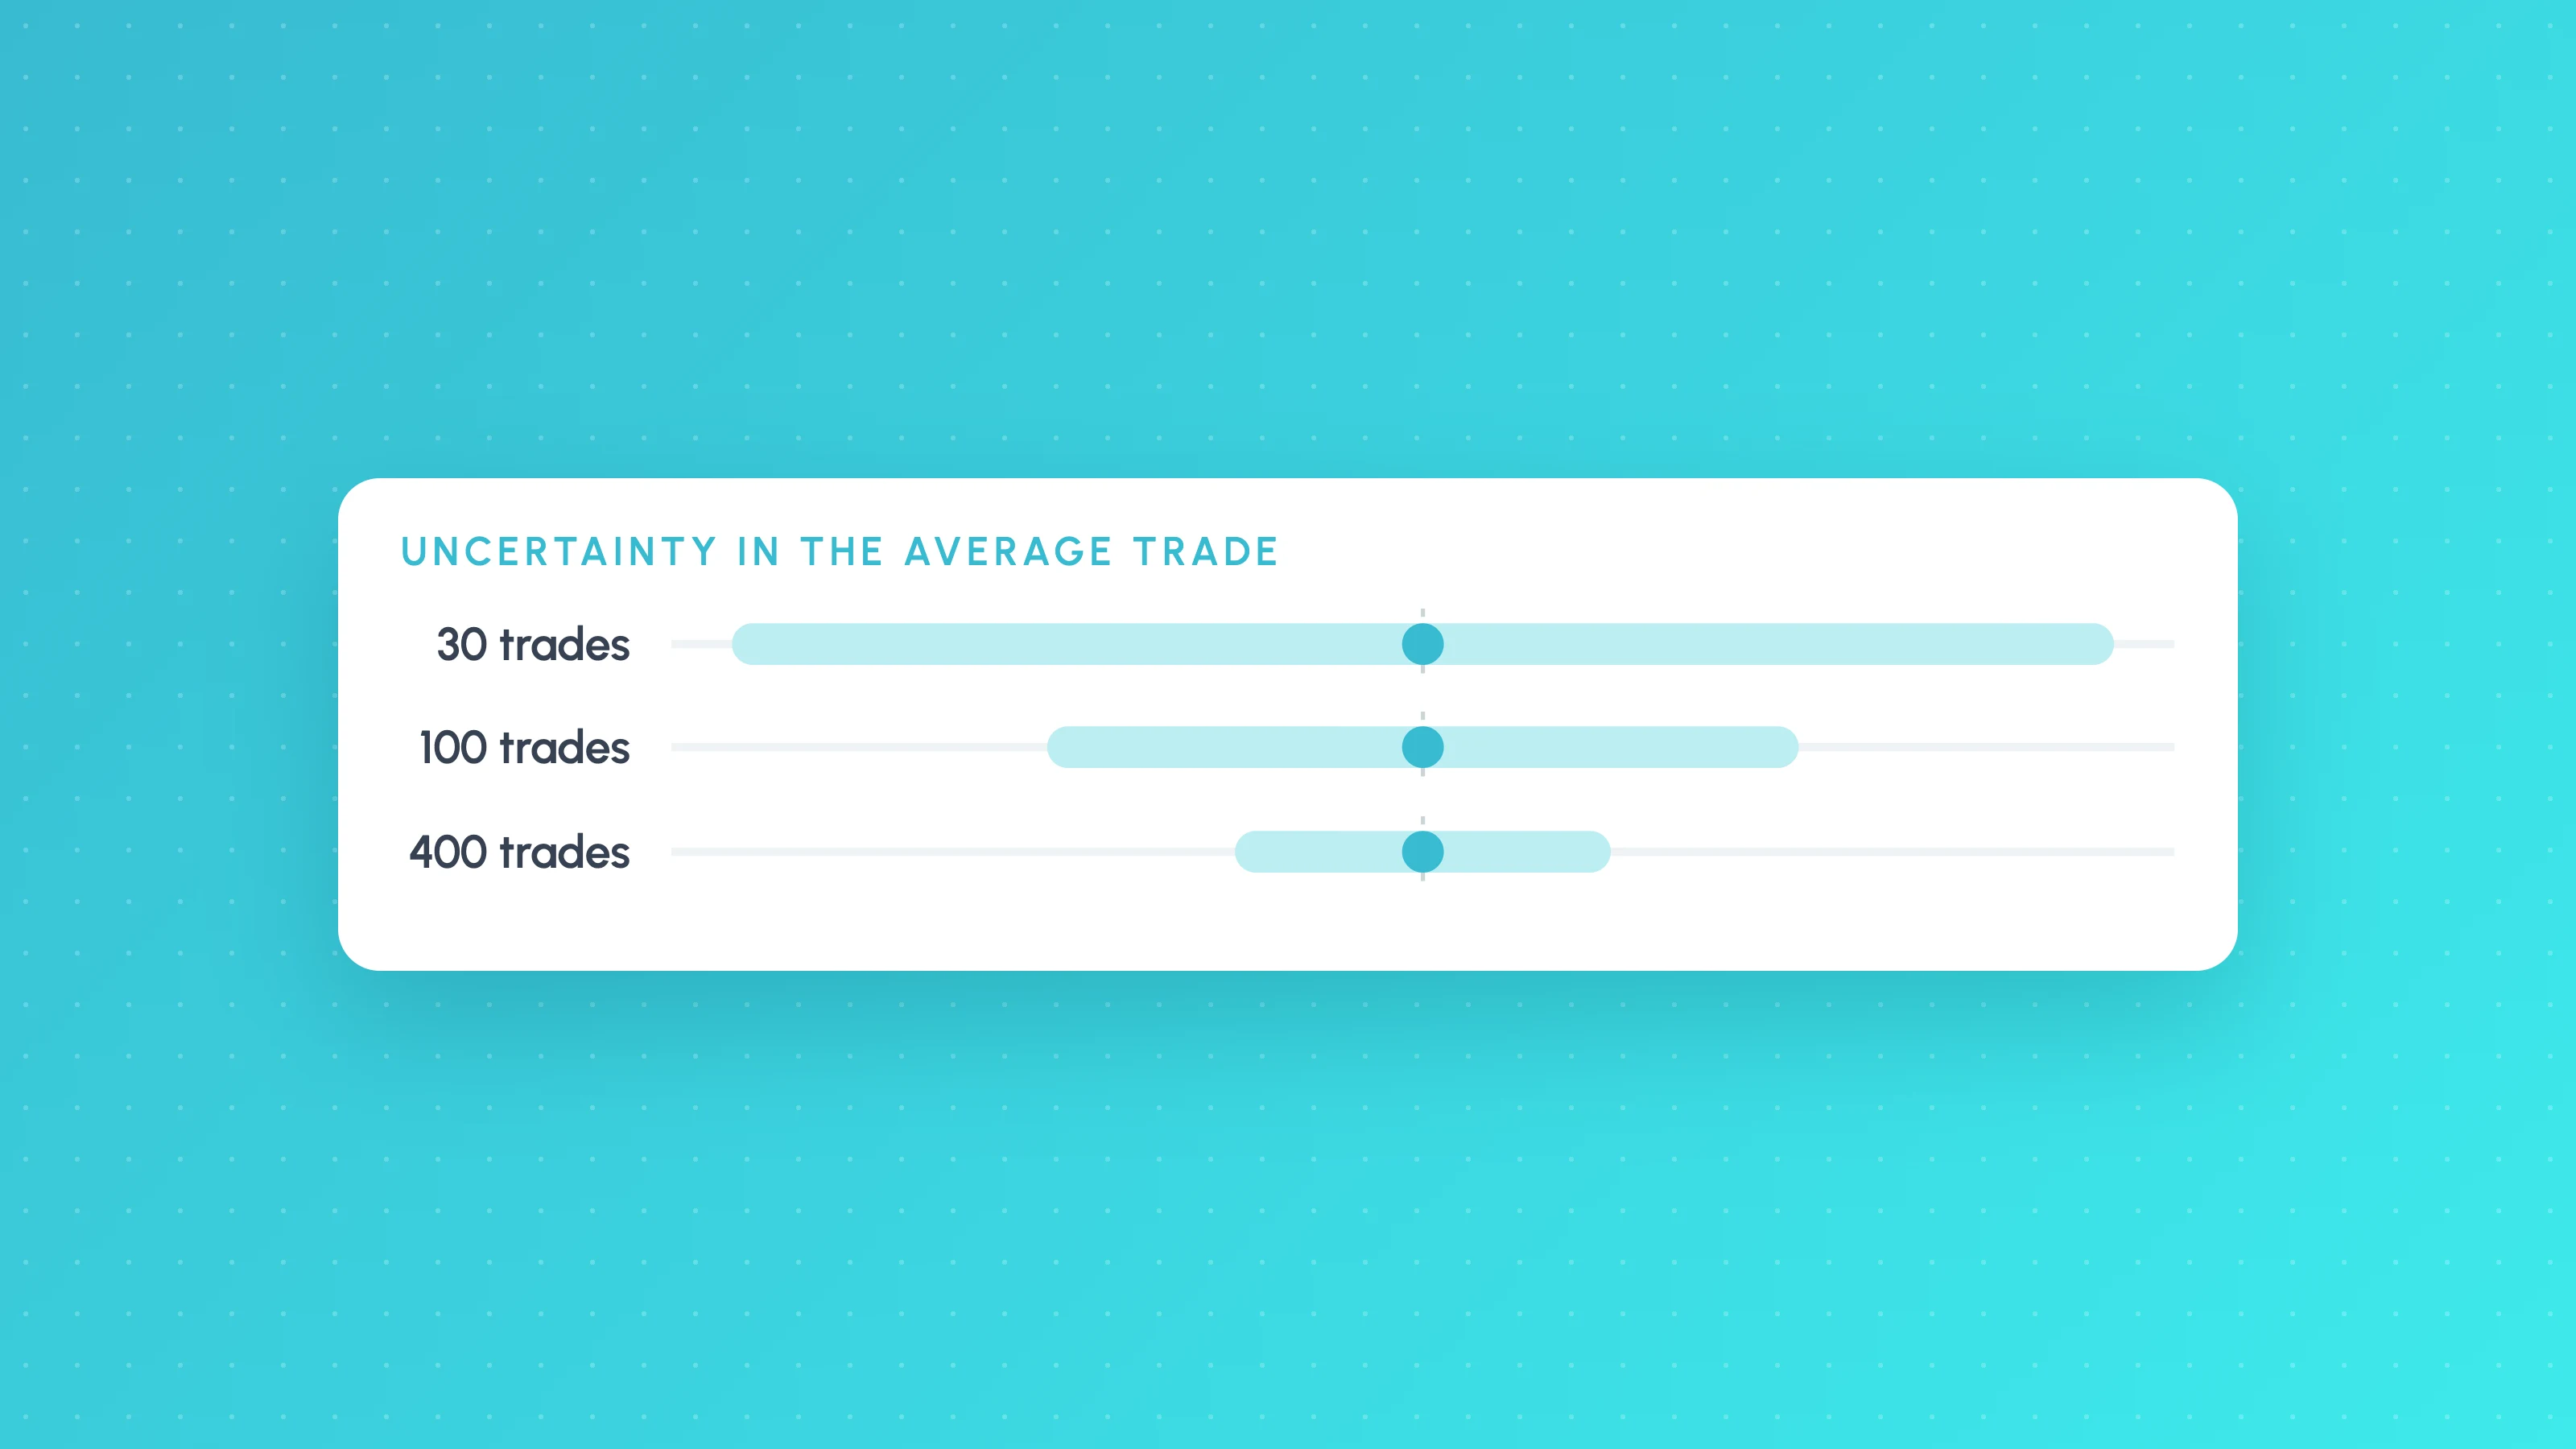
Averages from few trades are noisy: on 25 trades, a few large winners can produce a high profit factor on their own, and if you tried many versions of the strategy, one of them reaching a profit factor of 2.5 by luck is no longer unusual.
Check: count the trades in the full backtest and in every slice you plan to act on (a session, a weekday, a volatility filter). Also count the inputs and filters you tuned; each is a decision fitted to the same trades.
Pass: as a rough guide, at least 100 trades overall and at least 30 in any slice you act on, and more as the number of tuned decisions grows. How many trades you need for a valid backtest shows how to calculate the figure from the size of your edge with a simple t-statistic.
5. Out-of-sample and walk-forward tests
TradingView's strategies documentation describes splitting an instrument's data into in-sample and out-of-sample parts as a widely used way to reduce overfitting. The idea is simple: choose a cut-off date before you start tuning, develop only on data before it, and run the final version once on the data after it.
Walk-forward analysis repeats that test through history: tune on a training window, run the settings unchanged on the next window, move both forward and repeat. In TradingView this is done by hand with date inputs.
Count the versions you tried, too. Bailey, Borwein, López de Prado and Zhu showed in "Pseudo-Mathematics and Financial Charlatanism" (Notices of the AMS) that with five years of data, trying more than about 45 independent configurations of a strategy with no real edge is almost guaranteed to produce one with an in-sample annualised Sharpe ratio of 1, while its expected out-of-sample Sharpe ratio is zero.
Pass: the out-of-sample period is profitable and in a similar range to in-sample, and most walk-forward windows are profitable with settings that stay roughly stable. As a rule of thumb rather than a standard, out-of-sample performance below about half of in-sample is a strong hint of a curve fit. The out-of-sample test only works once: if you look, change the strategy and look again, that period is now in-sample. Is my backtest overfit? has the step-by-step version, including a Pine Script date window. Out-of-sample testing for traders covers how big the hold-out should be and how to read a weaker result.
6. Parameter sensitivity
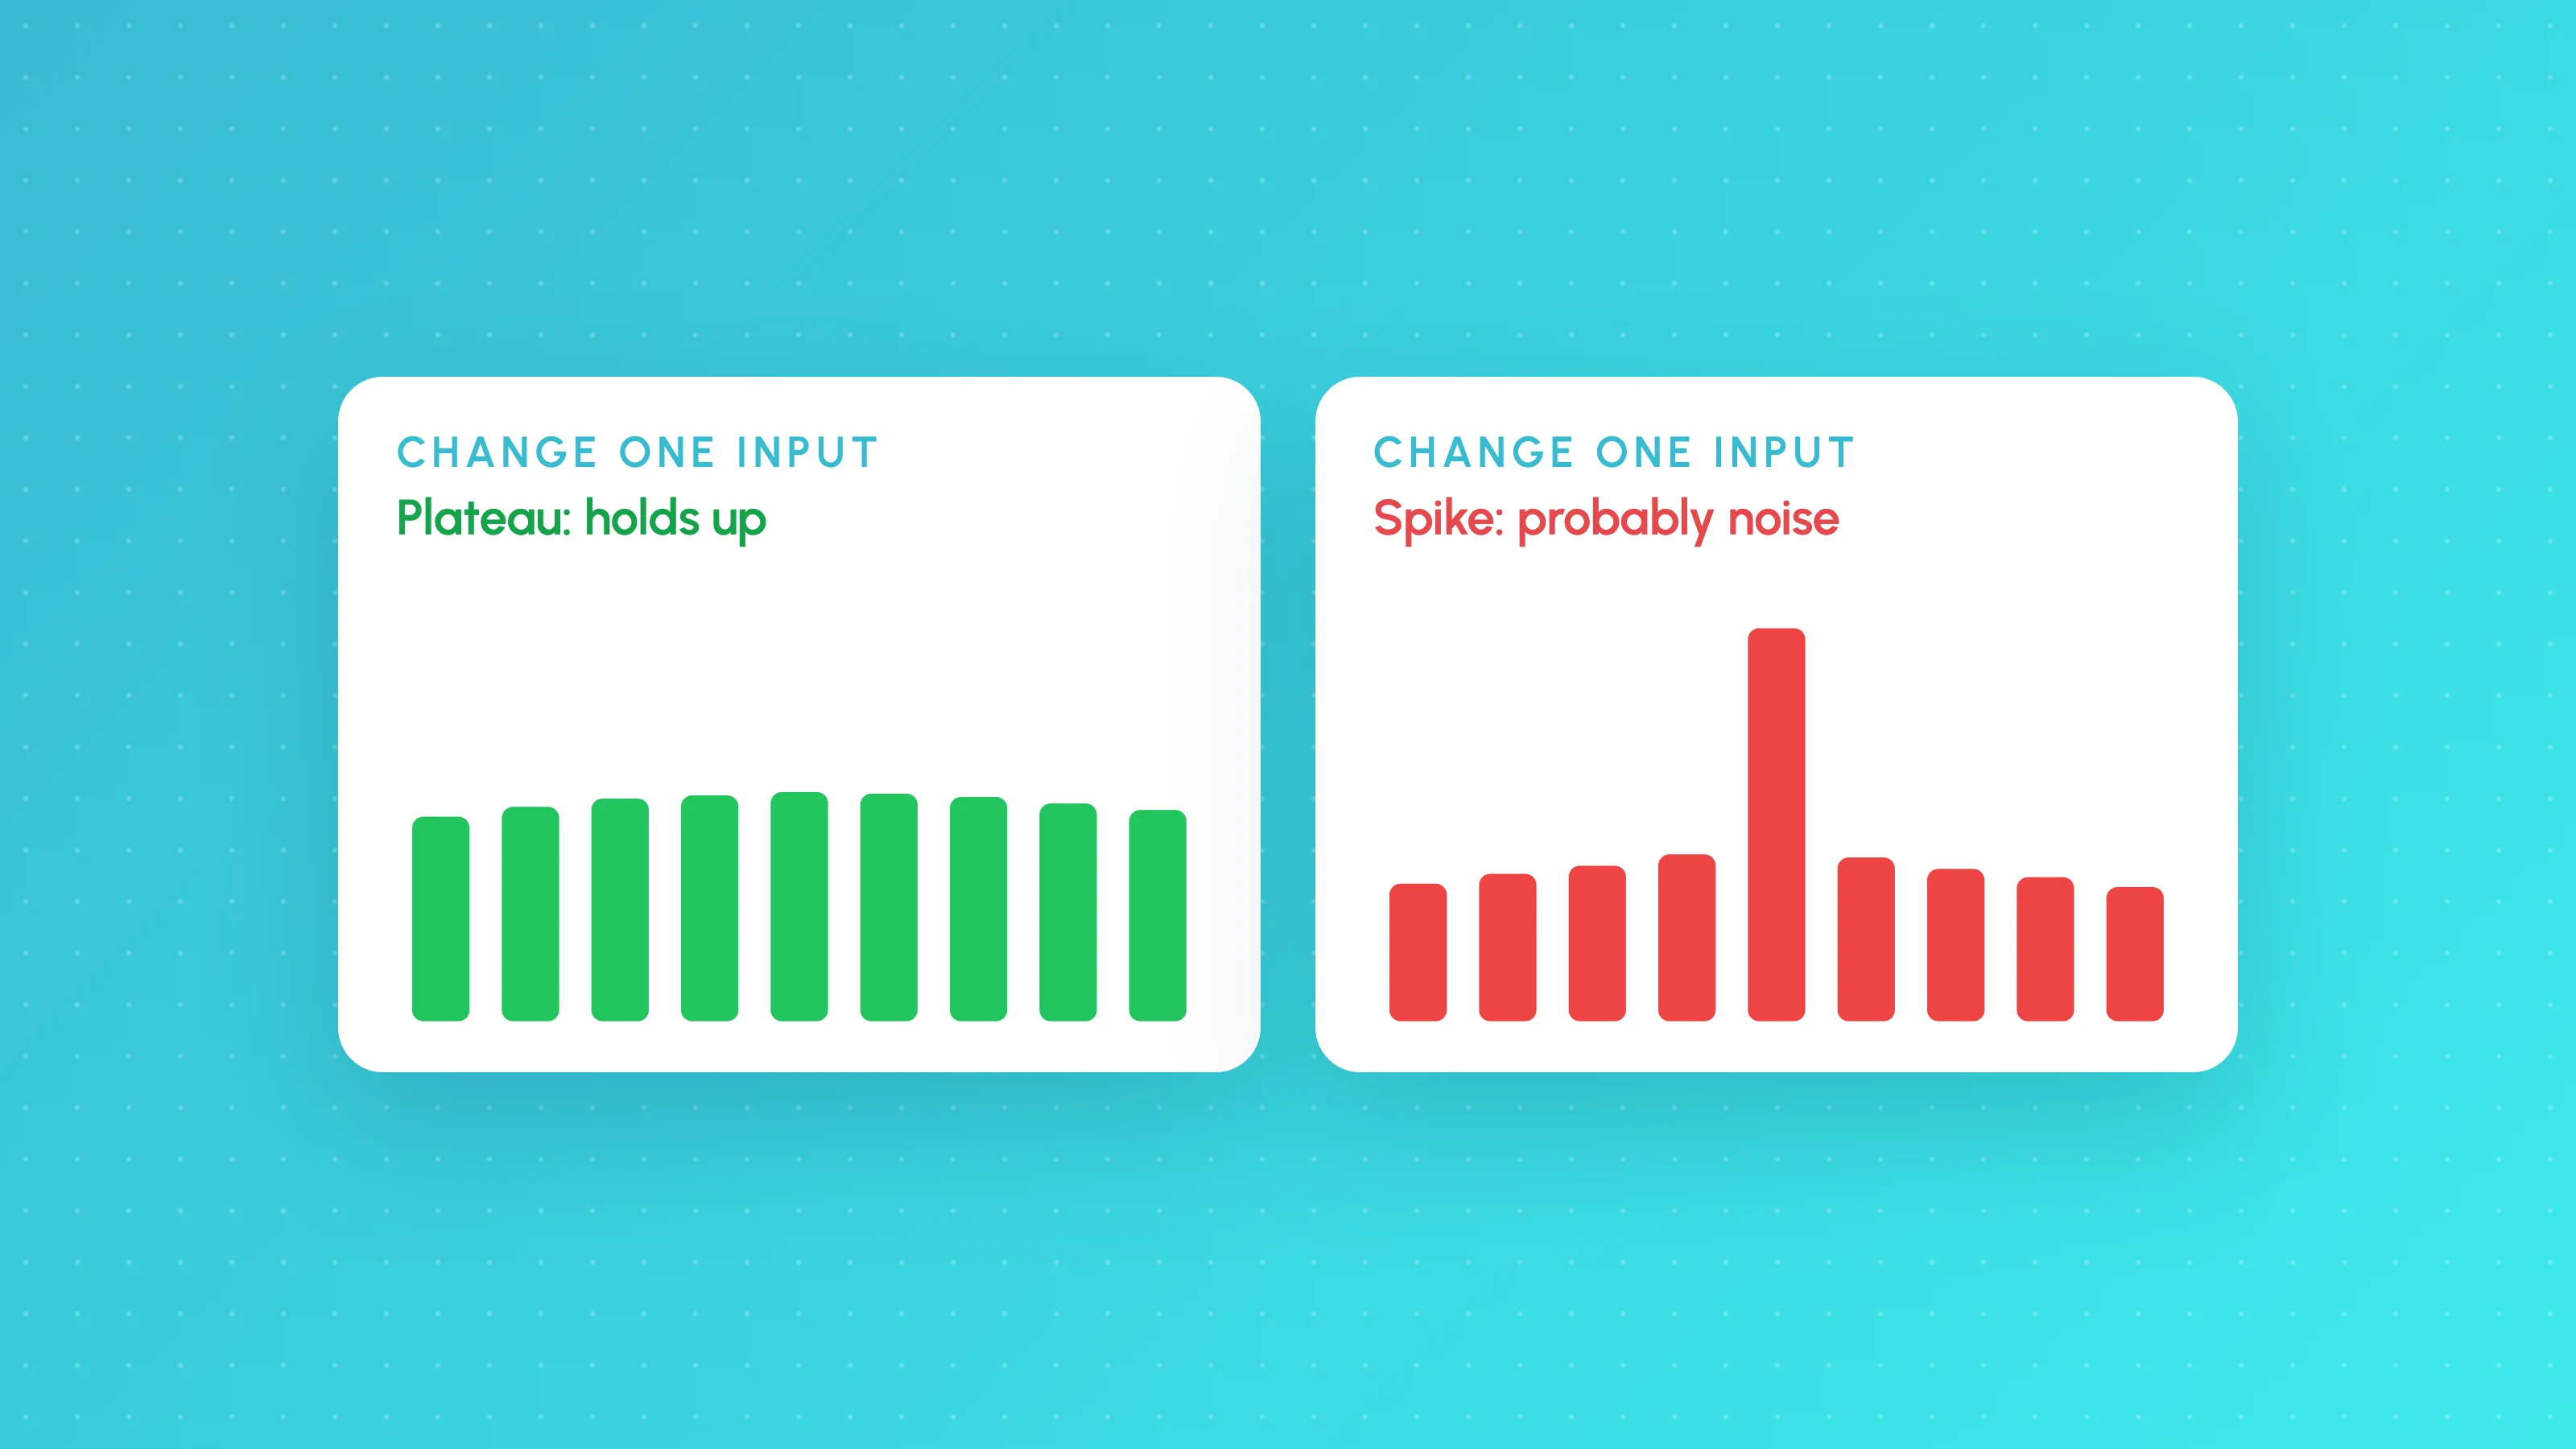
A real edge degrades gradually as you move an input away from its best value. An overfit one has a spike: one exact value works and its neighbours don't.
Check: move each important input 10 to 20% in each direction, one at a time, and record the result. With two inputs, run a small grid and look for a broad region of good results rather than one best cell. Then remove each filter in turn and see whether one carries the whole result.
For entry inputs this means re-running the backtest. For exits it doesn't have to: Tessera's simulator replays different stop, target, breakeven and trailing rules on the trades a strategy already took, using real candles, with up to 16 runs side by side on the Plus plan. It doesn't generate new entries or model tick-by-tick fills, so treat it as a quick way to see whether your stop and target sit on a plateau, then confirm the chosen version in a full backtest. MAE and MFE analysis shows how to read where your current stop and target sit relative to how far trades actually ran.
Pass: the results form a plateau, and no single filter accounts for most of the profit.
7. Market condition breakdown
Headline numbers average every condition the strategy traded in. Split the trades and one session, year or volatility regime often turns out to have made all the money.
Check: break results down by year, session, weekday, hour, volatility and direction, with the trade count next to every figure. TradingView's strategy report has a Time patterns view that groups winning and losing trades by entry hour, day of week or month (TradingView help centre). It doesn't group by trading session or volatility, so for those you need the trade list in a spreadsheet, as described in how to analyse a TradingView backtest, or a tool that does it for you. Tessera's reports break an imported Strategy Tester export down by session, weekday, time of day, volatility and symbol, with the sample size behind each slice.
Pass: profit is spread across years and most conditions, and any losing slice either has too few trades to judge or has a reason you can explain. Filtering out a losing slice is a new decision: test it on data you didn't use to find it.
8. Monte Carlo drawdown
A backtest shows one ordering of trades. The same trades in a different order produce a different equity curve and, usually, a deeper maximum drawdown than the one in the report. A Monte Carlo test reshuffles the trade sequence many times and records the drawdown each time, which gives you a range instead of a single lucky number. Net profit stays the same; only the path changes. Some tools also randomly skip trades to imitate missed signals, as described in StrategyQuant's Monte Carlo documentation.
Tessera runs Monte Carlo tests in Strategy Lab, on strategies you build there. For a backtest from another platform, a few lines of Python on your exported P&L column will:
import numpy as np

pnl = np.loadtxt("pnl.csv")      # net P&L per trade, one value per line
start = 10_000                   # starting equity
rng = np.random.default_rng(42)

max_dds = []
for _ in range(5_000):
    equity = start + np.cumsum(rng.permutation(pnl))
    peaks = np.maximum.accumulate(np.concatenate(([start], equity)))[1:]
    max_dds.append(((peaks - equity) / peaks).max())

print(f"Median max drawdown: {np.median(max_dds):.1%}")
print(f"95th percentile:     {np.percentile(max_dds, 95):.1%}")
Shuffling assumes trades are independent. If your strategy scales out of one position in several fills, combine them into one trade first, or the test will understate drawdowns.
Pass: you could sit through the 95th percentile drawdown without abandoning the strategy or breaching an account limit, such as a prop firm's maximum loss. If you can't, reduce size before going live, not after. Monte Carlo backtesting explained compares the ways of resampling trades and how to read the drawdown probabilities they produce.
9. Forward or paper test
TradingView's strategies documentation describes forward testing as gauging a strategy's performance in live market conditions, and it's the only check here that the backtest couldn't have influenced. Run the strategy in real time, on paper or at minimum size, with the exact symbol, settings and execution route you'll use live. Paper fills are simulated too, so small live size tells you more about slippage and delays.
How long: long enough for a meaningful number of trades, not a fixed number of weeks. A strategy that trades daily gets there far sooner than a weekly one.
Pass criteria, written down before you start: the forward results fall inside the range the backtest produced over stretches of the same number of trades; the trades match the backtest's trades for the same period (no missing or extra signals); and measured slippage is no worse than the figure you used in check 2. Backtest sample size shows why 20 or 30 trades on their own say almost nothing about whether an edge exists.
10. Live vs backtest monitoring
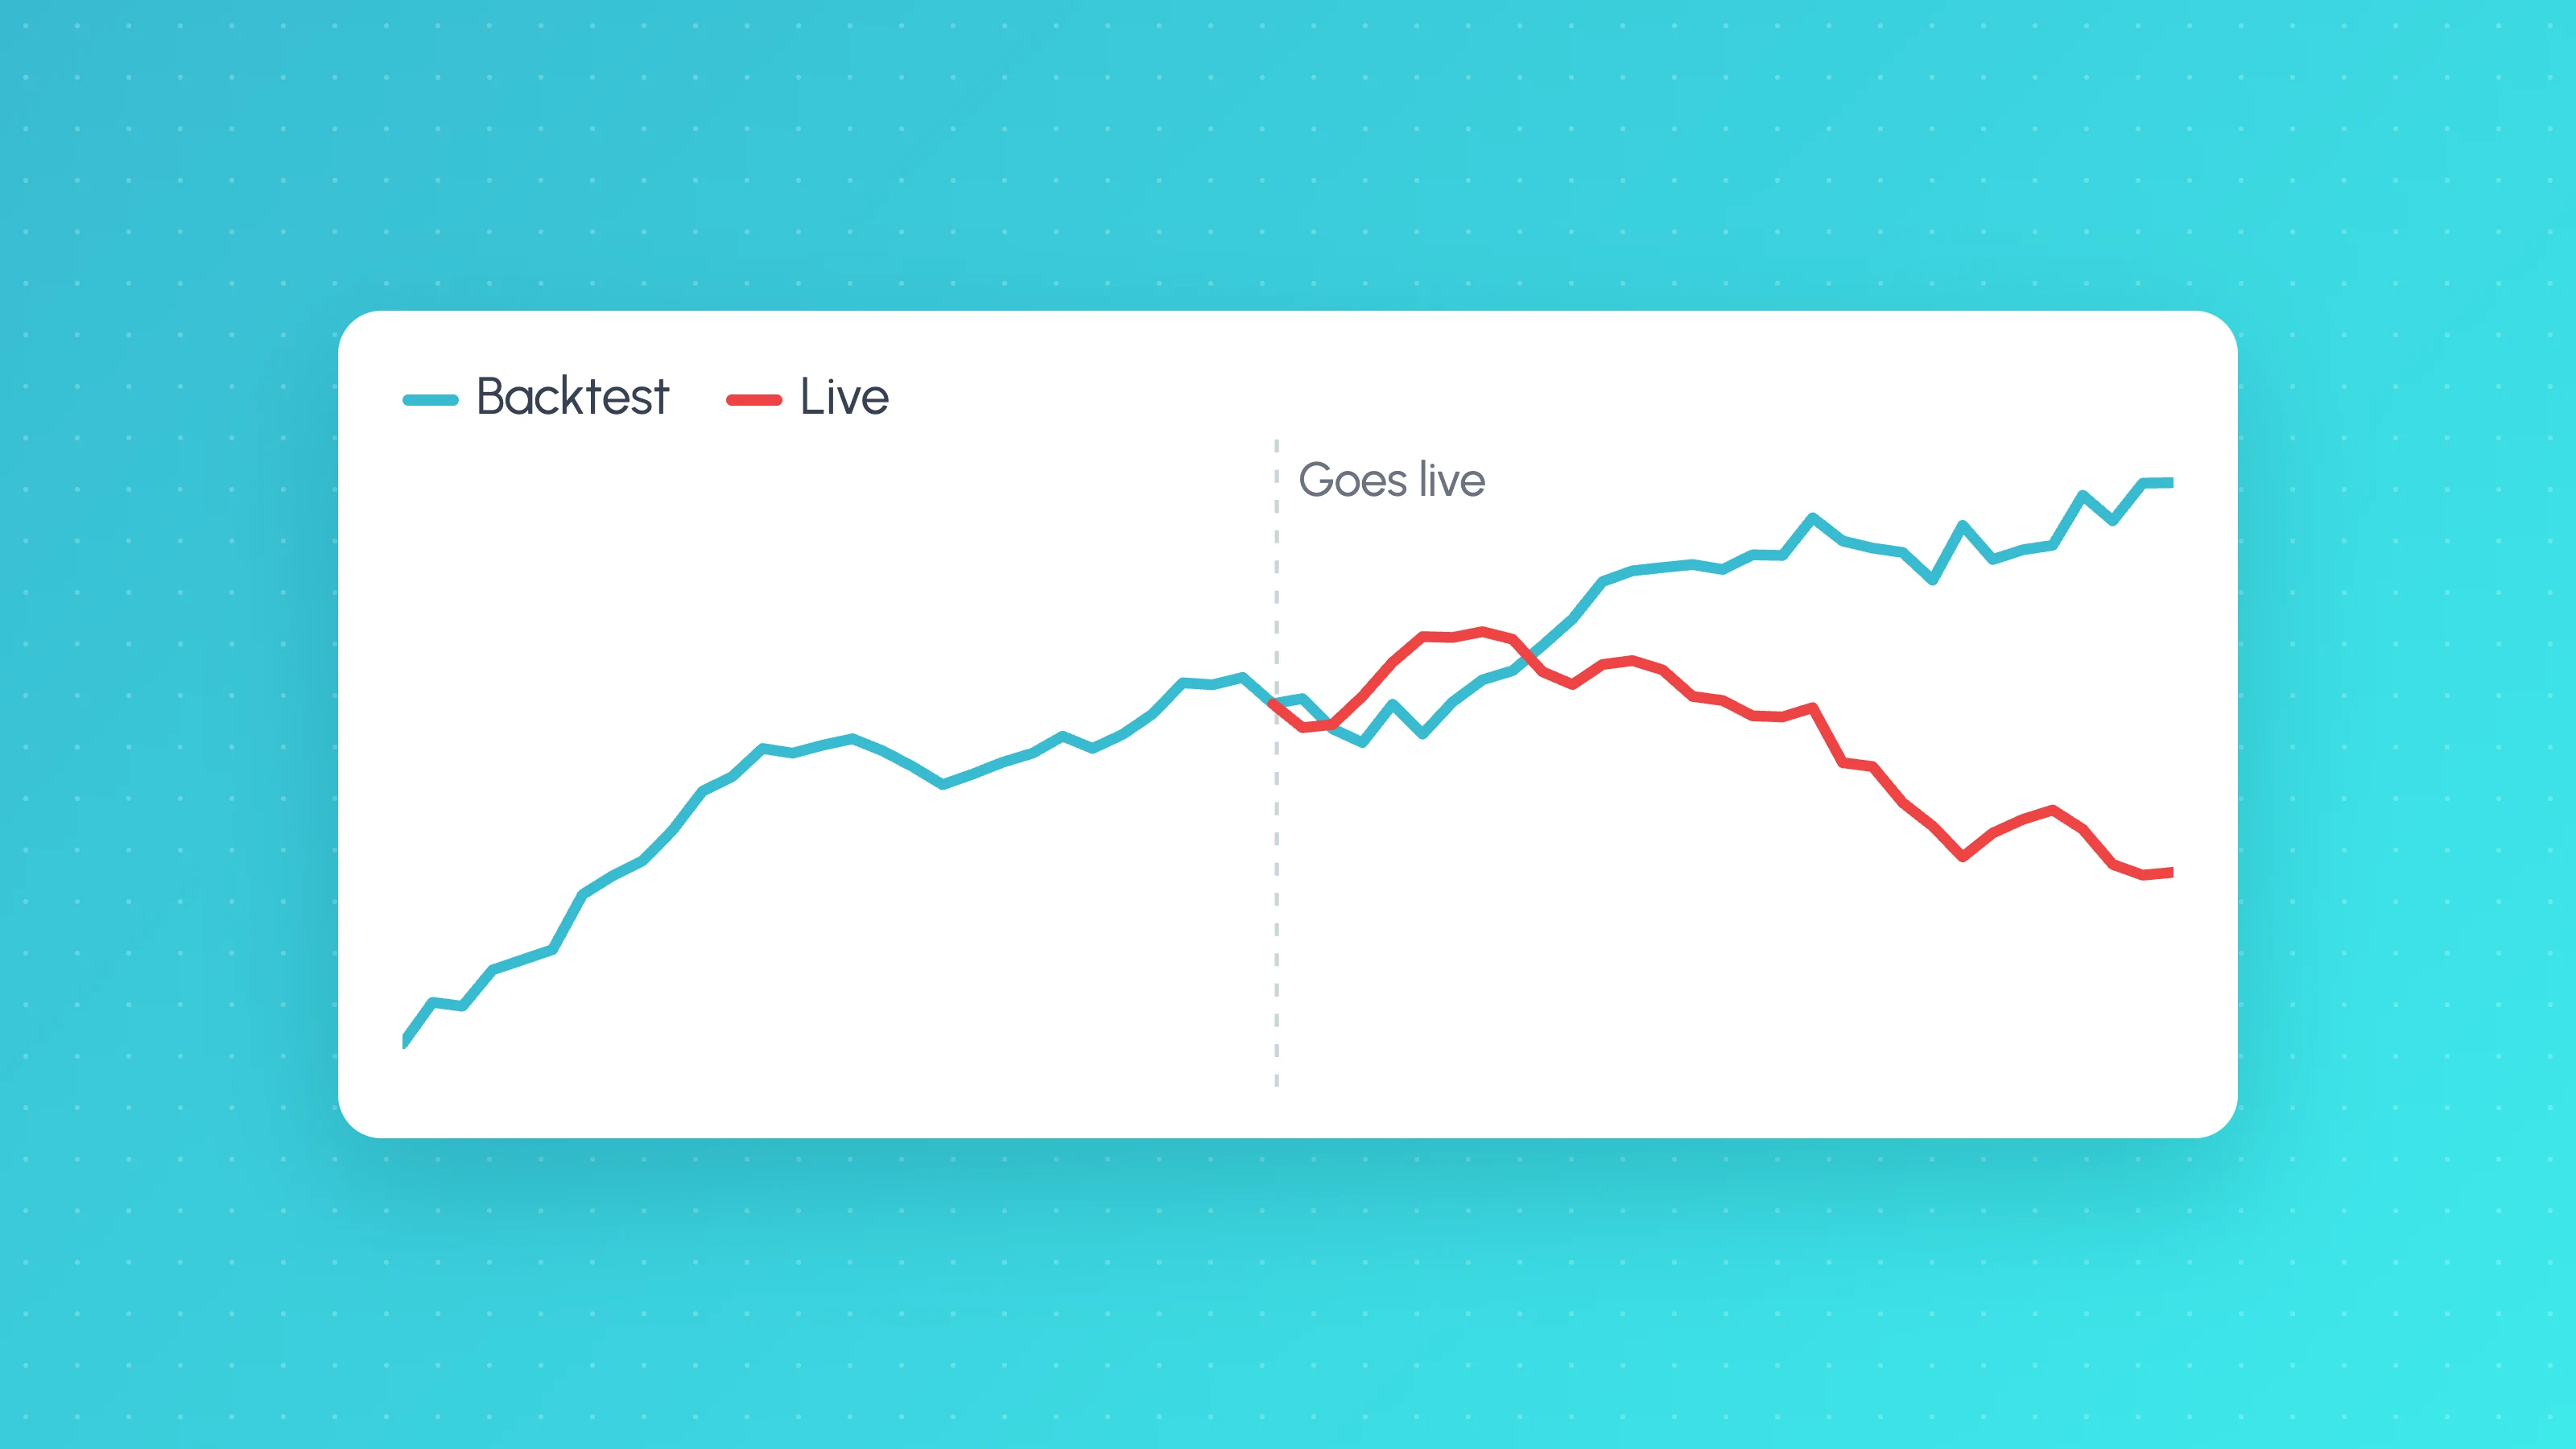
Re-run the backtest over the live period every few weeks and compare it with your real fills trade by trade: matched, missed and extra trades, and the slippage on matched ones. A gap that costs explain is a settings problem. A gap that keeps growing after costs points to overfitting or a changed market.
Decide your stop rule in advance too. One rule of thumb, not a standard, is to pause and review if the live drawdown passes about 1.5 times the backtest's maximum drawdown, or the 95th percentile from your Monte Carlo test, whichever you set at the start.
Tessera imports both sides: the Strategy Tester export, and live history by file (MetaTrader 4 and 5, NinjaTrader, Tradovate, Hyperliquid) or live sync (Interactive Brokers, OANDA, cTrader, Binance, Liquid Brokers), so you can see both broken down by the same conditions. Why a strategy works in backtest but not live walks through the trade-by-trade comparison.
Run the checks in Strategy Lab
If you build the strategy in Tessera's Strategy Lab, much of this checklist runs without exporting anything. Every backtest automatically holds out the last 30% of the data as an unseen period, with a verdict of held up, weaker, failed or too few trades. It also compares the first half with the second half, checks the last 12 months, removes the best trades to test concentration, measures cost fragility and shows a multiple-testing warning.
The robustness report adds the rest in one click: a Monte Carlo test of 1,000 simulated years by block bootstrap (it needs 20 or more trades), a "nudge the prices" test that re-runs the strategy on noisy copies of the data, cost stress at half, typical and double costs, an intrabar stop-first stress, and an other-markets test that shows whether the edge carries across. How to stress test a trading strategy explains what each result means and what to do when one fails.
These cover the backtest. Checks 9 and 10, the forward test and live monitoring, still take real time and real trades.
What validation can't tell you
Passing all ten checks means the backtest is honest and the edge isn't obviously fitted. It doesn't mean the strategy will be profitable: TradingView's strategies documentation notes that no trading strategy can guarantee future performance. Size positions on the assumption that live results will be worse than the backtest. If an AI assistant wrote the strategy, how to test a trading strategy ChatGPT or Claude wrote covers the extra traps.
Start with the checks that need your trades
Checks 4, 6 and 7 all start from the trade list. Run the trade list, from a backtest export, a synced broker or any spreadsheet, through the free Entry Analysis report to see your strategy's results by session, weekday, time of day and volatility, with the trade count behind each one. No card needed.
Frequently asked questions
- How do I validate a backtest?
- Start by confirming the trades could have happened: no lookahead or repainting, realistic commission and slippage, conservative fill settings, and at least about 100 trades. Then test whether the edge is robust with an out-of-sample period, small changes to the inputs, a breakdown by market condition and a Monte Carlo drawdown test. Finish with a forward test at small size before trading it fully.
- What is the difference between a backtest and a forward test?
- A backtest runs the strategy on historical data, where you can see the outcome and keep adjusting until it looks good. A forward test runs the finished strategy in real time, so the results can't have influenced the rules, and it exposes slippage and delays a backtest can only estimate.
- How long should I forward test a trading strategy?
- Until it has made enough trades to compare with the backtest, rather than for a fixed number of weeks. Compare the forward results with the range the backtest produced over periods with the same number of trades. A strategy that trades daily might get there in a couple of months; a weekly strategy can take much longer.
- How do I know if my backtest is statistically significant?
- Calculate a t-statistic on per-trade returns: the average trade divided by its standard error. A value of about 2 is the conventional threshold, but if you tested many variants or filters you should demand more; Harvey, Liu and Zhu argued that new factors in finance research should clear a t-ratio above 3.0 because so many have been tested (NBER). Backtest sample size has the worked example.
- Can a strategy pass every check and still lose money live?
- Yes. Validation reduces the chance that the backtest was an illusion, but markets change and a real edge can disappear. That's why check 10 exists: keep comparing live results with the backtest and decide in advance what drawdown would make you stop and review.
Keep reading
 TradingView backtests
Is My Backtest Overfit? A Practical Checklist for Traders
How to tell if a backtest is overfit: too-good metrics, thin samples, fragile inputs, useless filters, out-of-sample and walk-forward tests, plus a checklist.
 TradingView backtests
How Many Trades Do You Need for a Valid Backtest?
How many trades a backtest needs: rules of thumb, the t-statistic formula with a worked example, a table by edge size, per-bucket minimums and multiple testing.
 TradingView backtests
Why Does My Strategy Work in Backtest but Not Live?
Why a TradingView strategy works in backtest but not live: costs, fill assumptions, repainting, gaps, data, alert delays and overfitting, with a check for each.