

What Is a Good Profit Factor? Formula, Ranges and Red Flags
A good profit factor is usually 1.3 to 2.0 after costs on 100+ trades. See the formula, a worked example, a spreadsheet calculator and why above 3 is a warning.
By Tessera Trades · Updated · 9 min read
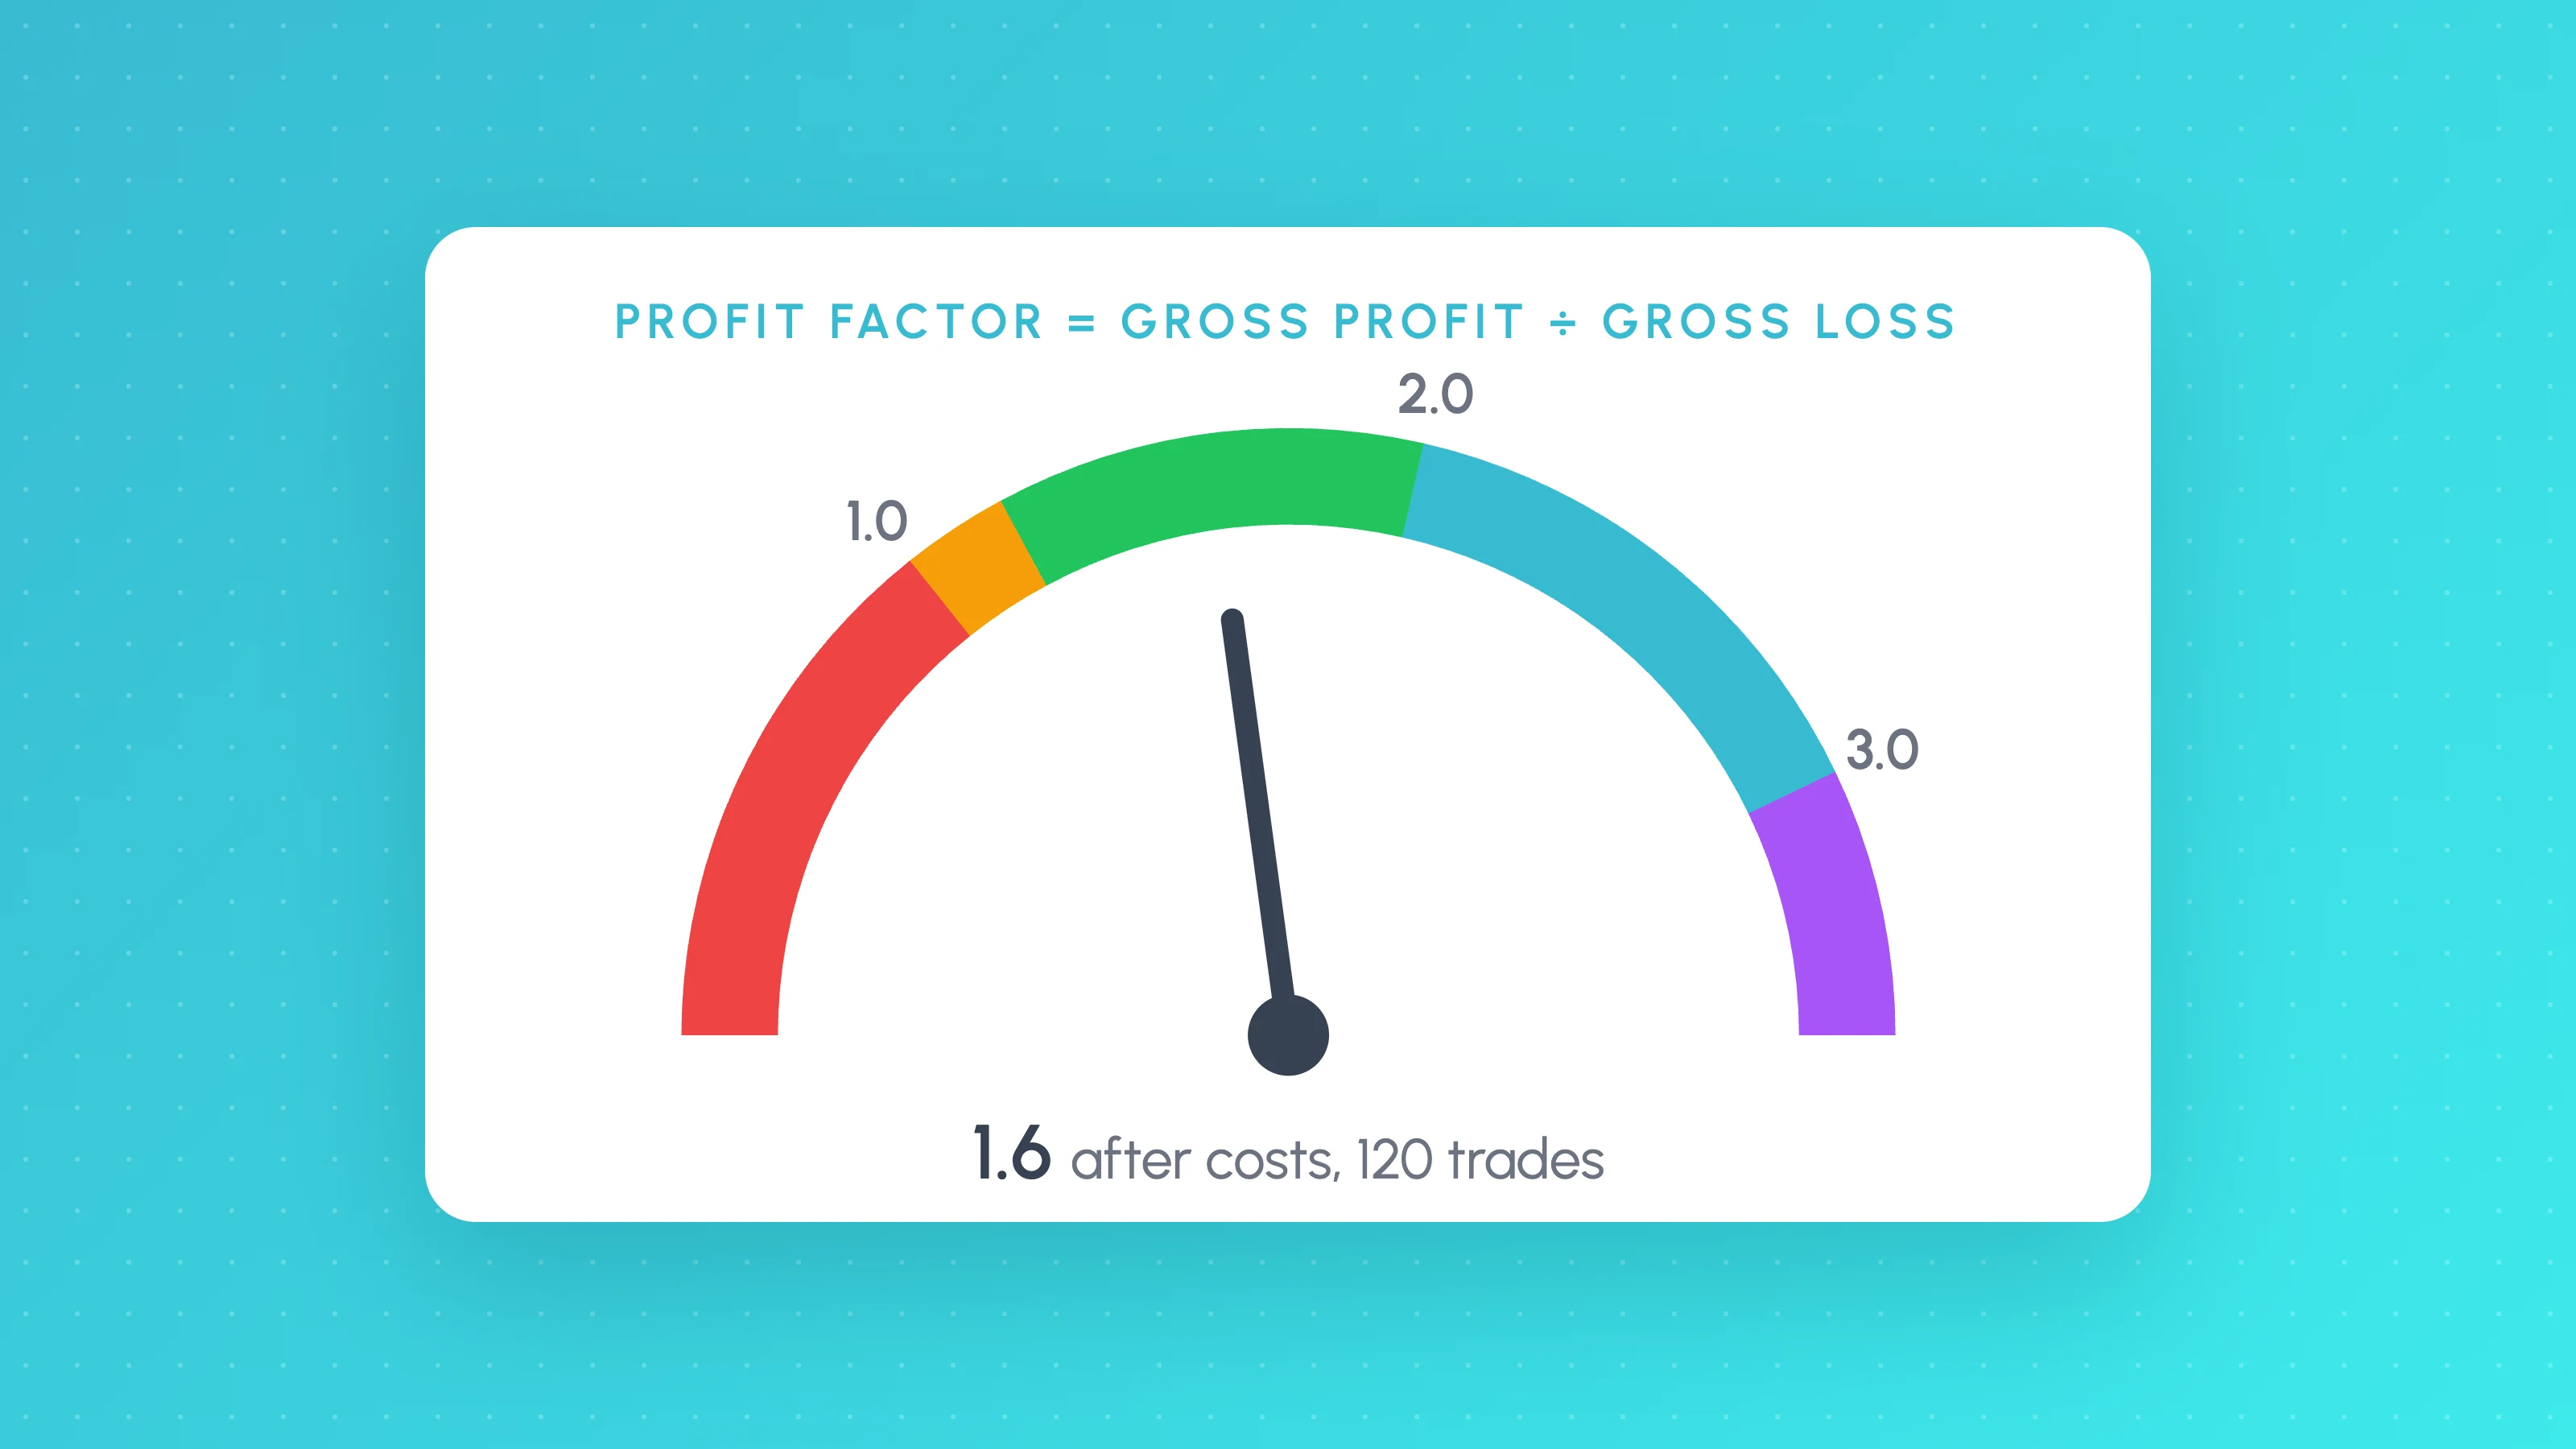
Profit factor is gross profit divided by gross loss, and anything above 1.0 means a strategy made money. As a practitioner rule of thumb, a profit factor between about 1.3 and 2.0, measured after commission and slippage on at least 100 trades, is a good result for most systematic strategies, while a backtest above 3 is more often a sign of a mistake than of an edge.
There is no official threshold. Different guides quote 1.25, 1.5 or 2.0 as "good", and none of them can be right for every strategy, because what counts as good depends on costs, trade frequency, sample size and how the number was produced. This guide gives the formula, a worked example, the ranges traders commonly use, and the checks that tell you whether your number can be trusted.
The profit factor formula
Profit factor = Gross profit / Gross lossGross profit is the sum of all winning trades. Gross loss is the sum of all losing trades, taken as a positive number. TradingView's profit factor help page defines it the same way and notes that it uses closed trades only, so open positions are not included.
You can also write it in terms of win rate and average trade size:
Profit factor = (Win rate x Average win) / (Loss rate x Average loss)Both versions give the same answer. The second one is useful because it shows how win rate and payoff trade off against each other.
A worked example
Say a strategy has 120 trades: 54 winners averaging $300 and 66 losers averaging $180.
| Calculation | Result | |
|---|---|---|
| Gross profit | 54 x $300 | $16,200 |
| Gross loss | 66 x $180 | $11,880 |
| Profit factor | $16,200 / $11,880 | 1.36 |
| Net profit | $16,200 - $11,880 | $4,320 |
Now add $10 per trade for commission and slippage. Each winner shrinks to $290 and each loser grows to $190. Gross profit becomes $15,660, gross loss becomes $12,540, and the profit factor drops from 1.36 to 1.25. Net profit falls from $4,320 to $3,120, a cut of more than a quarter from a cost that looks small per trade. This is why a profit factor measured without realistic costs tells you very little, especially for strategies that trade often.
What is a good profit factor? Rules of thumb
These ranges are rules of thumb that many systematic traders use, not research findings. Treat them as a starting point for questions, and assume they apply to results after costs on a reasonable sample.
| Profit factor | What it usually means |
|---|---|
| Below 1.0 | Losing strategy |
| 1.0 to 1.2 | Thin edge. A small rise in costs or slippage can erase it |
| 1.2 to 1.5 | Workable for many systematic strategies, especially with a large sample |
| 1.5 to 2.0 | Strong, if the sample and costs are realistic |
| 2.0 to 3.0 | Exceptional. Check the code and the sample carefully |
| Above 3.0 | Usually a red flag on a backtest with a decent sample |
Strategy style moves these ranges. A trend-following system with a low win rate and occasional large winners can have a modest profit factor and still be worth trading. A high-frequency intraday strategy needs more headroom, because its costs per unit of profit are higher and small changes in slippage move the number a lot.
Why a very high profit factor is a red flag
A profit factor above about 3 on 100 or more backtested trades is rare in strategies that hold up live. When you see one, check these causes first:
- Lookahead or repainting. A higher-timeframe
request.securitycall that reads future data, or a signal that uses the current bar's high or low to enter earlier in that bar. - Missing costs. No commission, no slippage, or fills at prices the market never offered.
- A few outliers. Remove the three biggest winners and recalculate. If the profit factor collapses, the result depends on luck you can't repeat.
- Hidden tail risk. Strategies that add to losers, use very wide stops or sell volatility can show a high profit factor for years and then give it back in one trade. A backtest that never contains that trade looks excellent.
- Overfitting. Many rounds of tuning on the same data. Our guide to checking whether a backtest is overfit covers the tests.
Sample size changes everything
Profit factor is a ratio of two sums, and with few trades both sums are dominated by a handful of results. A strategy with 25 trades and a profit factor of 2.5 can easily be a strategy with no edge that got lucky. As a rough guide, look for at least 100 trades before you trust the overall figure, and at least 30 trades in any slice you plan to act on.
Backtest vs live: expect it to drop
Most strategies trade worse live than in their backtest. The gap comes from costs and slippage that were underestimated, fills that didn't happen, parameters that were fitted to the past, and markets that changed. There is no reliable percentage to plan around, so the practical approach is to build in headroom: a strategy with a backtested profit factor of 1.15 has very little room to lose before it stops making money.
The fairest comparison is the same period on both sides. Run the backtest over the weeks you traded live and compare the two profit factors trade by trade. Large differences usually point to a specific cause, such as slippage on entries or exits that behave differently in real time.
Profit factor vs Sharpe ratio, expectancy and win rate
These four numbers answer different questions:
| Metric | Standard formula | What it tells you |
|---|---|---|
| Profit factor | Gross profit / gross loss | How many dollars you win for each dollar you lose |
| Win rate | Winning trades / all trades | How often a trade wins, not how much |
| Expectancy | (Win rate x average win) - (loss rate x average loss) | Average profit or loss per trade, in money or R |
| Sharpe ratio | Mean excess return / standard deviation of excess return | Return per unit of volatility, usually on daily or monthly returns |
Win rate
Win rate on its own says nothing about profitability. Profit factor combines it with the size of wins and losses. Each row below uses a different mix and gives a profit factor above 1:
| Win rate | Average win / average loss | Profit factor |
|---|---|---|
| 30% | 3.0 | 1.29 |
| 40% | 2.0 | 1.33 |
| 50% | 1.5 | 1.50 |
| 60% | 1.0 | 1.50 |
| 70% | 0.5 | 1.17 |
| 80% | 0.25 | 1.00 |
An 80% win rate with winners a quarter the size of losers only breaks even before costs. The companion measure, trading expectancy, turns the same inputs into an average profit per trade.
Expectancy
Profit factor is a ratio, so it says nothing about size. A strategy with a profit factor of 1.5 that makes $2 per trade and one that makes $200 per trade score the same. Expectancy tells you the average result per trade, which is what has to stay positive after commission and slippage.
Sharpe ratio
The Sharpe ratio, defined by William Sharpe as the expected excess return divided by the standard deviation of that return (Sharpe, 1994), measures how smooth the returns are over time rather than how trades net out. It is calculated on period returns (daily or monthly), not on individual trades. Two strategies with the same profit factor can have very different Sharpe ratios if one spreads its profit evenly and the other makes it in a few big days.
When profit factor misleads
- Few trades. One large winner can lift profit factor far above 2 on a small sample.
- Order of trades. Profit factor ignores sequence, so a long losing streak and deep drawdown can sit inside a healthy number. Check maximum drawdown and the Sharpe ratio alongside it.
- Costs left out. Profit factor before commission and slippage can drop below 1 once they are added, especially for strategies with small average wins.
Use profit factor to check that wins outweigh losses, expectancy to check the size of the edge per trade, and the Sharpe ratio and drawdown to check whether you could live with the path.
Profit factor by market condition
The single profit factor in a strategy report is an average over every condition the strategy traded in. Split the trades and the picture often changes. Using the same 120 trades from the example above:
| Session | Trades | Gross profit | Gross loss | Profit factor |
|---|---|---|---|---|
| Asia | 40 | $3,600 | $4,400 | 0.82 |
| London | 45 | $6,300 | $3,900 | 1.62 |
| New York | 35 | $6,300 | $3,580 | 1.76 |
| All | 120 | $16,200 | $11,880 | 1.36 |
Here one session loses money and the other two carry the strategy. Without the Asian trades the profit factor would be 1.68. Before acting on that, check the trade counts: 35 to 45 trades per slice is enough to ask the question, not to answer it. Test the change on a period you didn't use to find it.
Tessera's statistics dashboard shows results by symbol and session from an imported strategy tester export or trade history, and the reports add weekday, time of day and volatility with the trade count behind each slice.
Calculate it yourself in a spreadsheet
Export your trades (in TradingView, from the List of Trades tab of the Strategy Tester) and put the net profit of each trade in one column. If your P&L is in column D from row 2 to row 500, this works in Excel and Google Sheets:
=SUMIF(D2:D500,">0")/ABS(SUMIF(D2:D500,"<0"))To get profit factor for one condition, add a column with the session or weekday and use SUMIFS. With the session in column C:
=SUMIFS(D2:D500,C2:C500,"London",D2:D500,">0")/ABS(SUMIFS(D2:D500,C2:C500,"London",D2:D500,"<0"))Two things to check in your export: that the P&L column is net of commission, and that each trade appears once. Some exports list an entry row and an exit row per trade, so filter to one row per trade before summing.
If you would rather not build the pivot tables, a free Entry Analysis report breaks your trades from a synced broker, a platform export or any spreadsheet down by session, weekday, time of day and volatility, with no card needed.
The free profit factor calculator works it out from gross profit and loss or a pasted list of trades. Tessera's statistics dashboard shows profit factor for every strategy you import, next to expectancy and drawdown.
Frequently asked questions
- Is a profit factor of 1.5 good?
- For most systematic strategies, yes. A profit factor of 1.5 after realistic commission and slippage, on 100 or more trades, means the strategy made $1.50 for every $1 it lost. Check that it holds on a period the strategy wasn't tuned on before relying on it.
- What is the difference between profit factor and win rate?
- Win rate counts how often a strategy wins. Profit factor compares how much it made in total with how much it lost in total, so it accounts for the size of wins and losses. A strategy can win 70% of the time and still have a profit factor below 1 if its losses are much larger than its wins.
- Can profit factor be too high?
- On a backtest, yes. A profit factor above about 3 on a decent sample is often caused by lookahead, missing costs, a few outlier trades or overfitting. Check those before believing it.
- How many trades do I need for profit factor to mean anything?
- As a rough guide, at least 100 trades for the overall figure and at least 30 in any session, weekday or other slice you plan to act on. With fewer trades a handful of results can decide the number.
- Does TradingView's profit factor include commission?
- TradingView calculates profit factor from closed trades, and those trades are simulated with whatever commission and slippage your strategy's properties specify. If both are left at zero, the profit factor ignores costs, so set them to match your broker before reading the report.
Keep reading
 Trading metrics
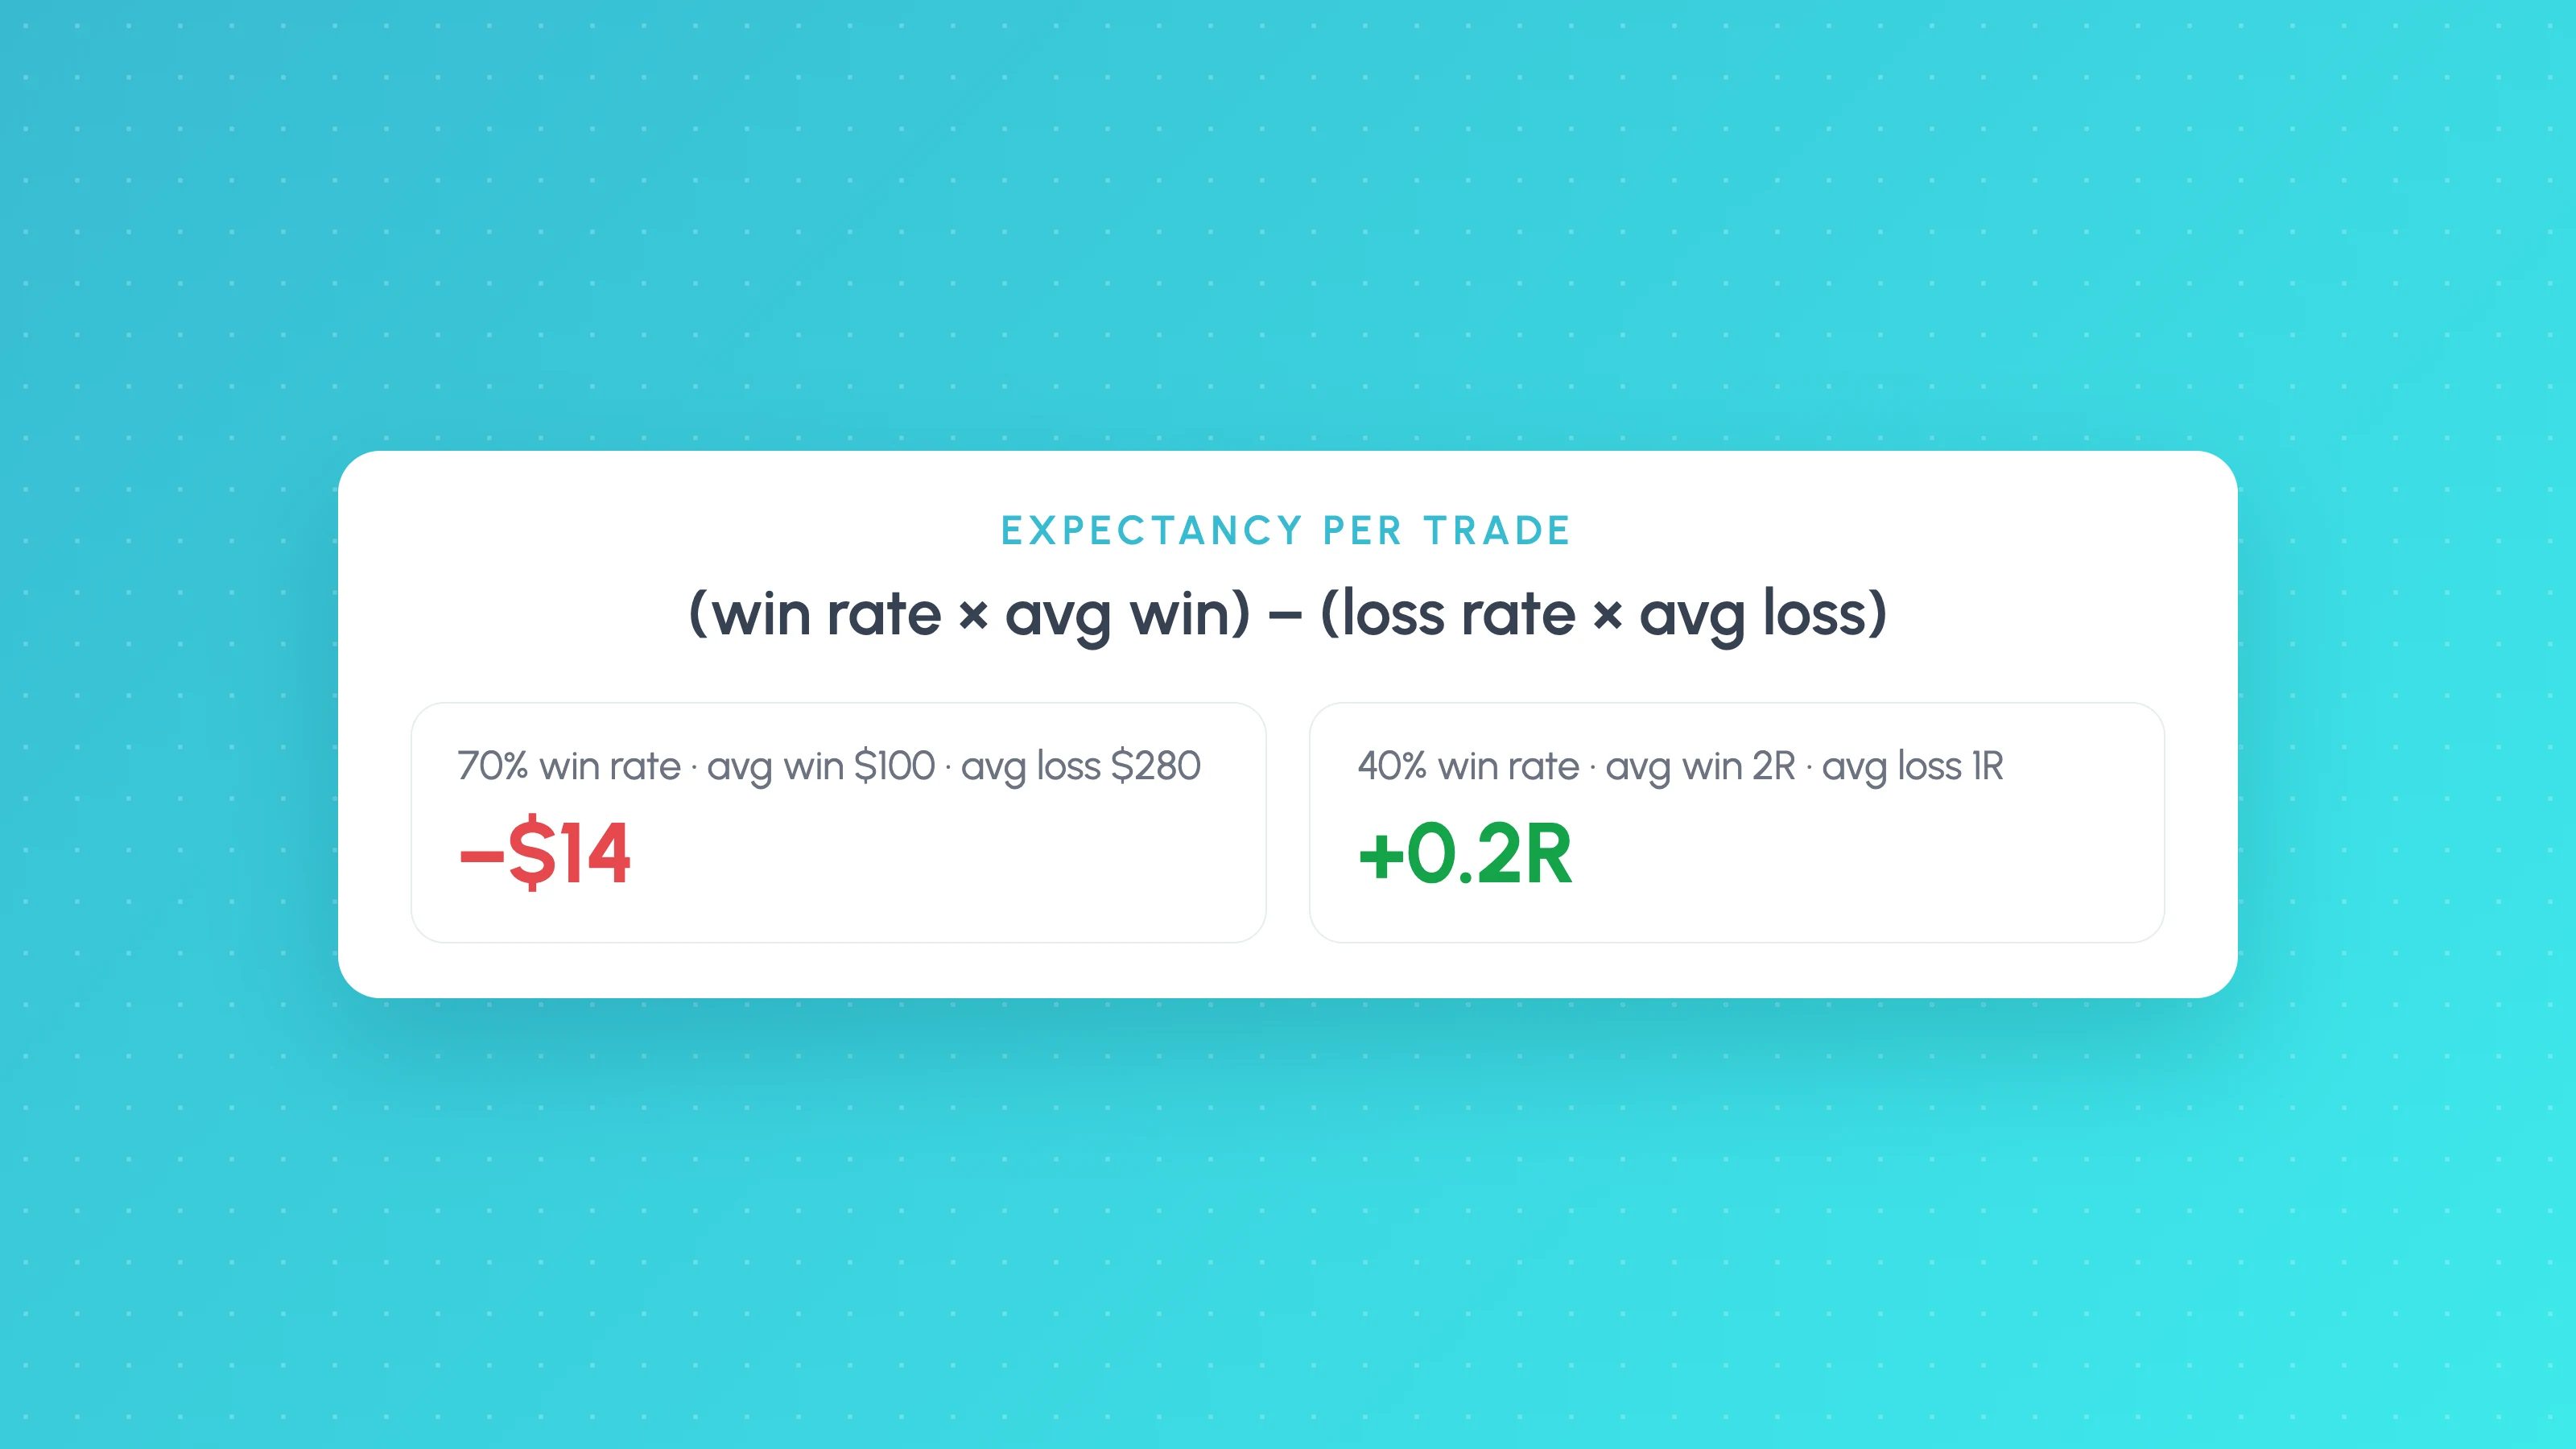
Trading Expectancy Formula: In Currency and R, With Examples
Expectancy = win rate x average win minus loss rate x average loss. Worked examples in currency and R, why 70% win rates lose, and spreadsheet formulas.
 Trading metrics
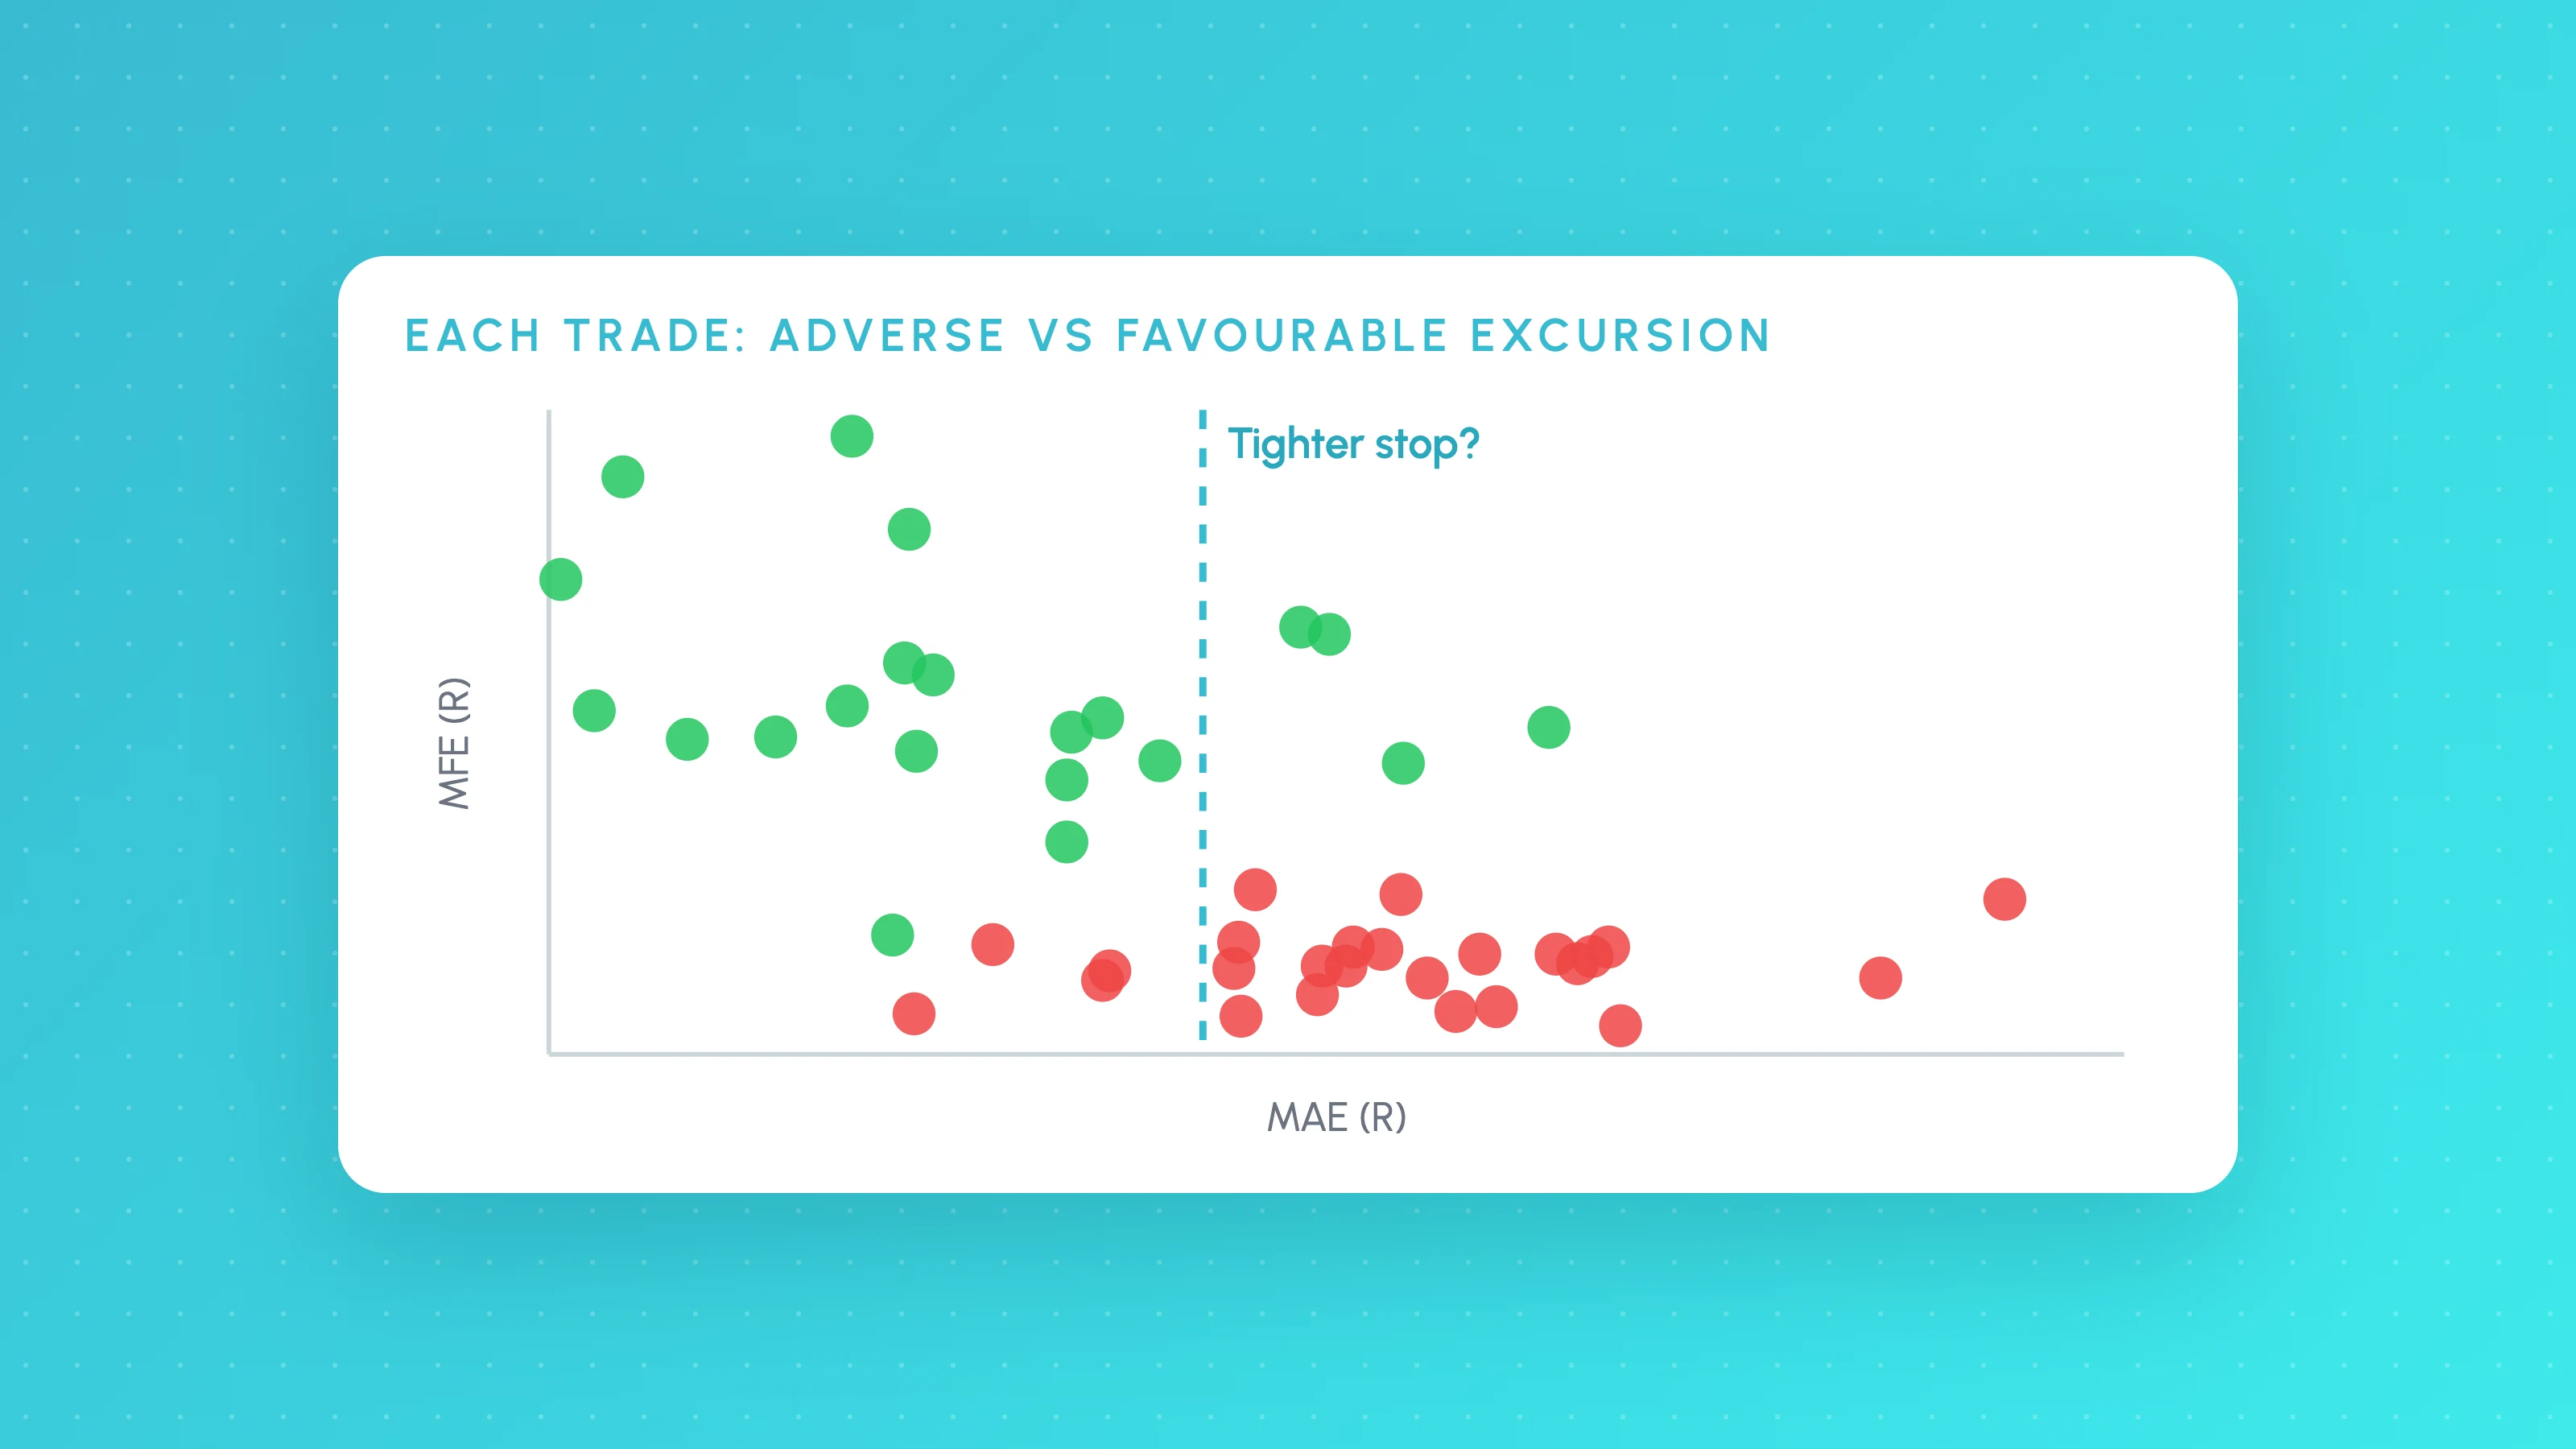
MAE and MFE Analysis: Set Stops and Targets From Your Own Trades
How to calculate MAE and MFE for each trade, read the scatter plots, set stops from winners' MAE and targets from MFE, then test the change on real candles.
 TradingView backtests
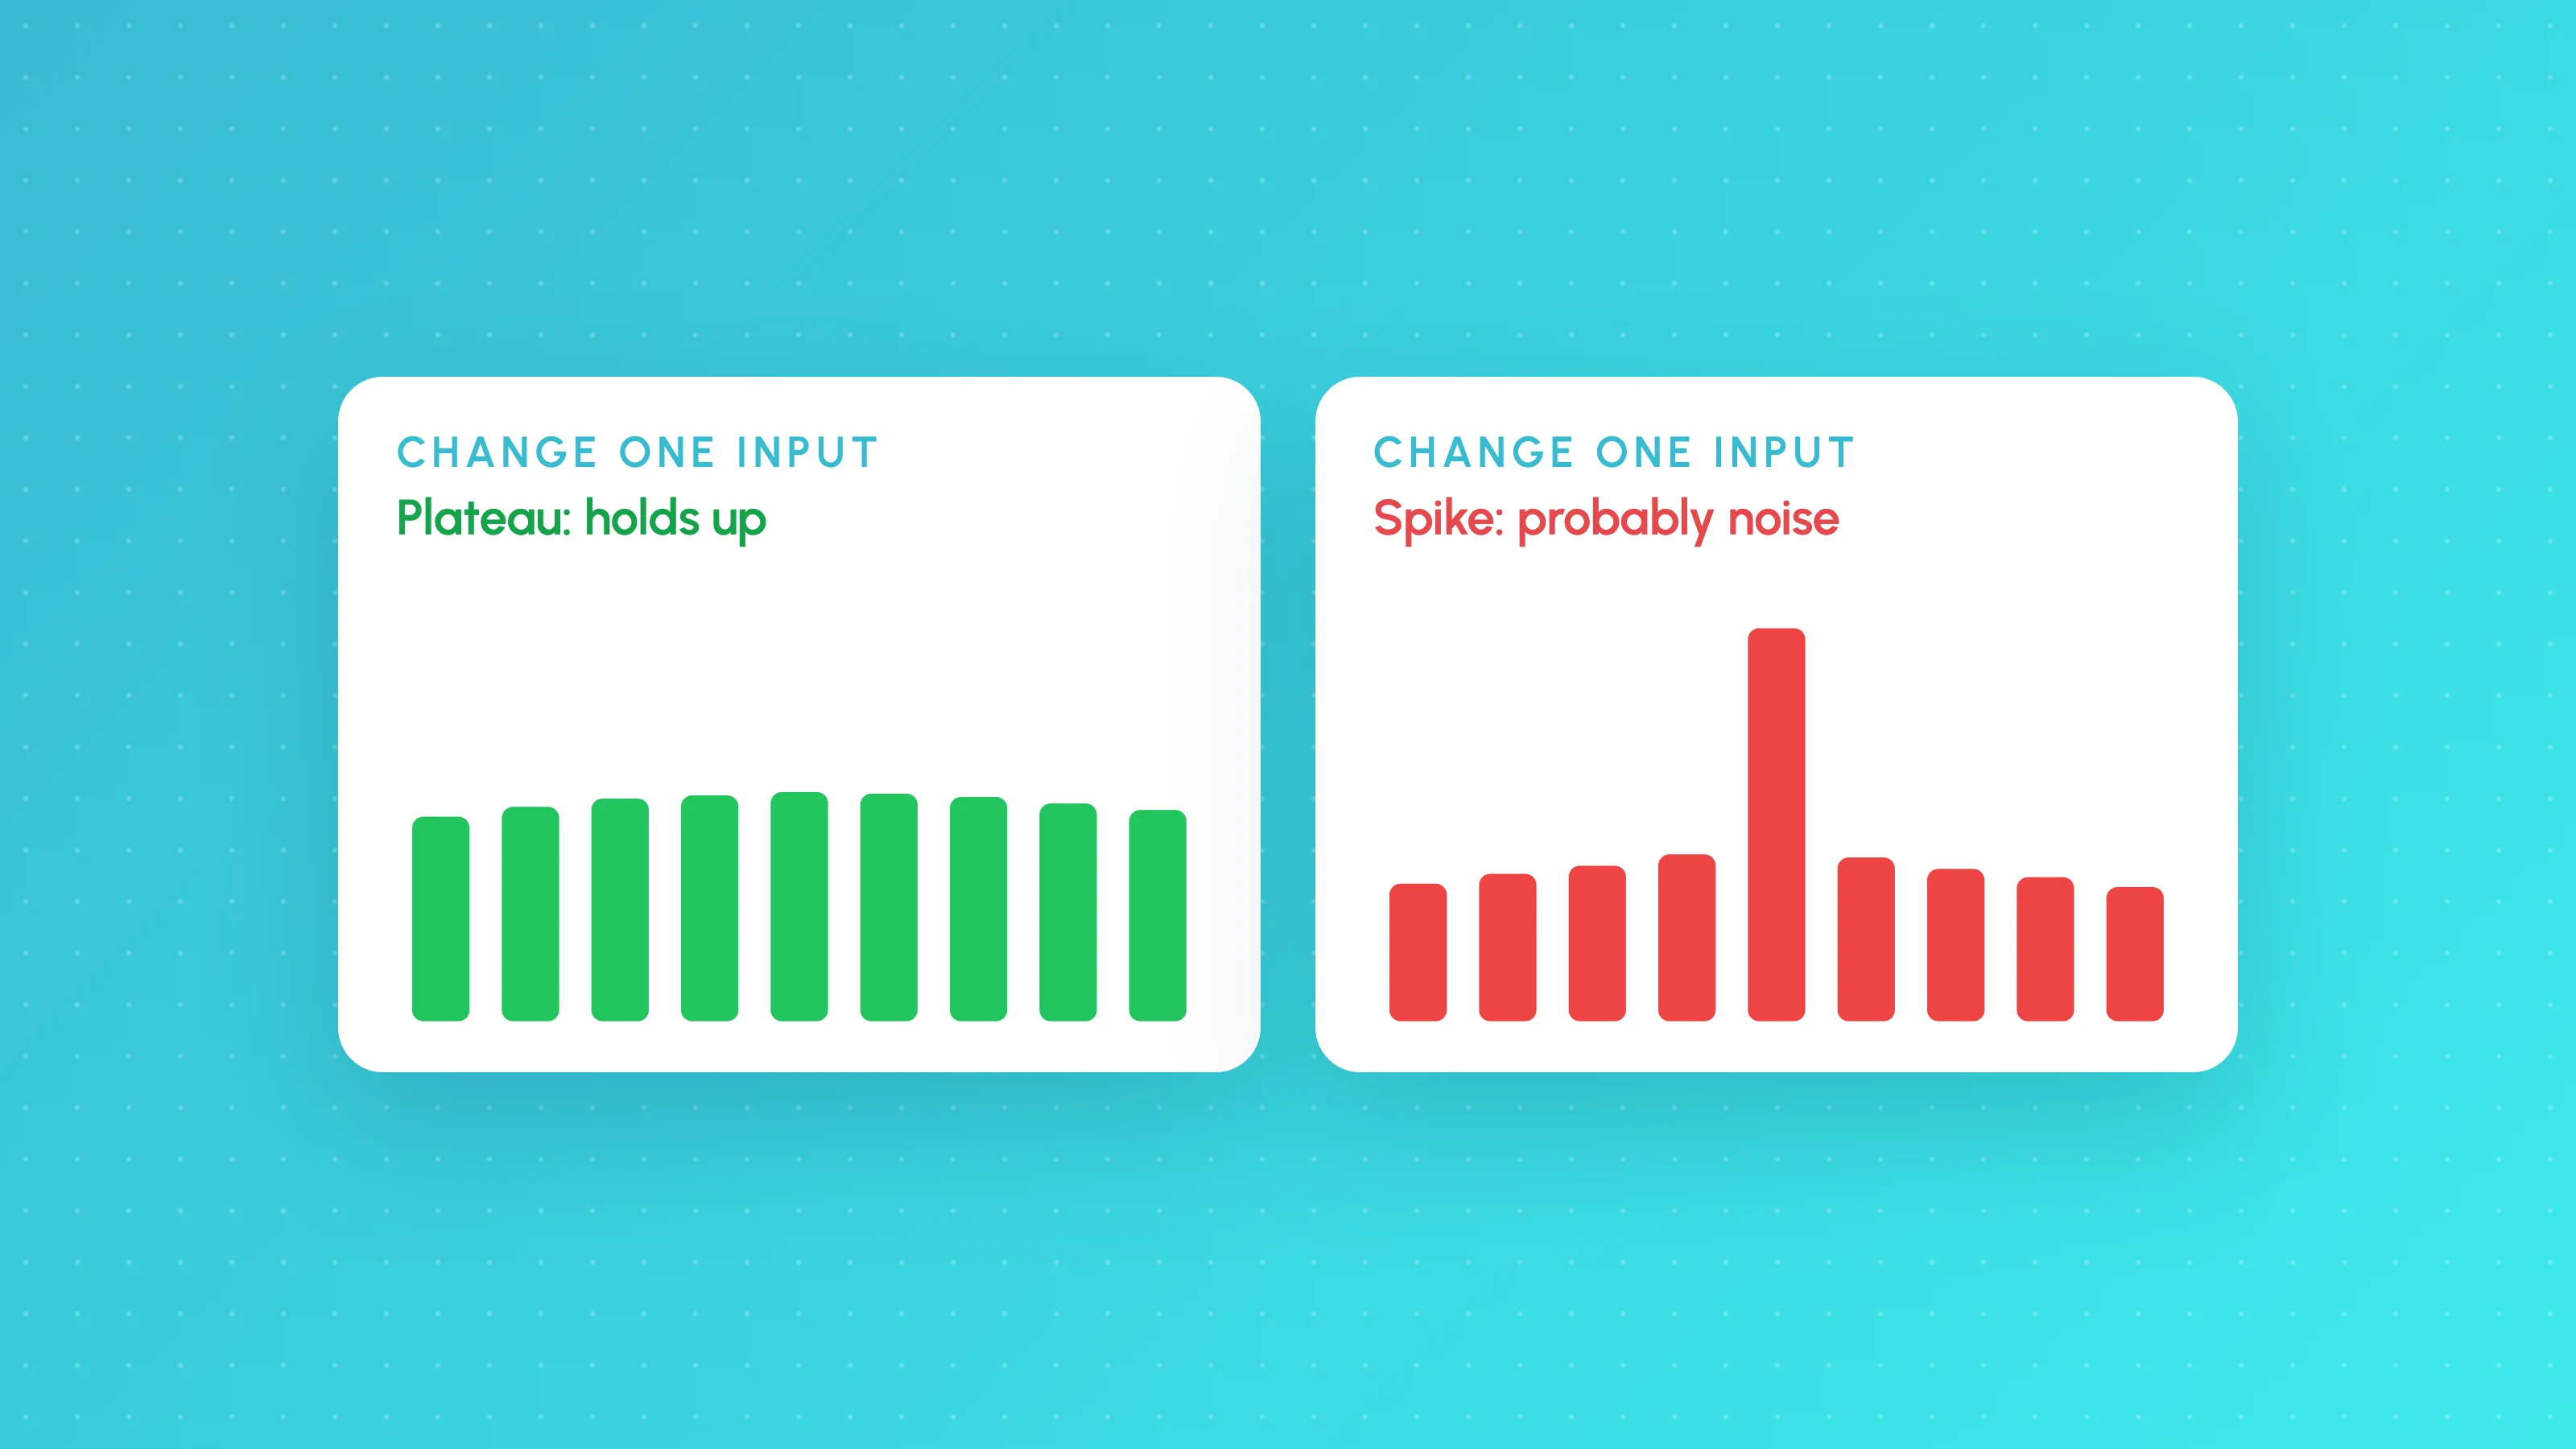
Is My Backtest Overfit? A Practical Checklist for Traders
How to tell if a backtest is overfit: too-good metrics, thin samples, fragile inputs, useless filters, out-of-sample and walk-forward tests, plus a checklist.