
Profit Factor Calculator
Profit factor is gross profit divided by gross loss: how many units you win for each unit you lose. Enter the two totals or paste a list of trade results to get the profit factor, and see where it sits against the ranges systematic traders commonly use.
Profit factor
1.36
16,200.00 / 11,880.00
Net profit
+4,320.00
Gross profit − gross loss
Range: 1.2 to 1.5
Workable for many systematic strategies, especially with a large sample.
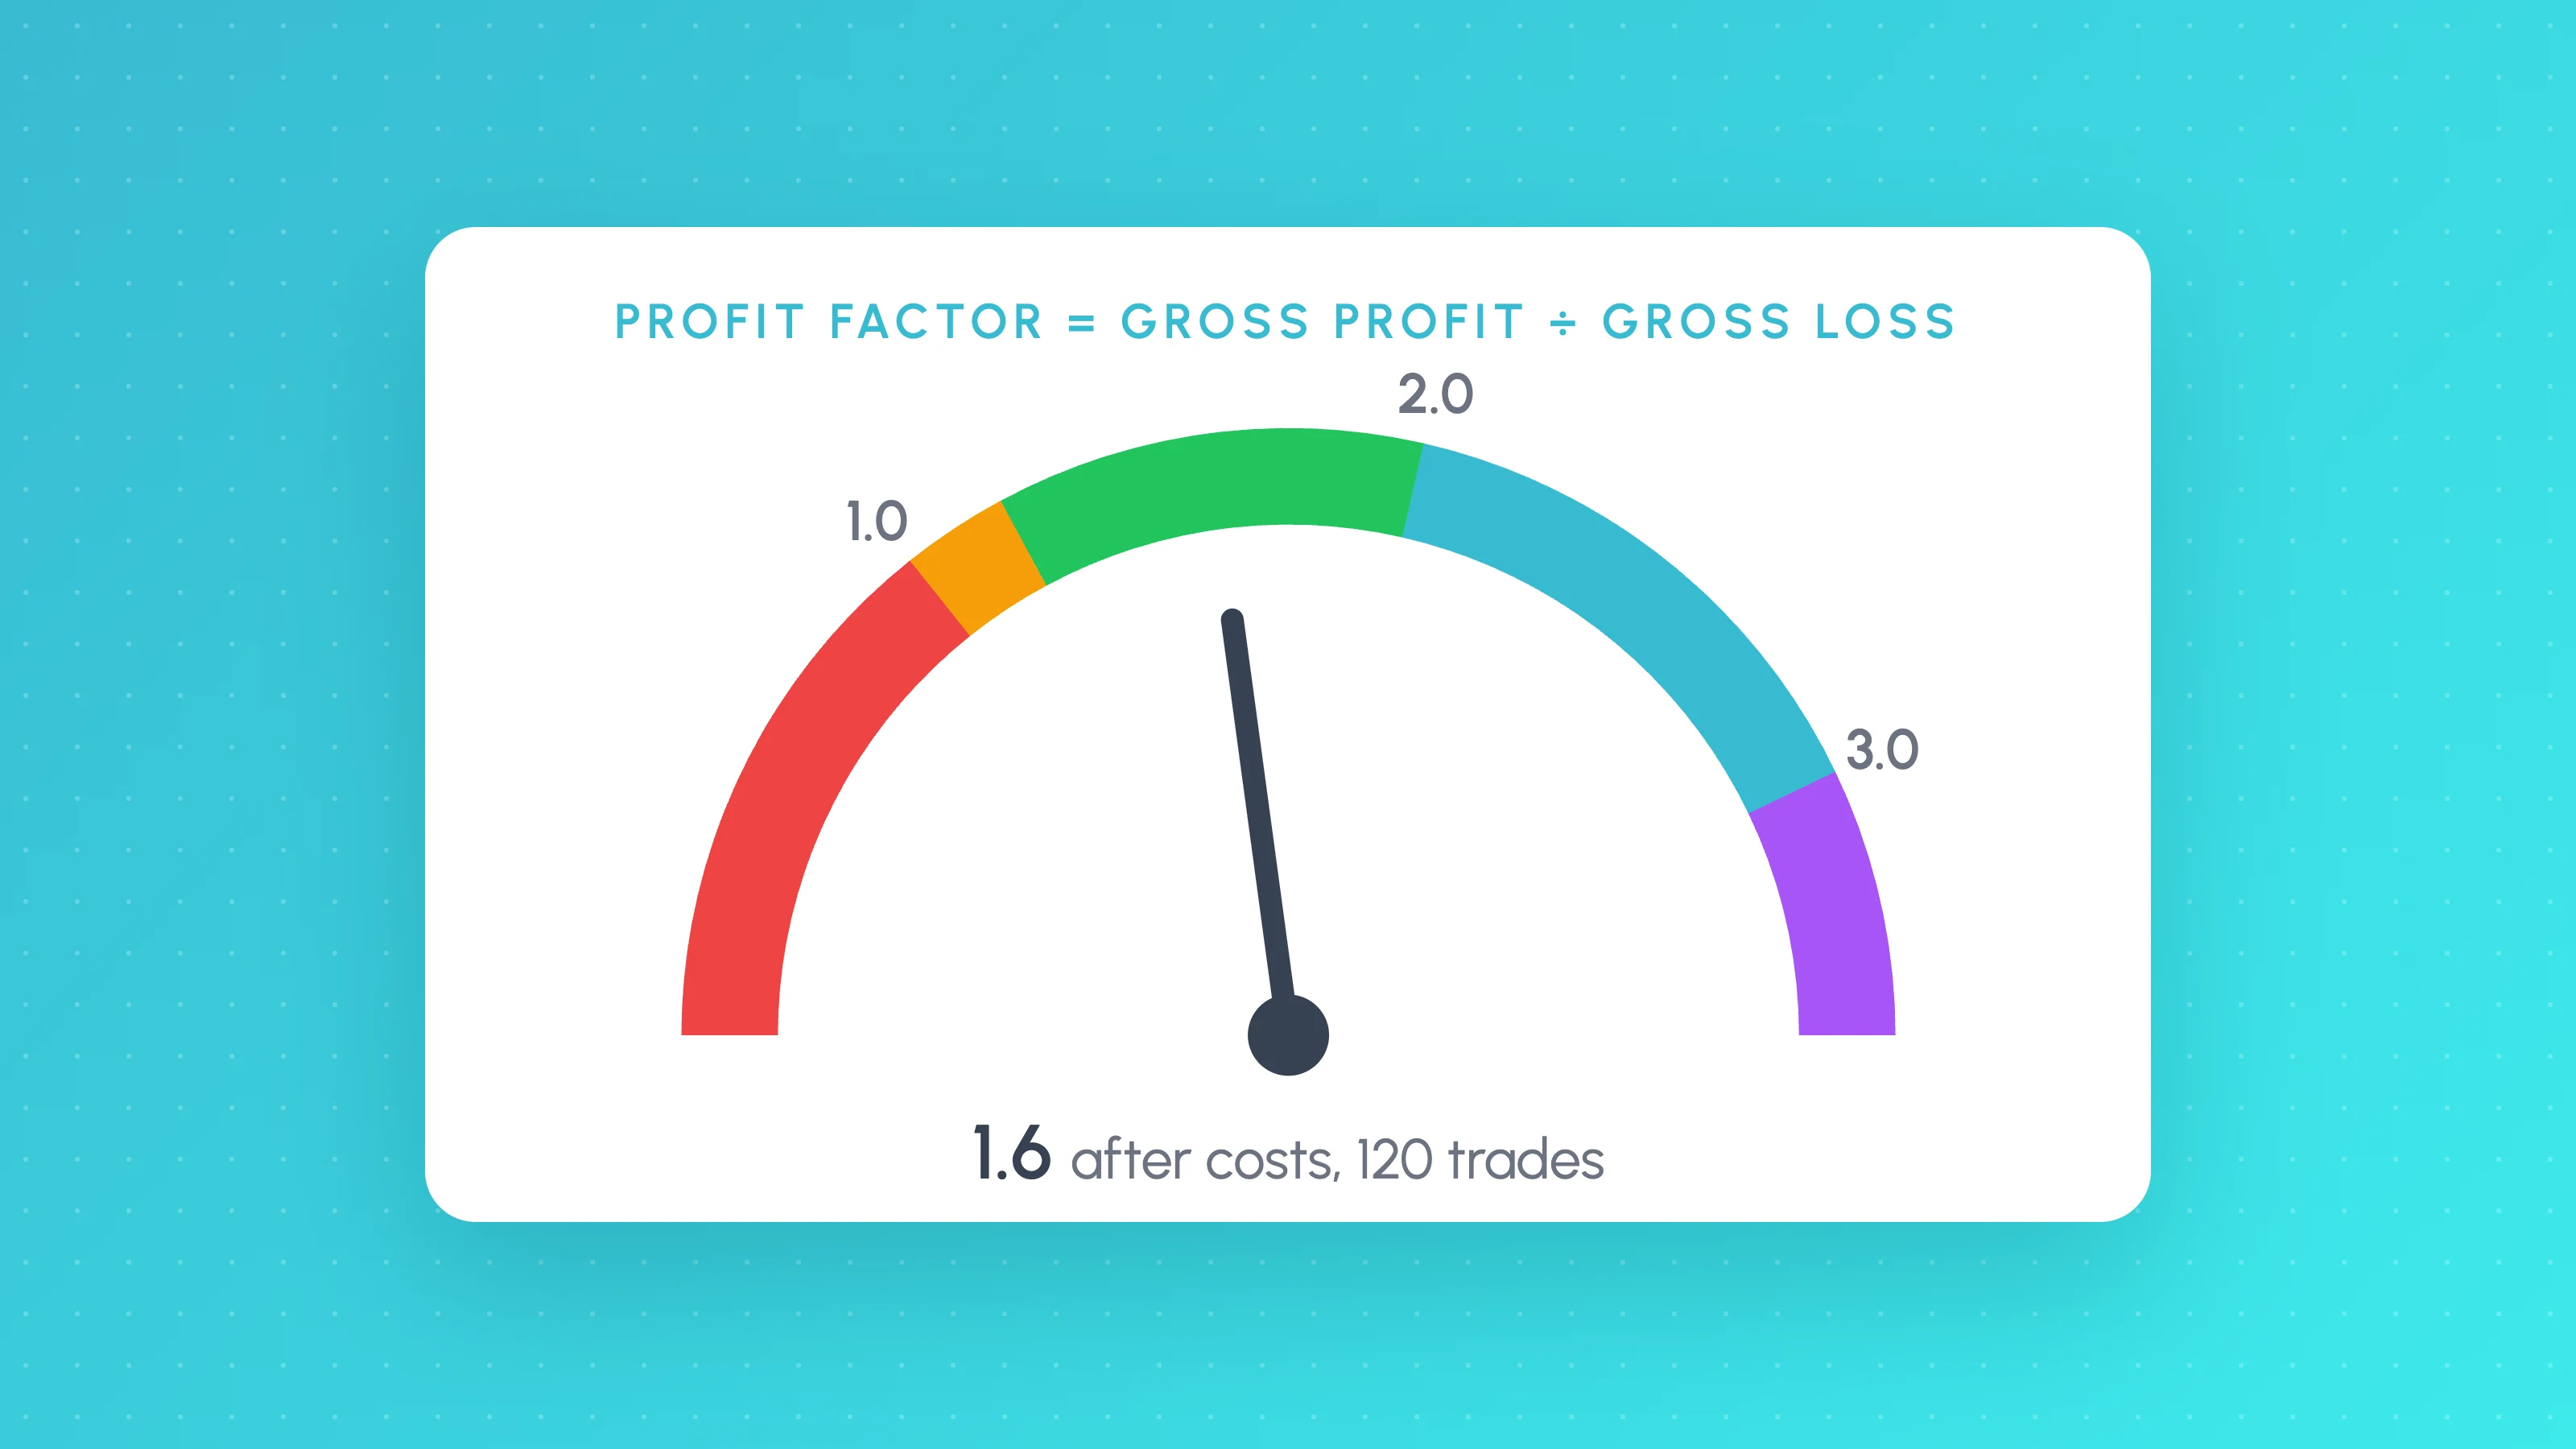
| Below 1.0 | Losing strategy |
|---|---|
| 1.0 to 1.2 | Thin edge. A small rise in costs or slippage can erase it |
| 1.2 to 1.5 | Workable for many systematic strategies, especially with a large sample |
| 1.5 to 2.0 | Strong, if the sample and costs are realistic |
| 2.0 to 3.0 | Exceptional. Check the code and the sample carefully |
| Above 3.0 | Usually a red flag on a backtest with a decent sample |
The profit factor formula
Profit factor = Gross profit / Gross loss
             = (Win rate × Average win) / (Loss rate × Average loss)
Gross profit is the sum of all winning trades; gross loss is the sum of all losing trades, taken as a positive number. Use closed trades only, after commission and slippage. If there are no losing trades the profit factor is undefined.
Worked example
120 trades: 54 winners averaging $300 and 66 losers averaging $180. Gross profit is 54 × $300 = $16,200, gross loss is 66 × $180 = $11,880, so the profit factor is $16,200 / $11,880 = 1.36. Add $10 per trade in costs and the winners shrink to $290 and the losers grow to $190: $15,660 / $12,540 = 1.25.
Profit factor ranges
These are rules of thumb, not research findings, and they assume results after costs on a reasonable sample. They come from our guide to what counts as a good profit factor.
| Profit factor | What it usually means |
|---|---|
| Below 1.0 | Losing strategy |
| 1.0 to 1.2 | Thin edge. A small rise in costs or slippage can erase it |
| 1.2 to 1.5 | Workable for many systematic strategies, especially with a large sample |
| 1.5 to 2.0 | Strong, if the sample and costs are realistic |
| 2.0 to 3.0 | Exceptional. Check the code and the sample carefully |
| Above 3.0 | Usually a red flag on a backtest with a decent sample |
Strategy style moves these ranges: a trend-following system with a low win rate can have a modest profit factor and still be worth trading, while a high-frequency strategy needs more headroom for costs. Profit factor also says nothing about size, so read it alongside expectancy.
 FAQs
Questions about the profit factor calculator
Guides behind the maths
 Trading metrics
9 min read
What Is a Good Profit Factor? Formula, Ranges and Red Flags
A good profit factor is usually 1.3 to 2.0 after costs on 100+ trades. See the formula, a worked example, a spreadsheet calculator and why above 3 is a warning.
 Trading metrics
8 min read
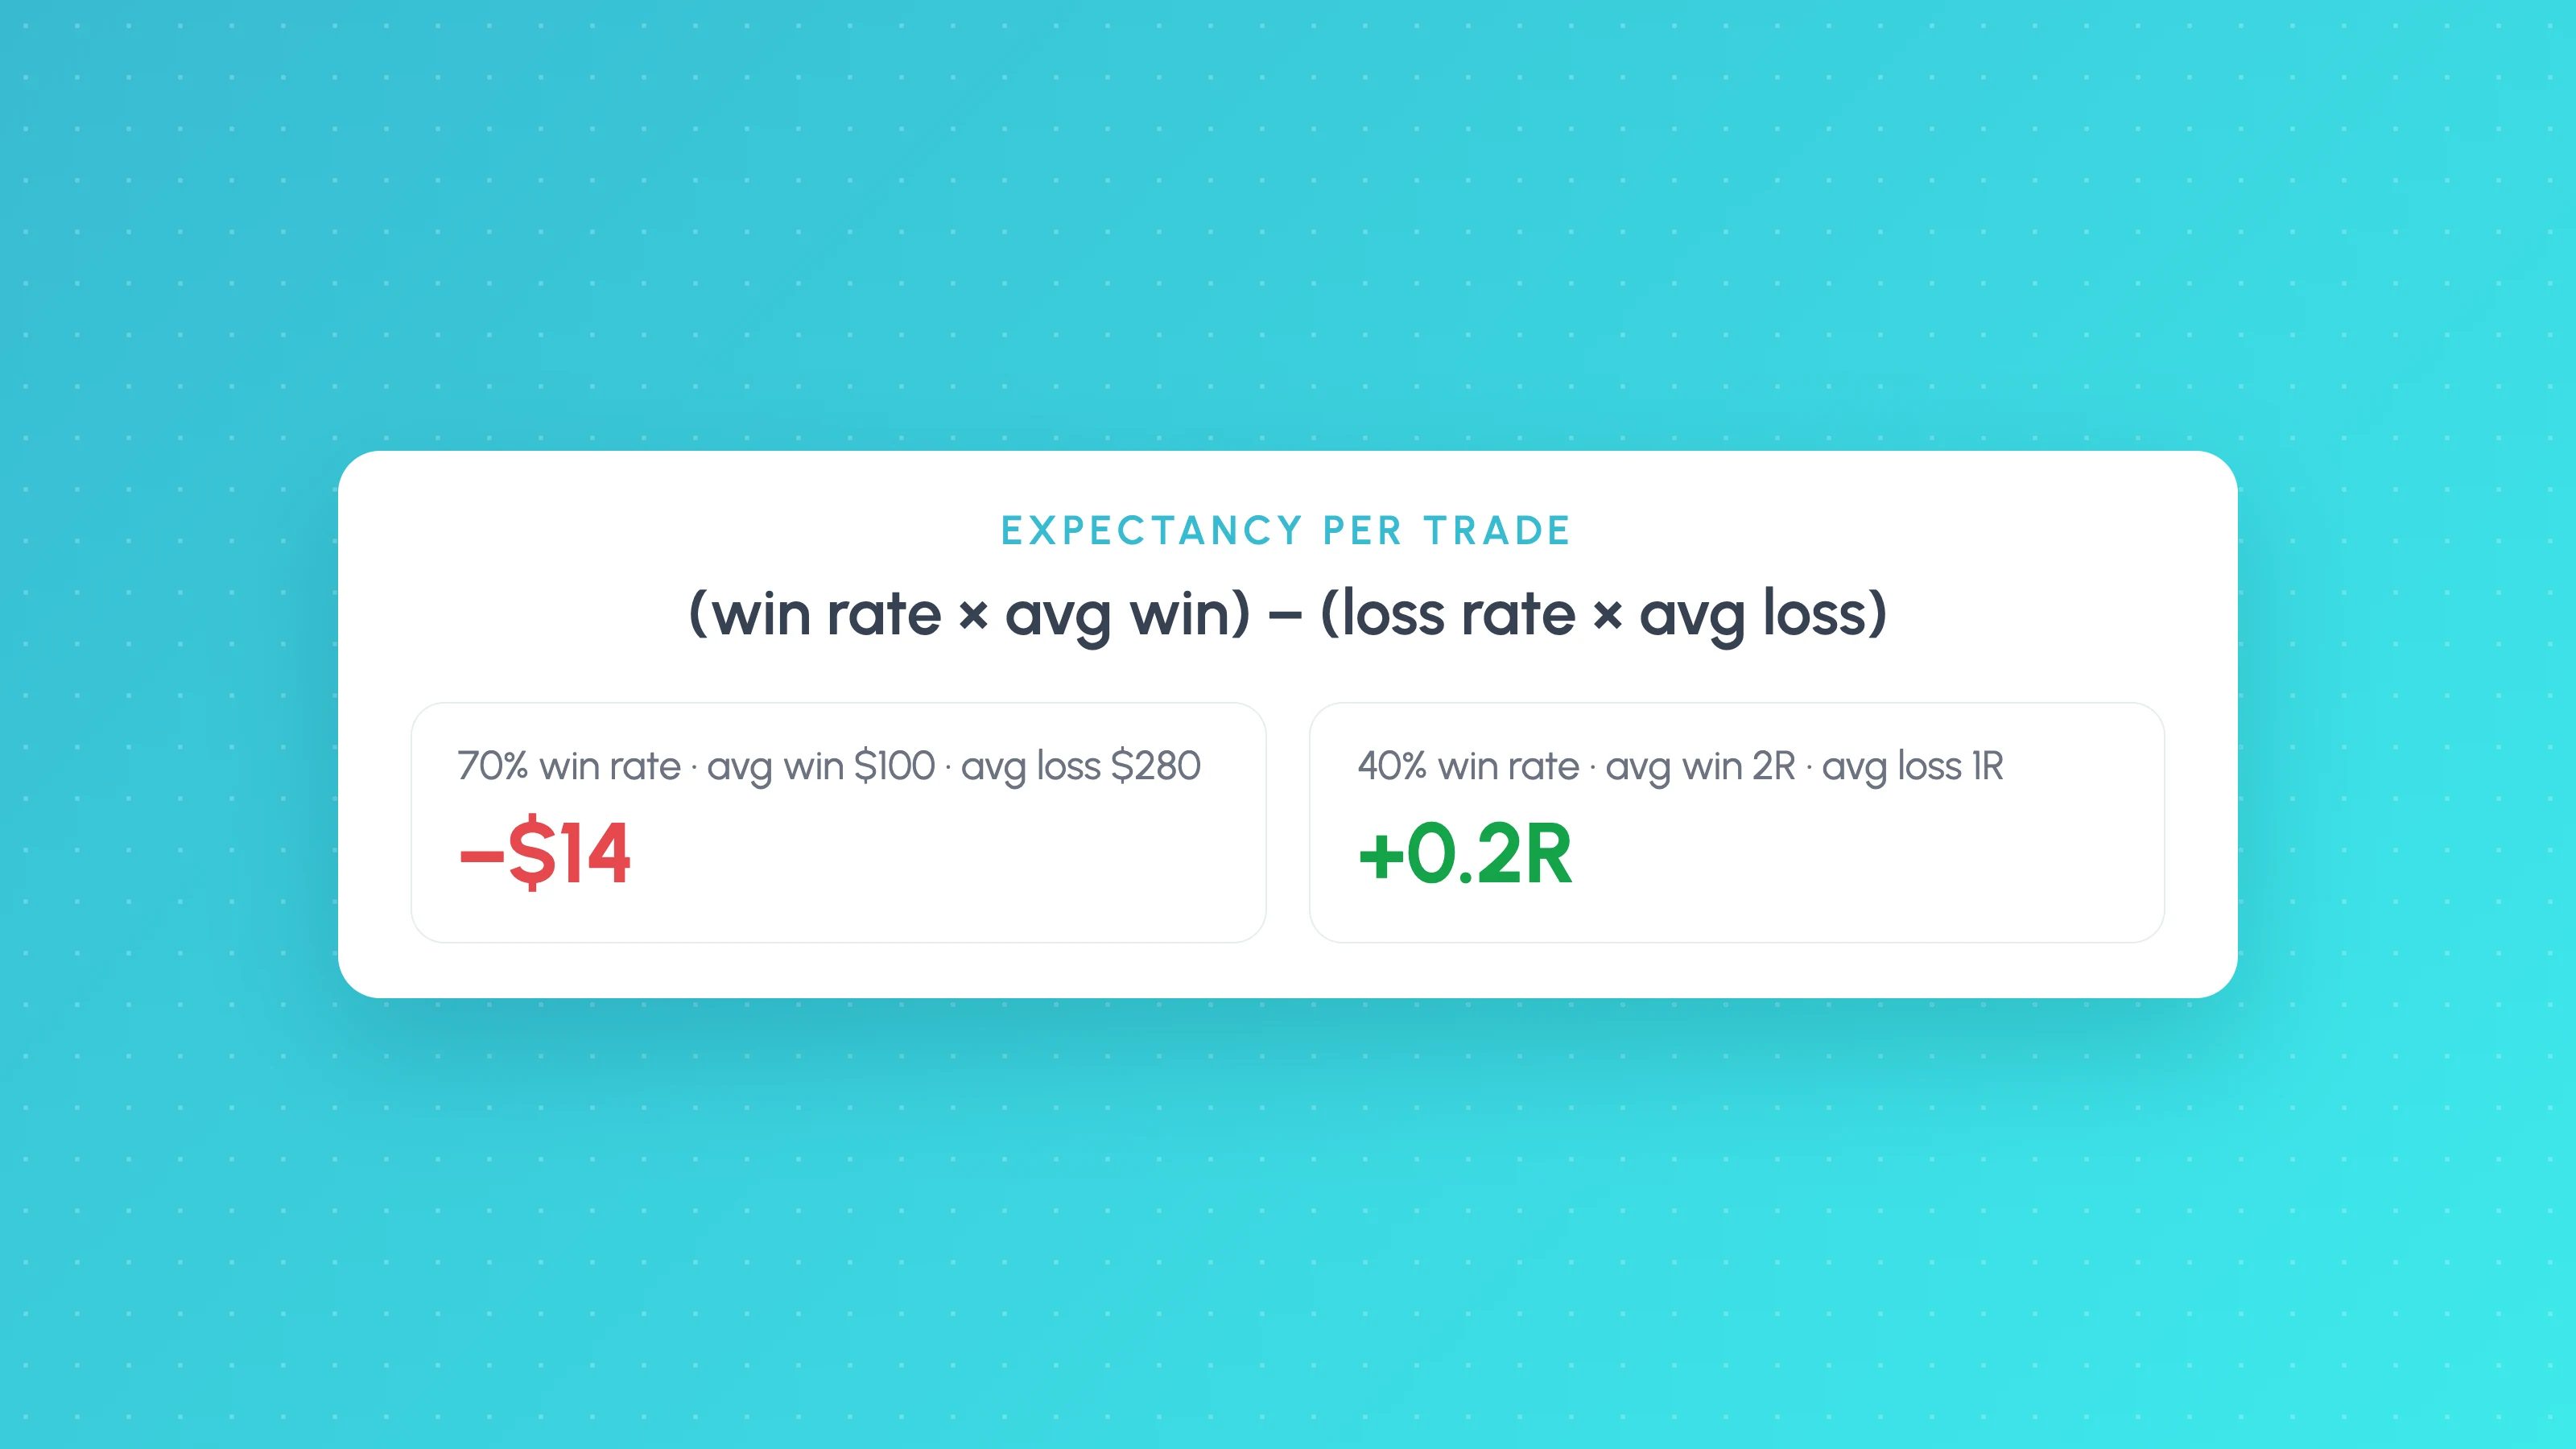
Trading Expectancy Formula: In Currency and R, With Examples
Expectancy = win rate x average win minus loss rate x average loss. Worked examples in currency and R, why 70% win rates lose, and spreadsheet formulas.
 TradingView backtests
10 min read
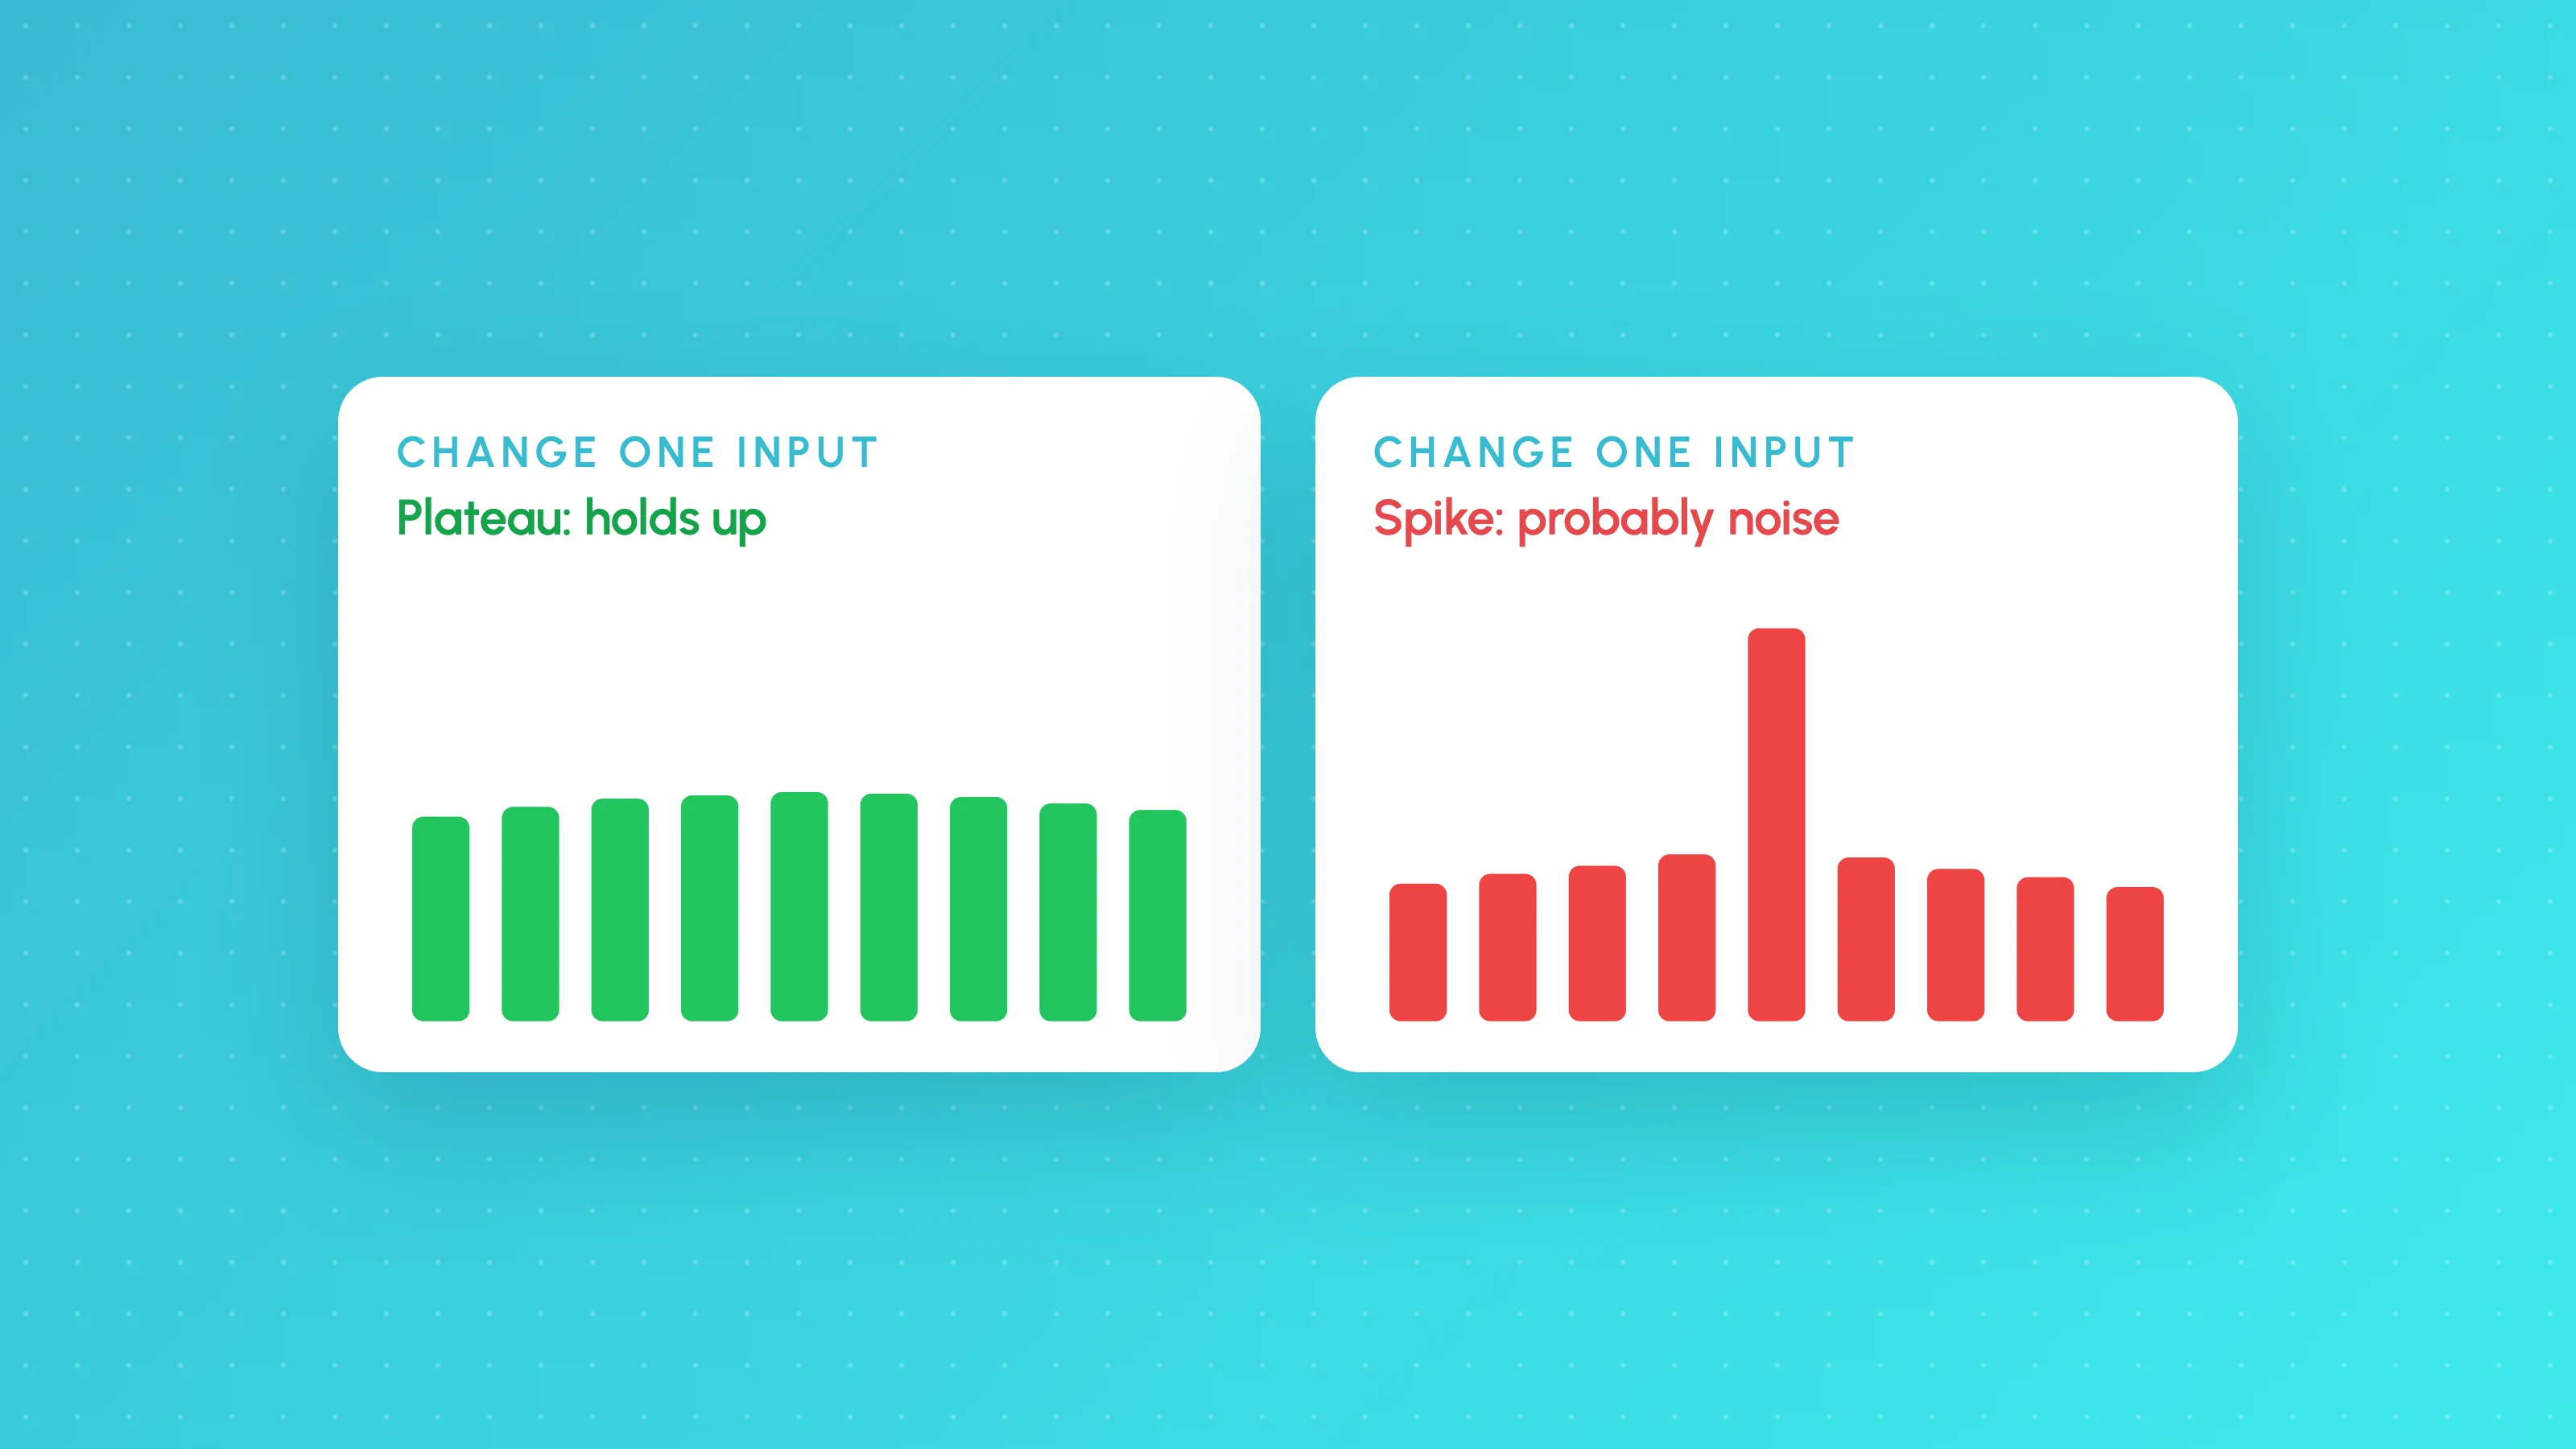
Is My Backtest Overfit? A Practical Checklist for Traders
How to tell if a backtest is overfit: too-good metrics, thin samples, fragile inputs, useless filters, out-of-sample and walk-forward tests, plus a checklist.