
Trading Expectancy Calculator
Expectancy is the average amount a strategy makes or loses per trade. Enter your win rate, average win and average loss, or paste a list of trade results, to get expectancy in currency and in R, the breakeven win rate and the profit factor.
Expectancy per trade
+36.00
Average result per trade, same currency as your inputs
Expectancy in R
0.20R
Using the average loss as 1R
Breakeven win rate
37.5%
At these average win and loss sizes; yours is 45.0%
Profit factor
1.36
Gross profit / gross loss
(45.0% × 300.00) − (55.0% × 180.00) = +36.00
Over 100 trades that averages +3,600.00 before any variation. Real results scatter widely around that figure; the Monte Carlo simulator shows how widely.
The expectancy formula
Expectancy     = (Win rate × Average win) − (Loss rate × Average loss)
Expectancy (R) = Expectancy / Risk per trade (1R)
Breakeven win rate = Average loss / (Average win + Average loss)
Win rate and loss rate are fractions that add up to 1, and the average win and average loss are both positive. With a trade list, the calculator works out those inputs for you; breakeven trades count as neither, so the result equals your net profit divided by the number of trades.
Worked example
A strategy has 120 trades: 54 winners averaging $300 and 66 losers averaging $180.
| Win rate | 54 / 120 = 45% |
|---|---|
| Loss rate | 66 / 120 = 55% |
| Expectancy | (0.45 × $300) − (0.55 × $180) = $135 − $99 = $36 per trade |
| Check | ($16,200 − $11,880) / 120 = $36 |
| In R, risking $150 | $36 / $150 = 0.24R per trade |
Those are the calculator's default inputs, so you can check the numbers above against it. The breakeven win rate at those sizes is $180 / ($300 + $180) = 37.5%: below that, the same average win and loss would lose money.
Reading the result
- Use results after costs. Commission and slippage come off every trade, so a thin expectancy can disappear once they are included.
- Compare in R.Currency expectancy grows with position size; R doesn't, so it is the fair way to compare strategies.
- Mind the sample. With a few dozen trades, a couple of outliers decide the average.
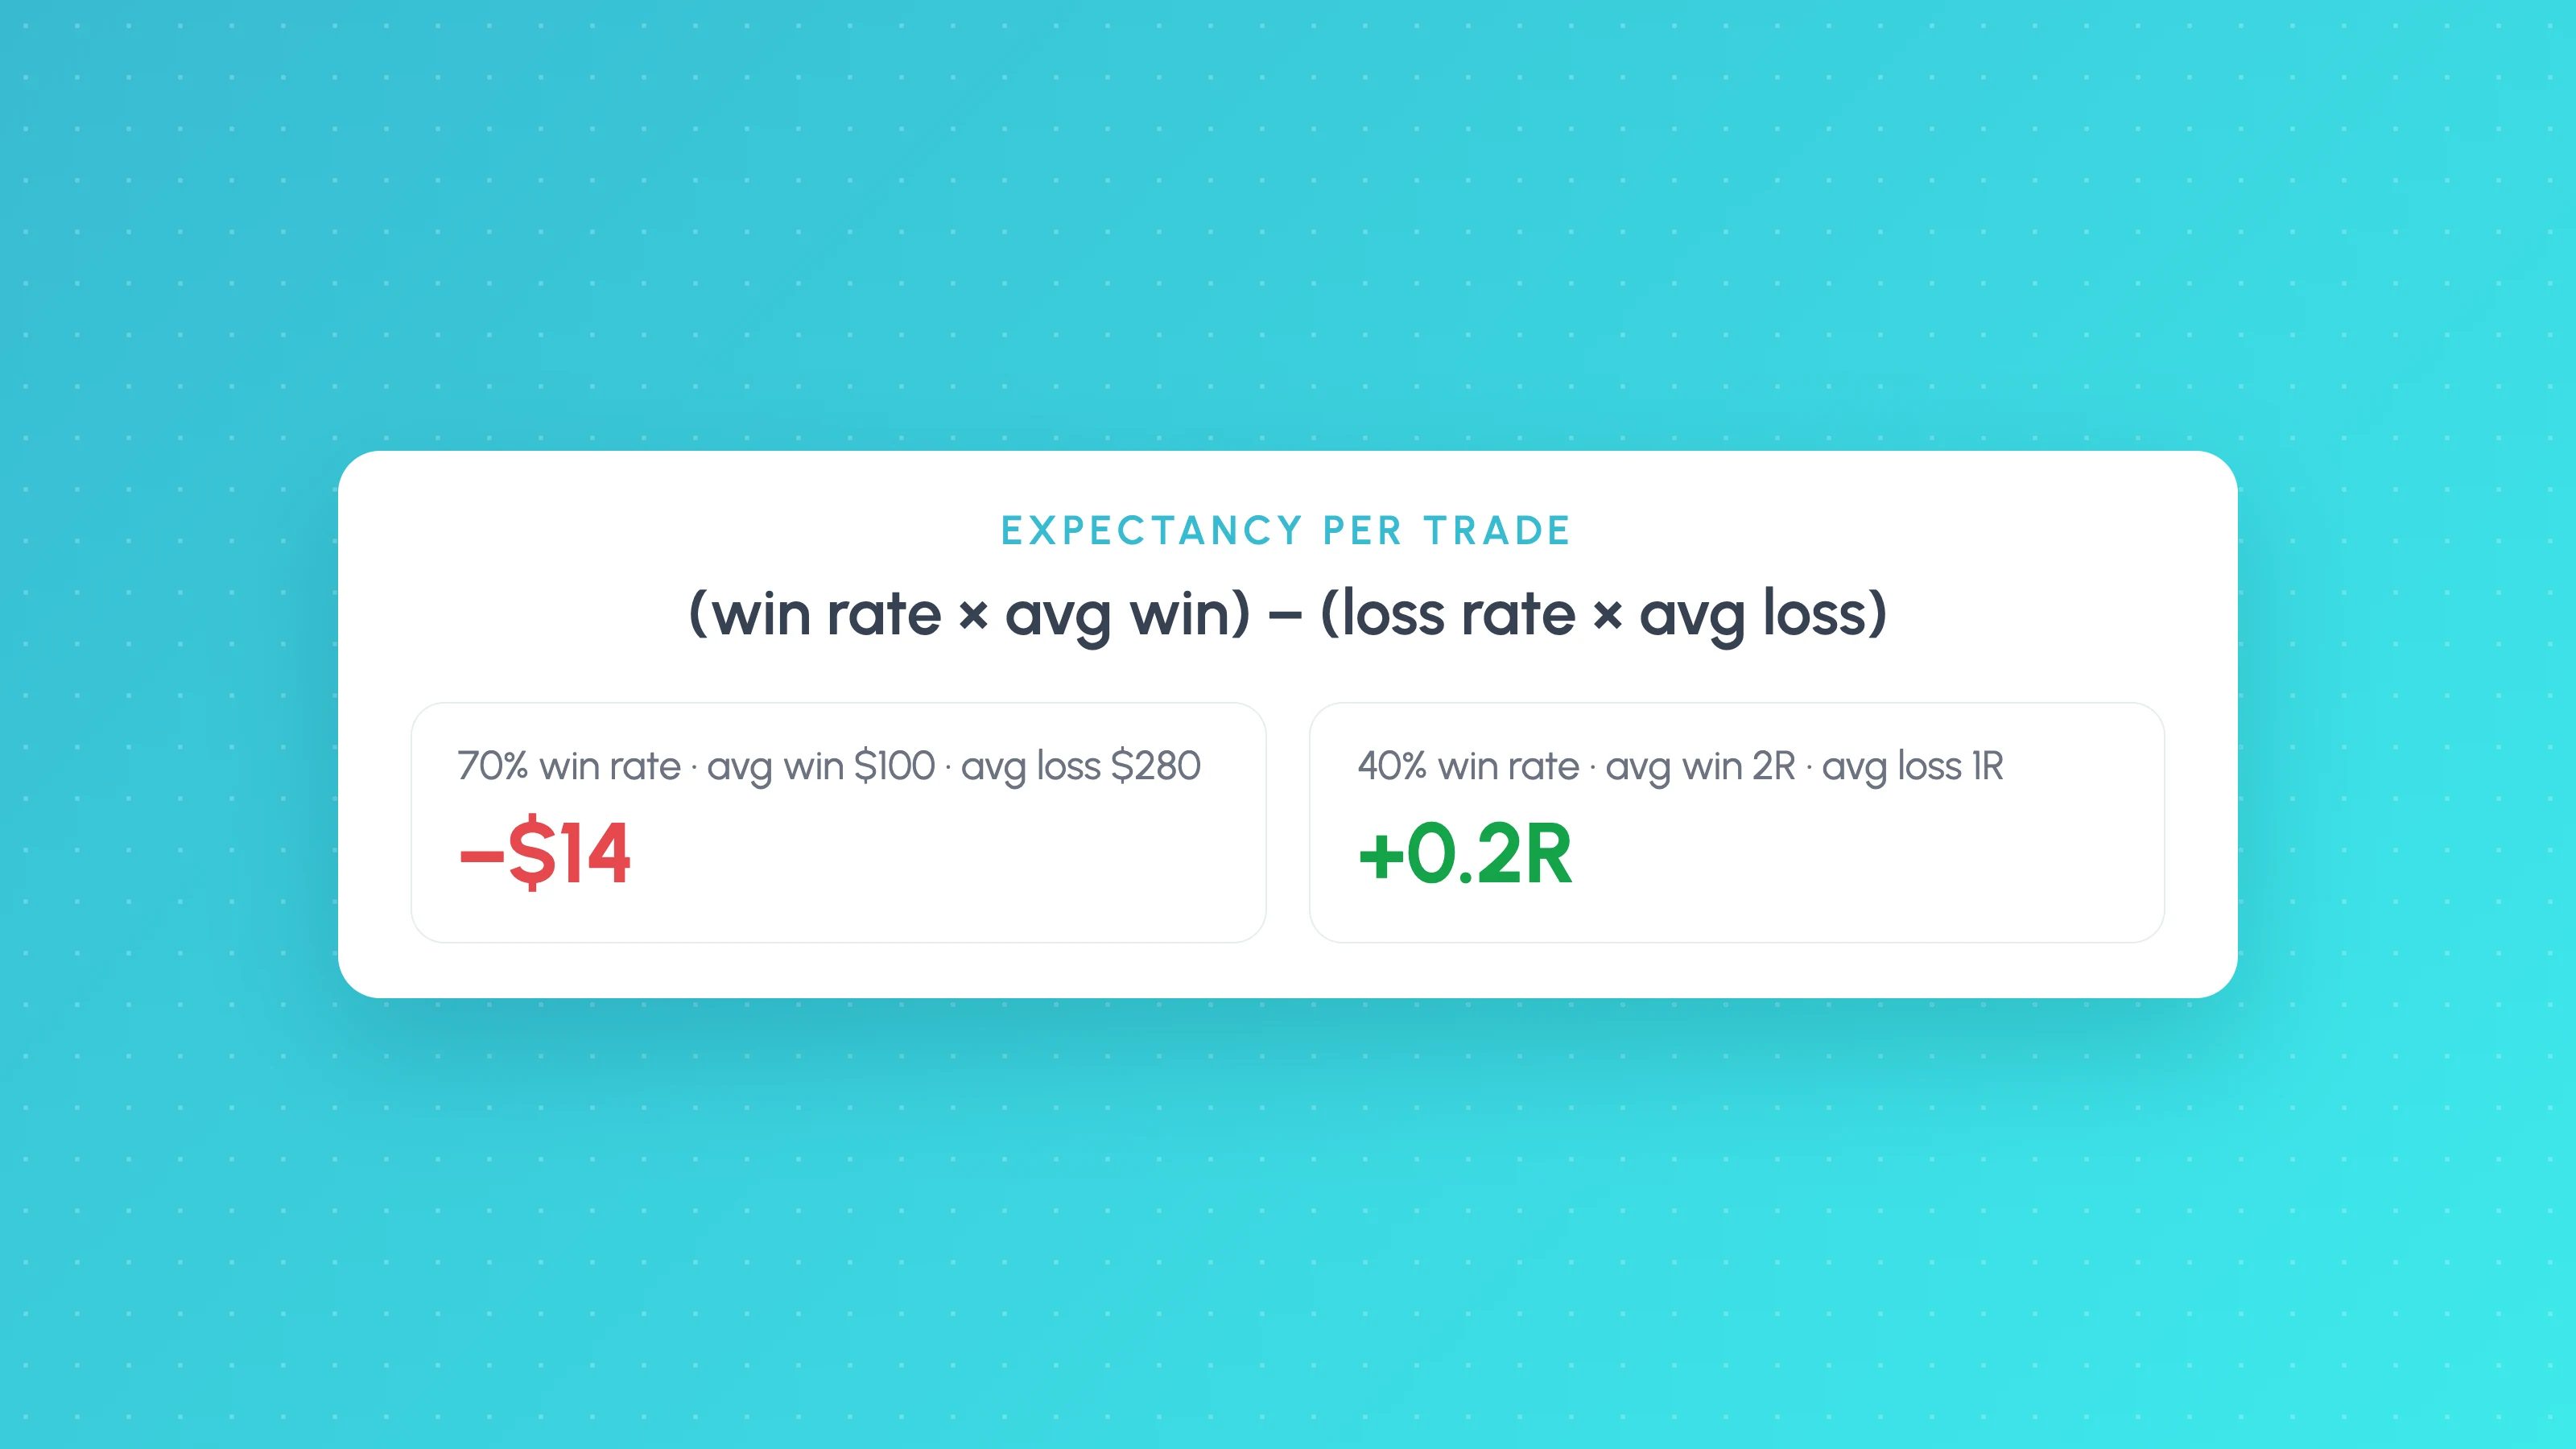
The full explanation, including why a 70% win rate can lose money, is in our trading expectancy guide.
 FAQs
Questions about the trading expectancy calculator
Guides behind the maths
 Trading metrics
8 min read
Trading Expectancy Formula: In Currency and R, With Examples
Expectancy = win rate x average win minus loss rate x average loss. Worked examples in currency and R, why 70% win rates lose, and spreadsheet formulas.
 Trading metrics
11 min read
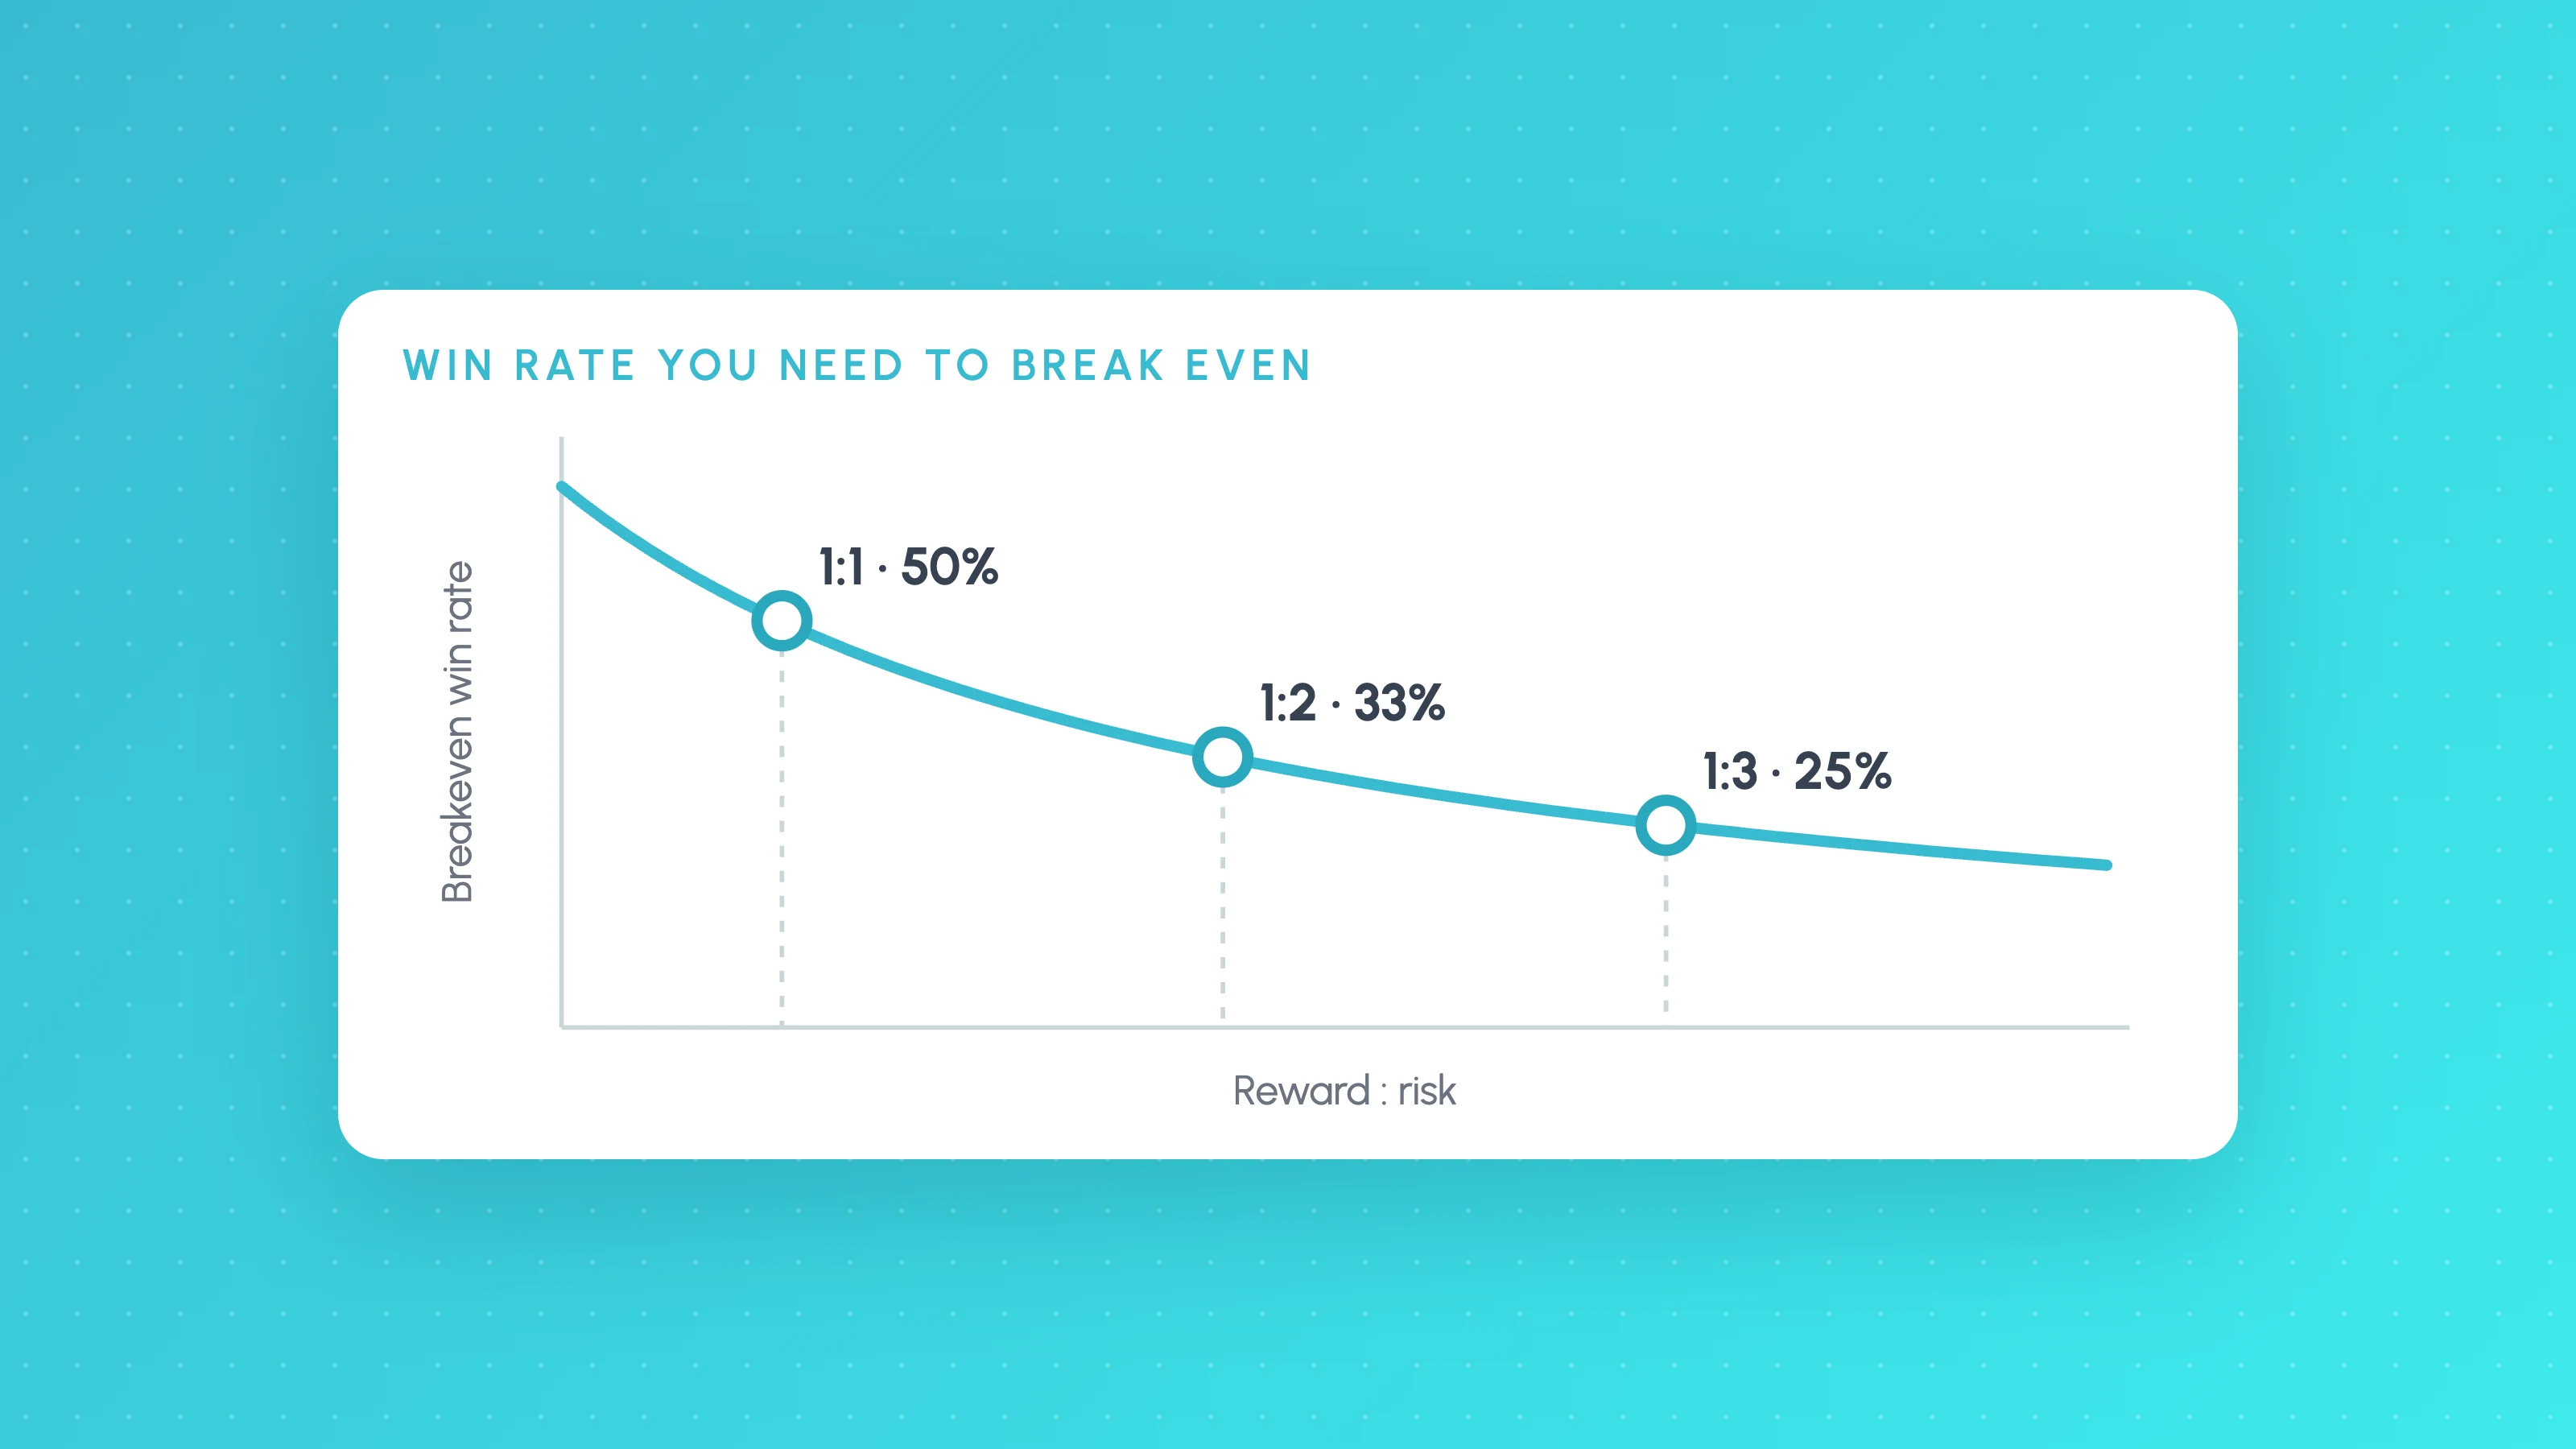
Win Rate vs Risk:Reward: The Breakeven Table for Algo Strategies
Win rate vs risk reward: breakeven win rate = 1 / (1 + R), so 1:2 needs 33.3% before costs. Table from 0.5R to 5R, with costs and spreadsheet formulas.
 Trading metrics
9 min read
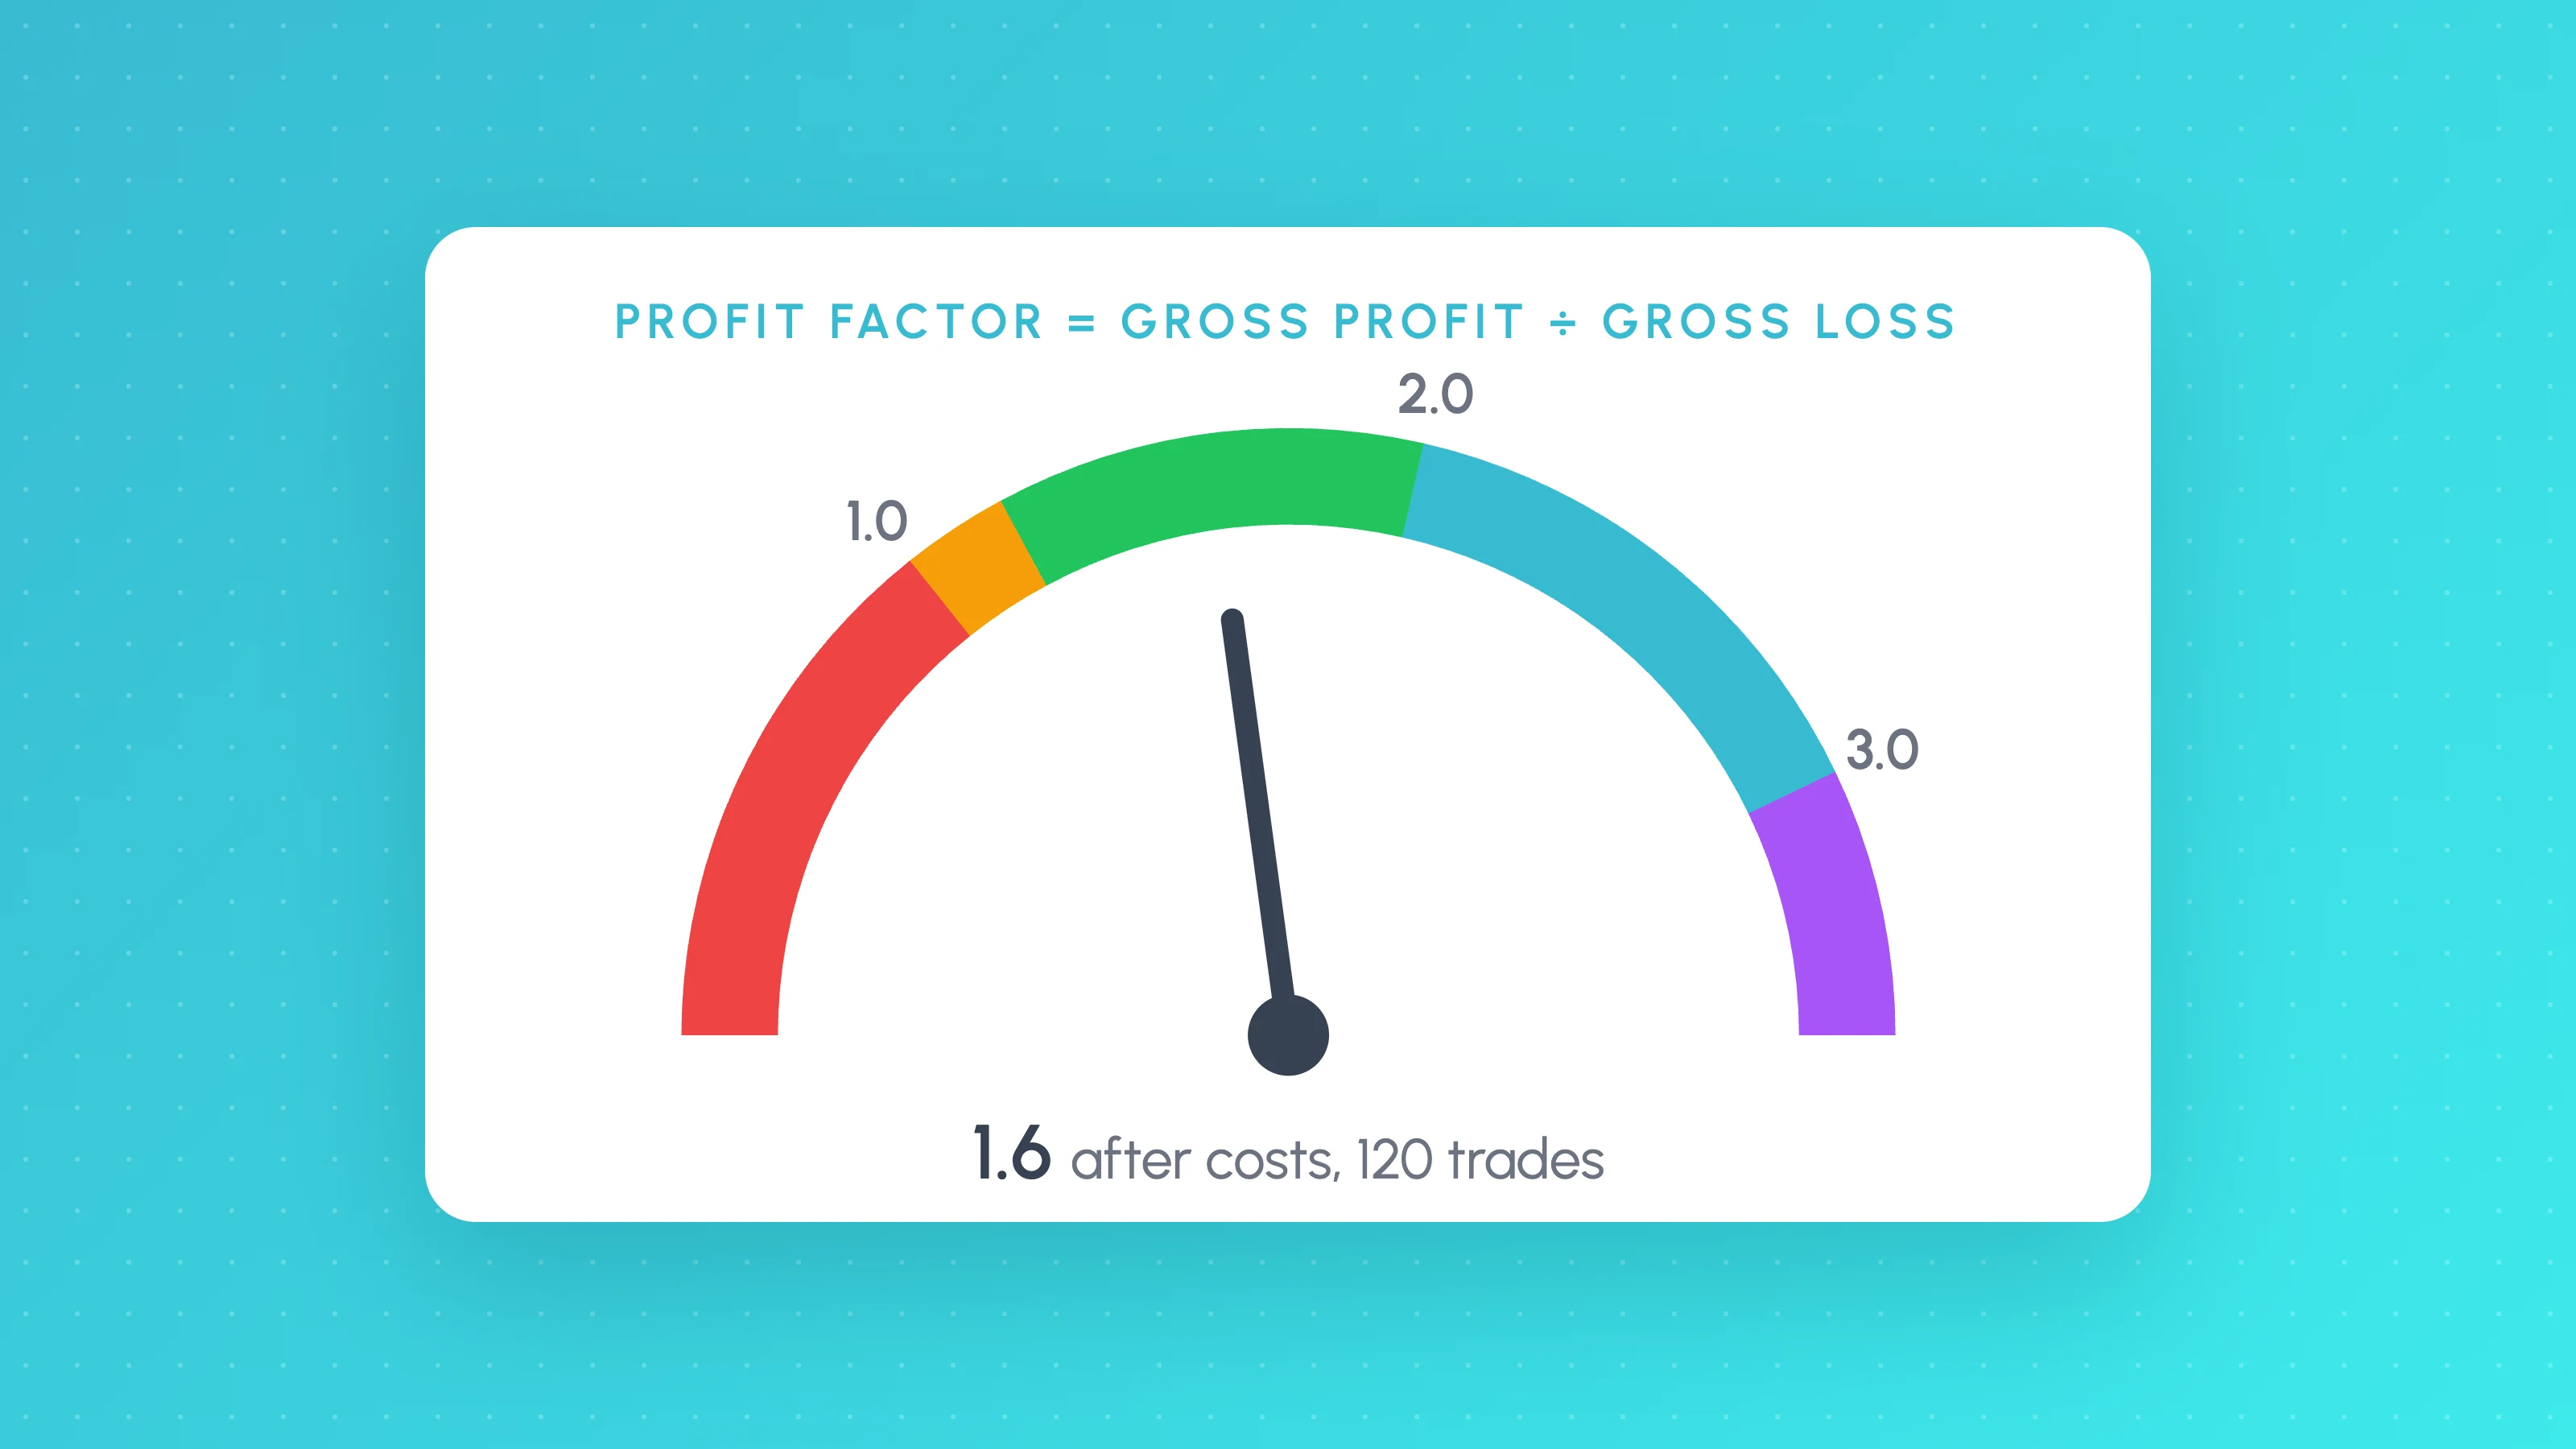
What Is a Good Profit Factor? Formula, Ranges and Red Flags
A good profit factor is usually 1.3 to 2.0 after costs on 100+ trades. See the formula, a worked example, a spreadsheet calculator and why above 3 is a warning.