
Monte Carlo Trading Simulator
A backtest gives you one equity curve, but the same trades in a different order would have given you another. This Monte Carlo trading simulator replays your trades 1,000 or more times to show the range of final balances, how deep drawdowns can get and how often an account hits your ruin threshold.
How the simulation works
Each run builds one possible equity curve:
- Start at your starting balance.
- Draw a trade. With a pasted list, pick one of your trades at random, with replacement, so the same trade can come up more than once (a bootstrap). With win rate and averages, the trade wins the average win with a probability equal to the win rate and otherwise loses the average loss.
- Add it to the balance, track the peak and the deepest fall from it, and repeat for the trades per run.
- If the balance reaches the ruin threshold, the run stops there and counts as ruined.
After all runs, the tool sorts the results:
5th / 50th / 95th percentile = final balance that 5% / 50% / 95% of runs ended below
Max drawdown per run         = largest peak-to-trough fall (in money and % of the peak)
Probability of ruin          = runs that hit the ruin threshold / all runs
The chart draws 50 of the runs, the median path and the band between the 5th and 95th percentiles at each point. Results move a little each time because the draws are random; more simulations make them steadier.
What it can't tell you
- It assumes trades are independent. Resampling breaks up streaks. If your losses cluster, for example in one volatility regime, real drawdowns can be deeper than the simulation suggests.
- It assumes the future looks like the sample.A regime shift (a change in volatility, spreads or market structure) isn't in your trade list, so it isn't in the simulation either.
- Garbage in, garbage out. An overfit backtest gives an overconfident simulation. Check whether your backtest is overfit first.
- Small samples mislead. Resampling 30 trades can only recombine those 30 results. Our guide to backtest sample size covers how many you need.
- Fixed position size. P/Ls are added as they are, with no compounding. For risk as a percentage of the balance, use the risk of ruin calculator.
To test a specific change to the strategy, such as a different stop or a session filter, replay it on the real candles instead with Tessera's Simulations.
 FAQs
Questions about the monte carlo trading simulator
Guides behind the maths
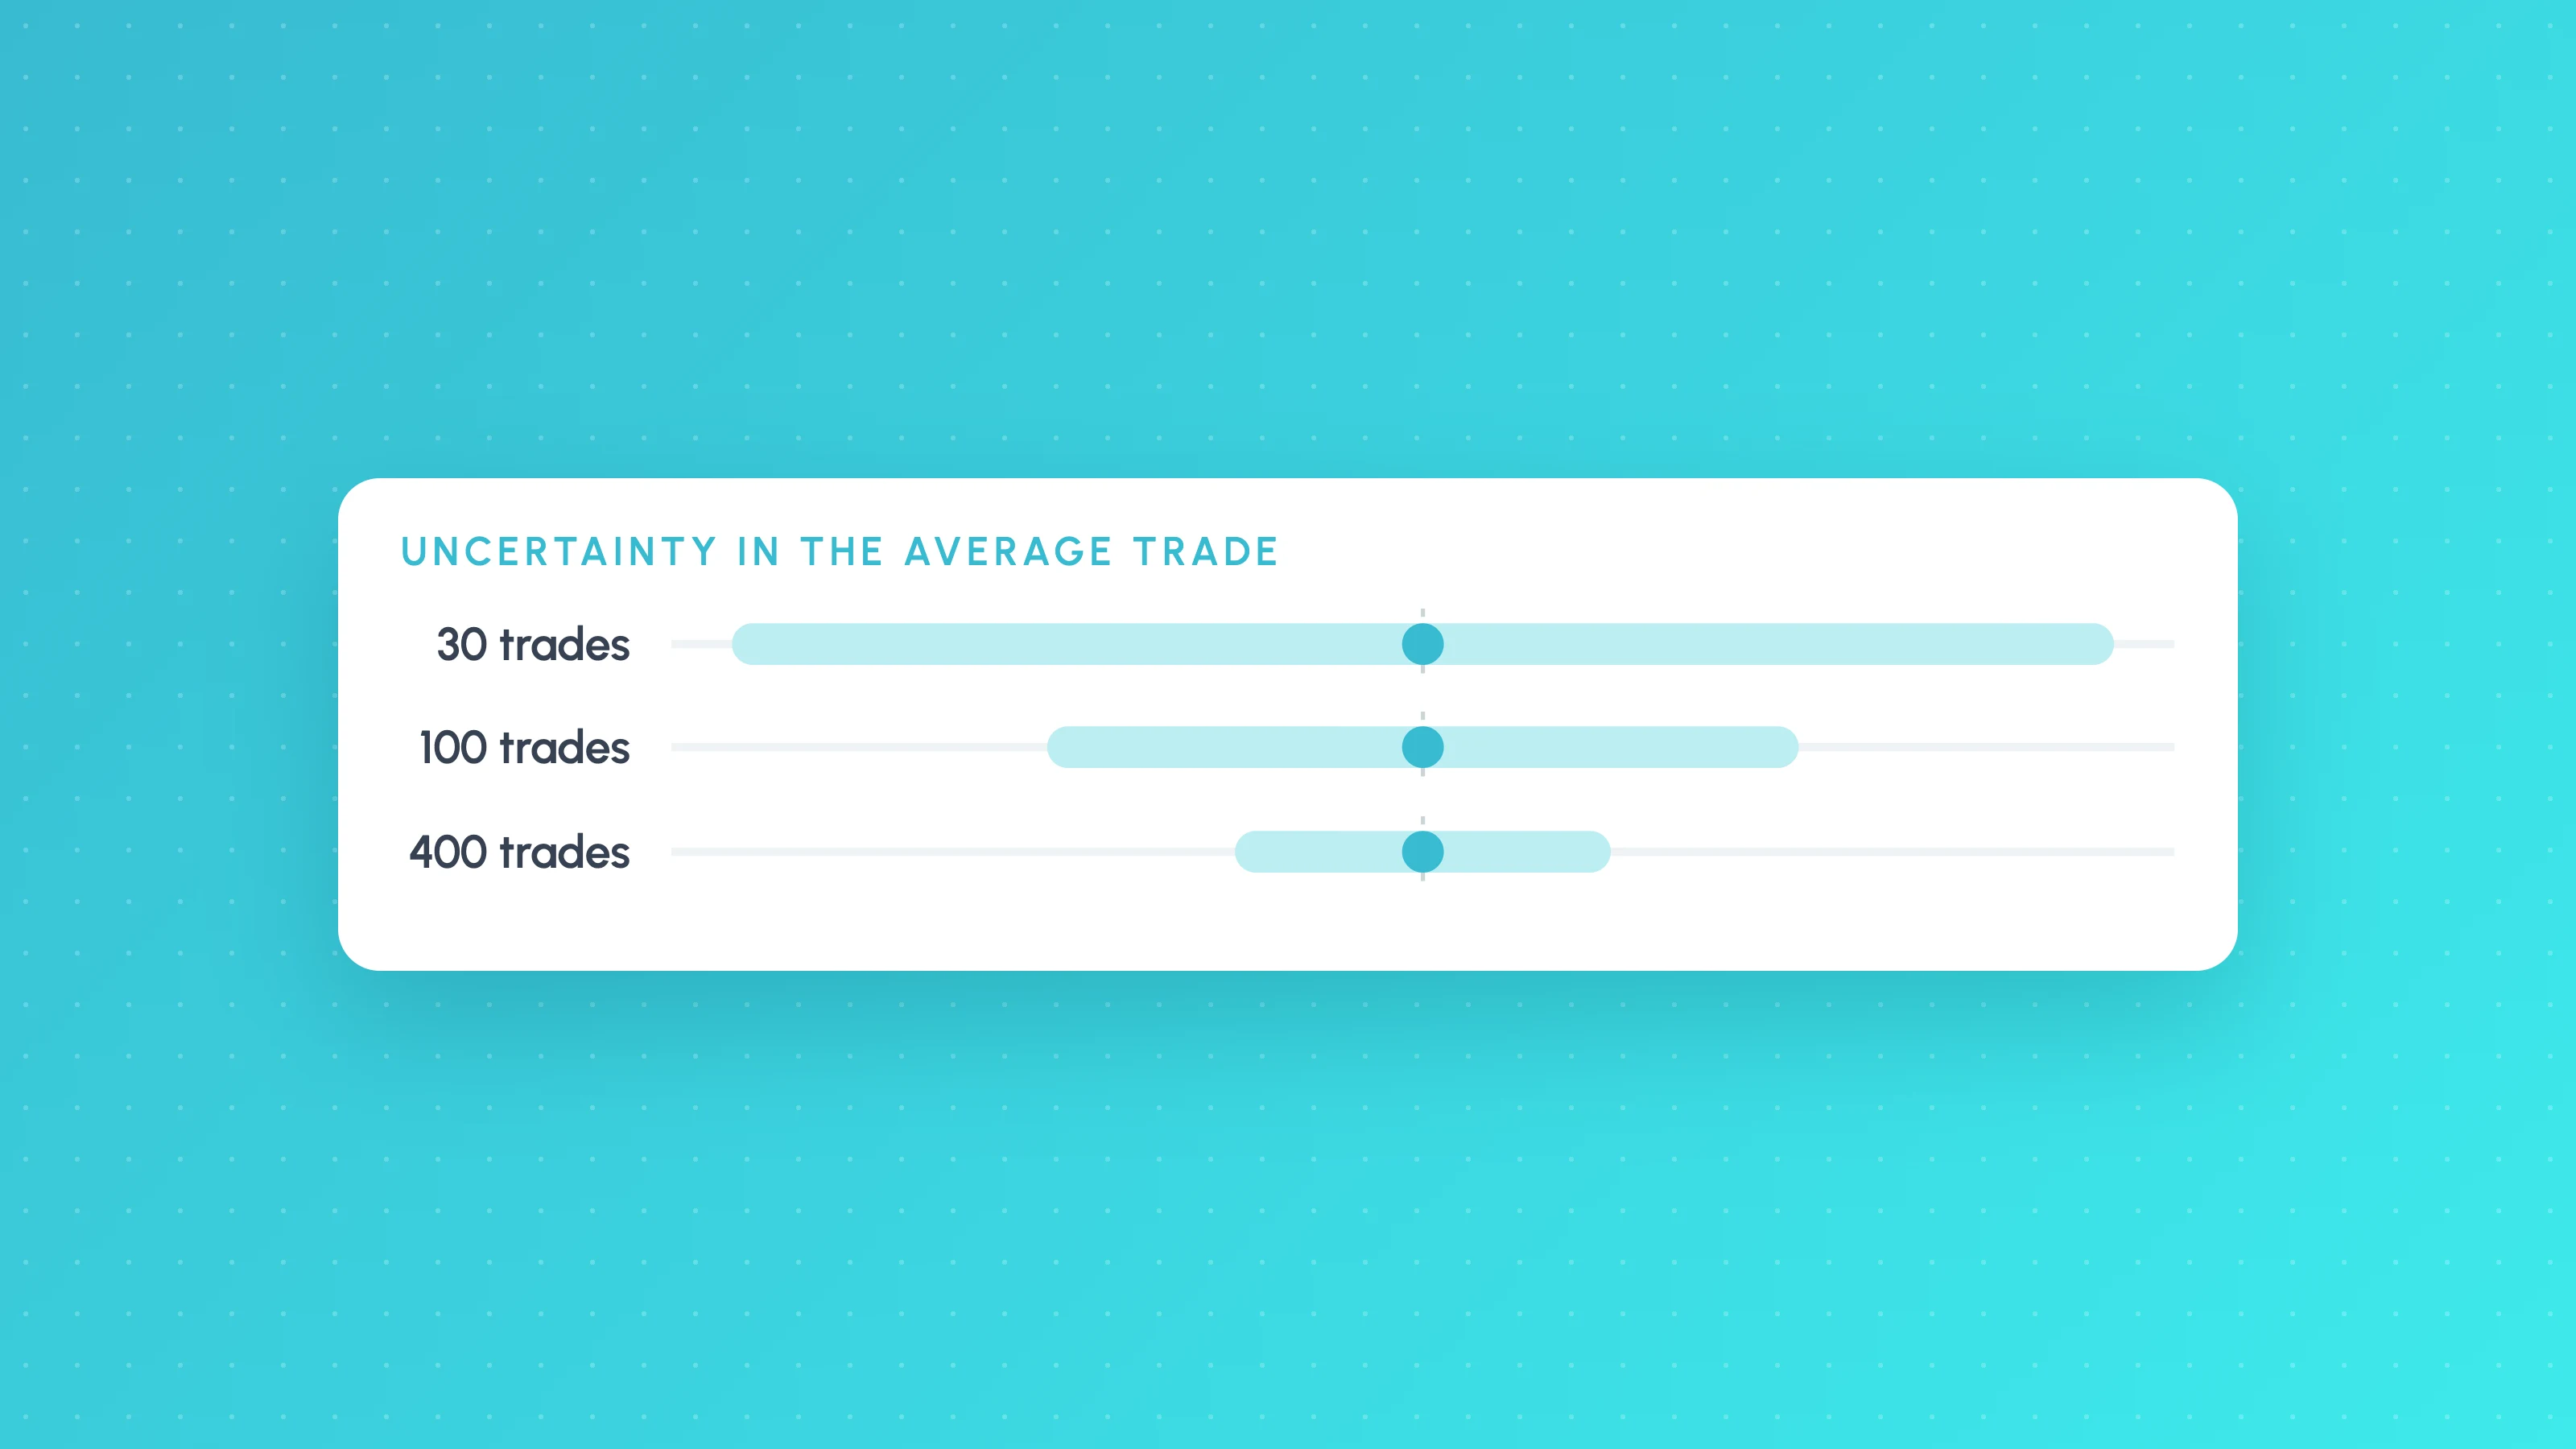 TradingView backtests
7 min read
How Many Trades Do You Need for a Valid Backtest?
How many trades a backtest needs: rules of thumb, the t-statistic formula with a worked example, a table by edge size, per-bucket minimums and multiple testing.
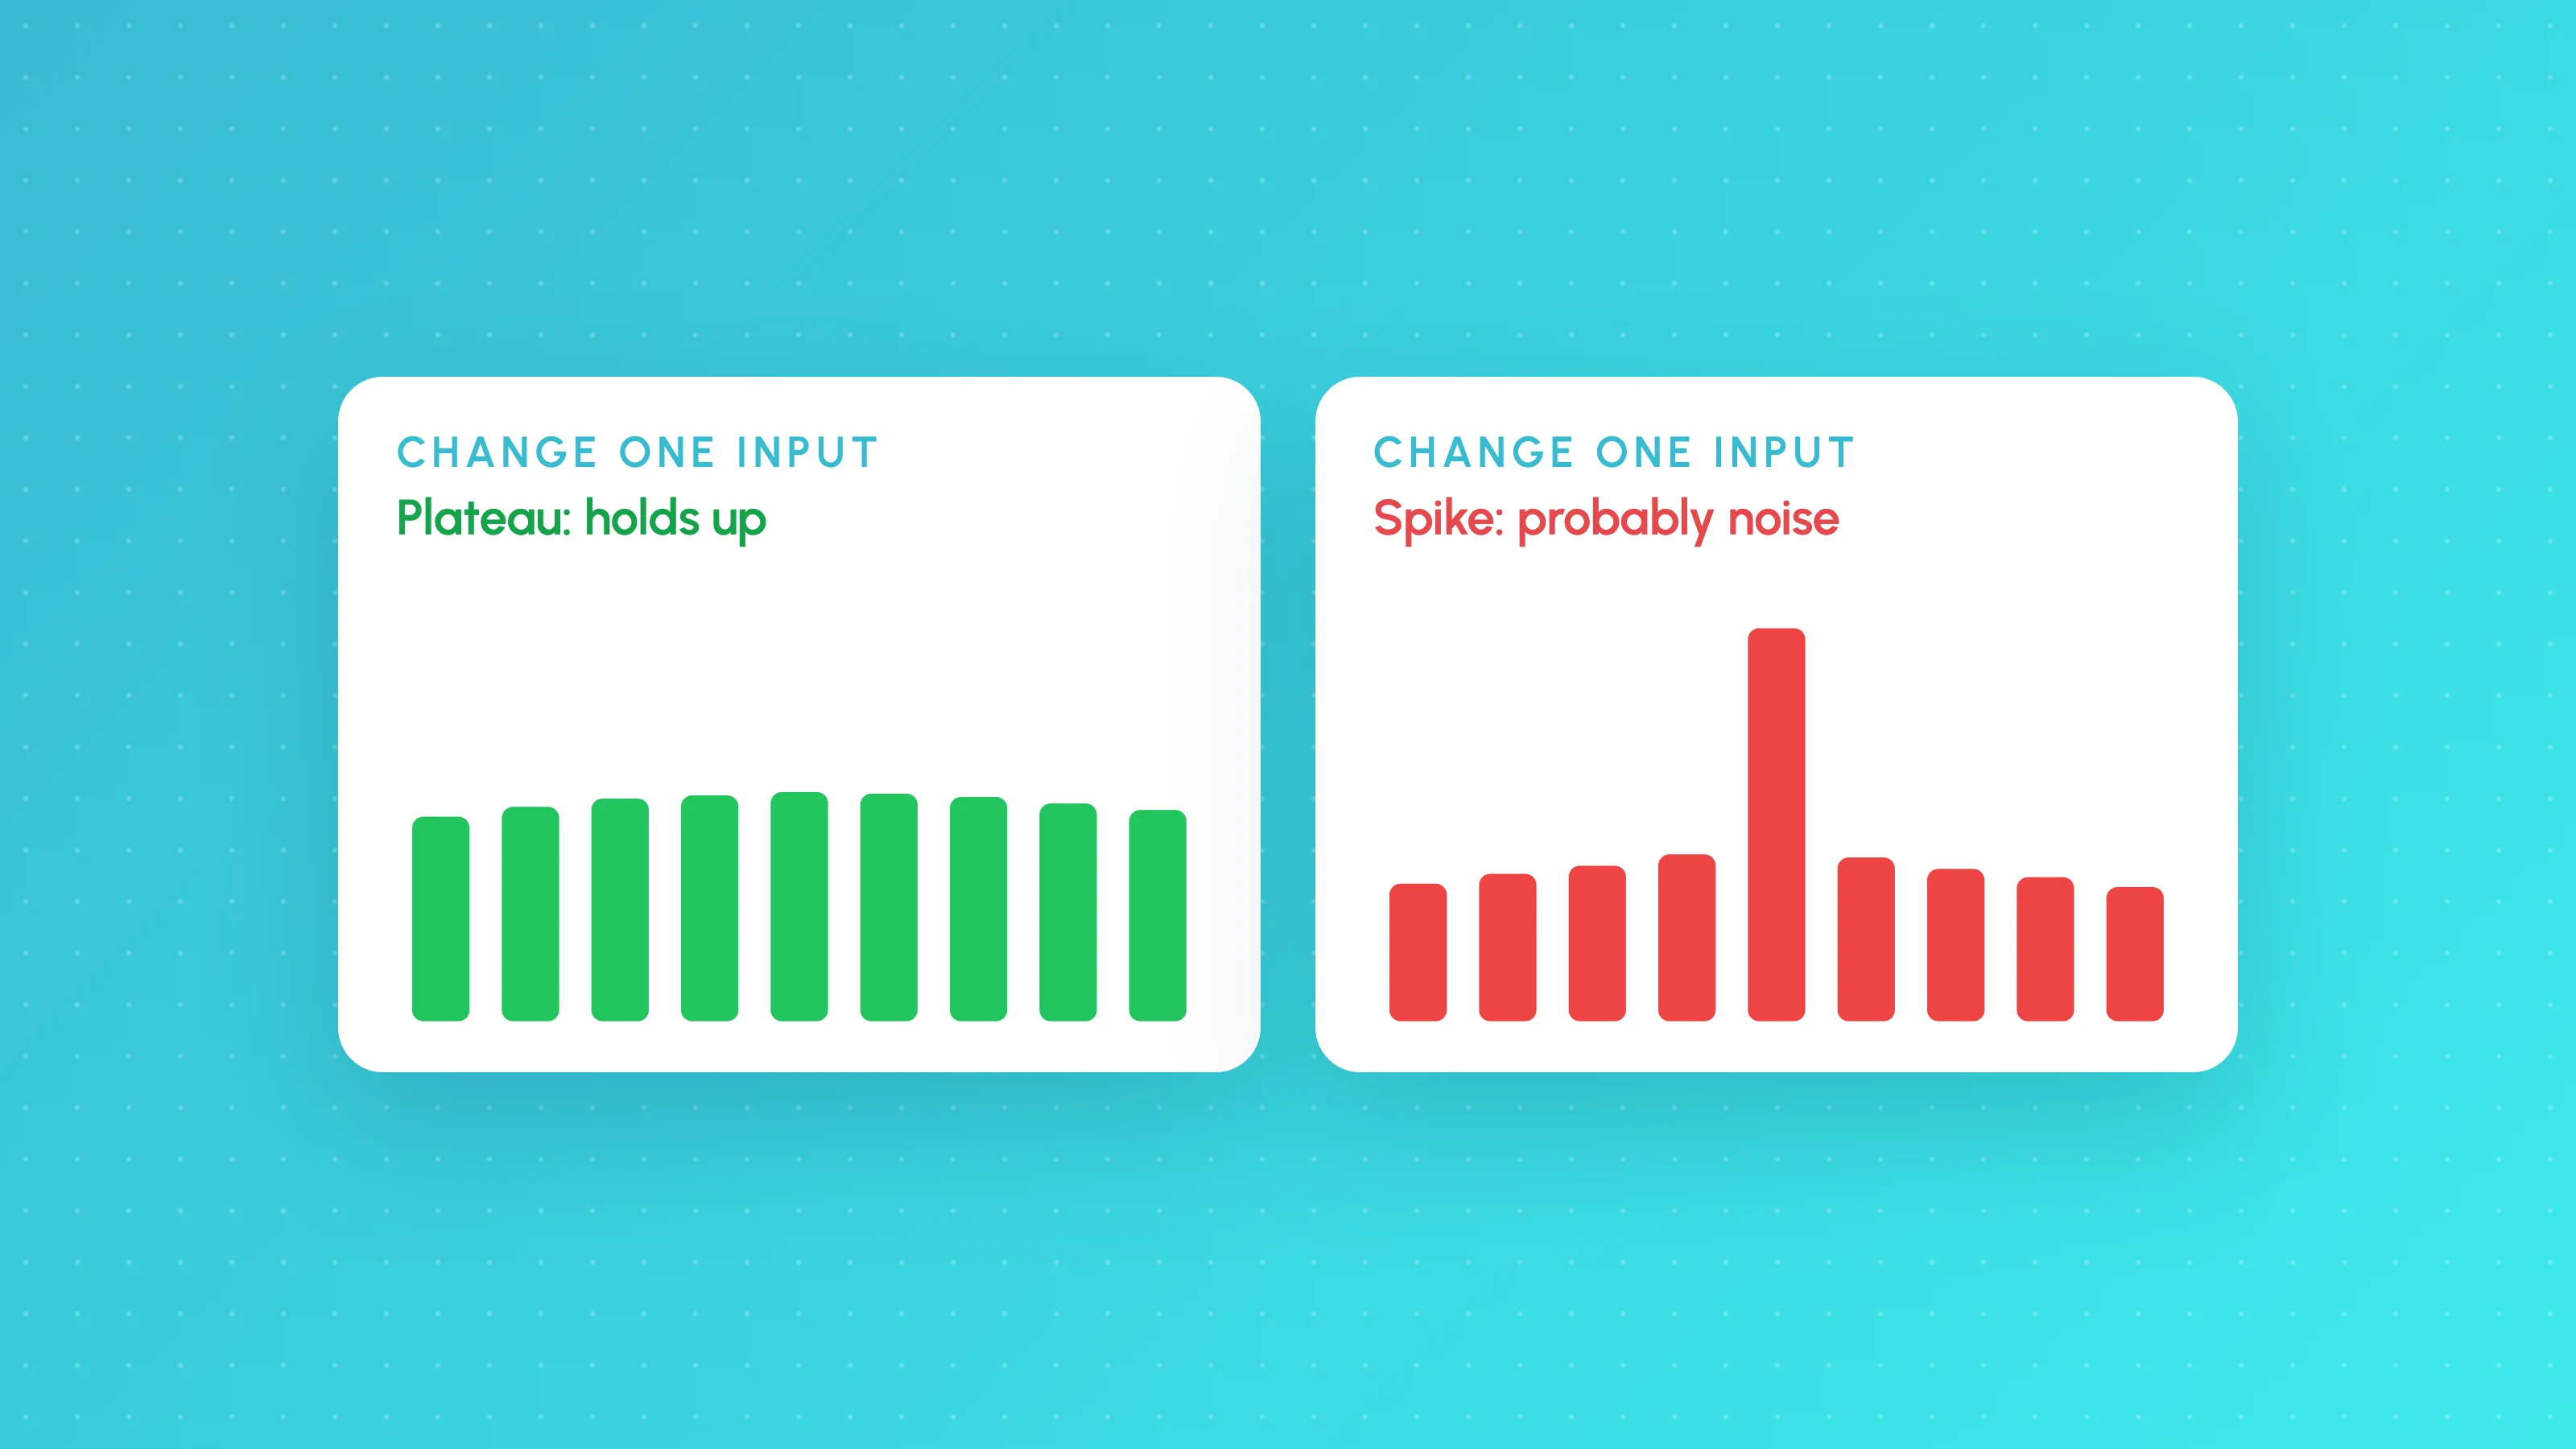 TradingView backtests
10 min read
Is My Backtest Overfit? A Practical Checklist for Traders
How to tell if a backtest is overfit: too-good metrics, thin samples, fragile inputs, useless filters, out-of-sample and walk-forward tests, plus a checklist.
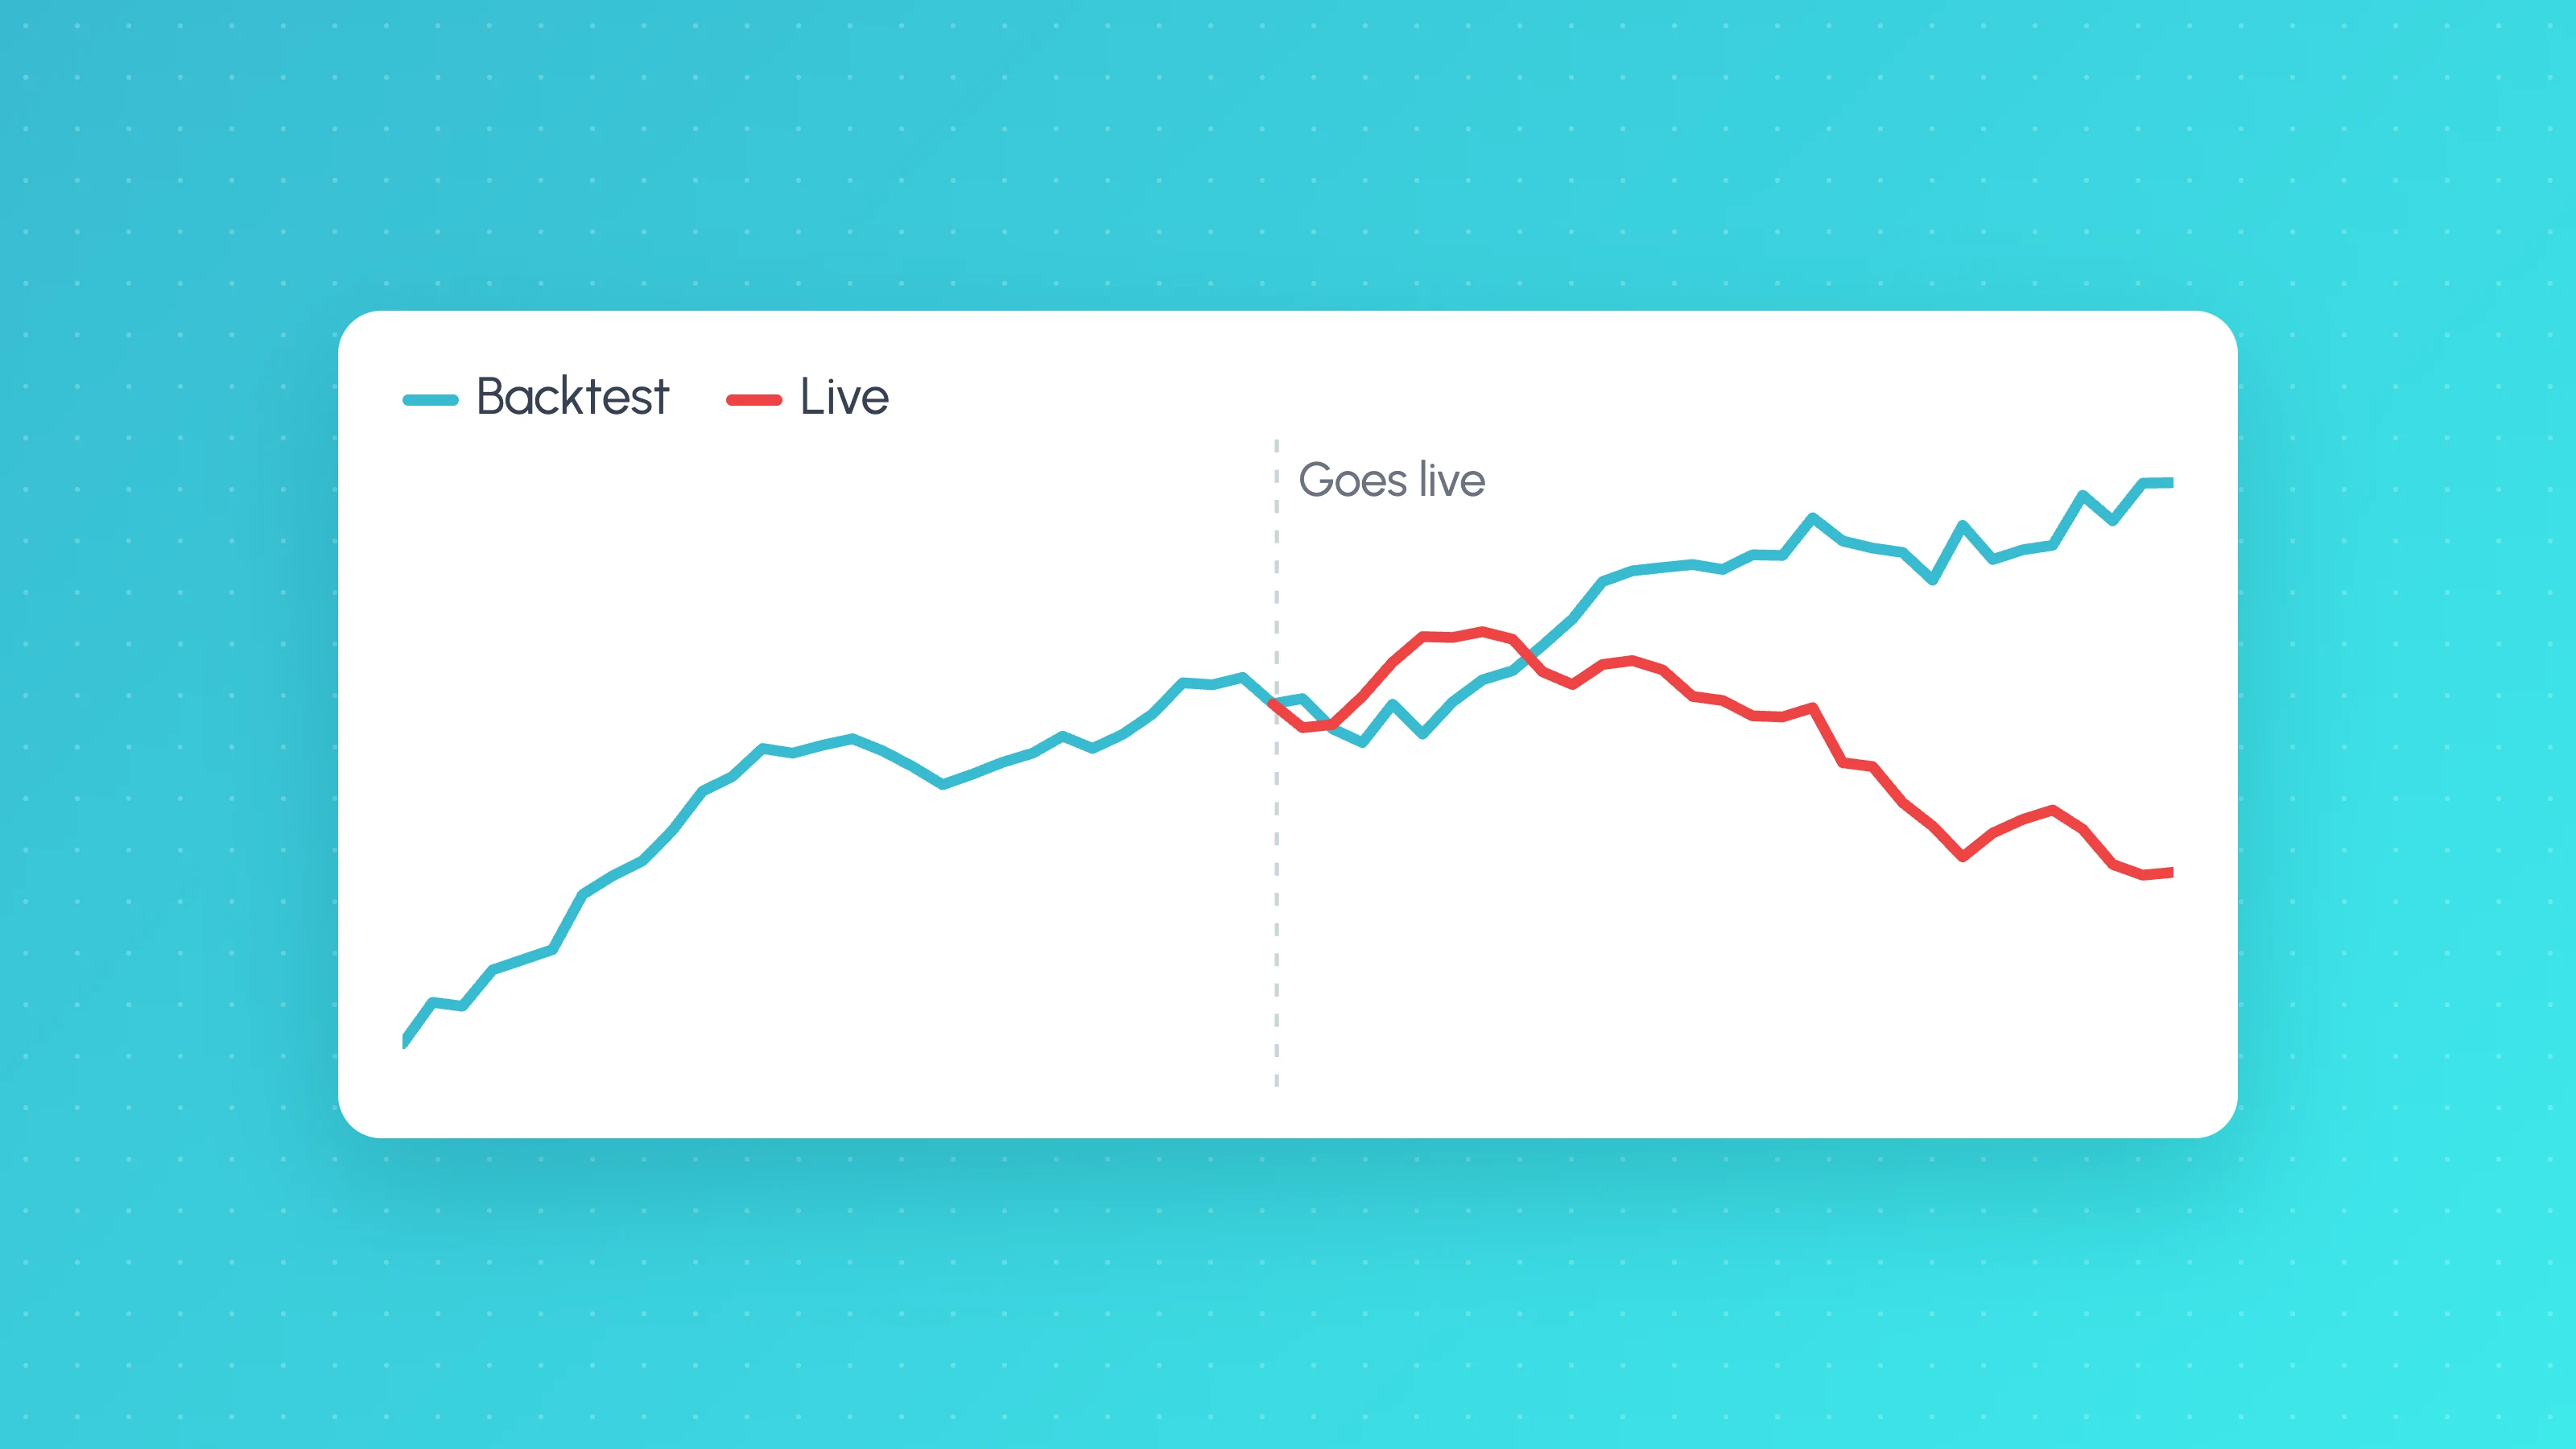 TradingView backtests
9 min read
Why Does My Strategy Work in Backtest but Not Live?
Why a TradingView strategy works in backtest but not live: costs, fill assumptions, repainting, gaps, data, alert delays and overfitting, with a check for each.