

Is My Backtest Overfit? A Practical Checklist for Traders
How to tell if a backtest is overfit: too-good metrics, thin samples, fragile inputs, useless filters, out-of-sample and walk-forward tests, plus a checklist.
By Tessera Trades · Updated · 10 min read
A backtest is probably overfit if its results look better than the strategy has any reason to be, rest on few trades, collapse when an input changes slightly, depend on filters that can't be explained, or fall apart on data the strategy wasn't tuned on. The more versions you tried before picking this one, the more likely all of that is.
Overfitting (also called curve fitting) means the strategy has learned the noise in a particular stretch of history rather than a pattern that repeats. It's the default outcome of tuning a strategy until the equity curve looks good, which is how most strategies are built. This checklist turns the academic work on backtest overfitting into tests you can run with TradingView and a trade export, and ends with a scored table.
1. The metrics are too good
Real edges in liquid markets are usually small. When a backtest shows a very high profit factor, a near-straight equity curve or a win rate far above anything similar strategies achieve, the first explanation to rule out is that it was fitted, or that it uses future data.
There are no universal cut-offs, but treat these as prompts to dig further:
- A profit factor well above 2 over hundreds of intraday trades after costs. See what is a good profit factor for typical ranges.
- A maximum drawdown that is tiny compared with total profit.
- A win rate above 80% with a stop much wider than the target, which can hide a few large losses waiting to happen.
Check: before anything else, rule out lookahead and repainting (see why a strategy works in backtest but not live). Then run the rest of this list.
2. There are too few trades for the number of decisions
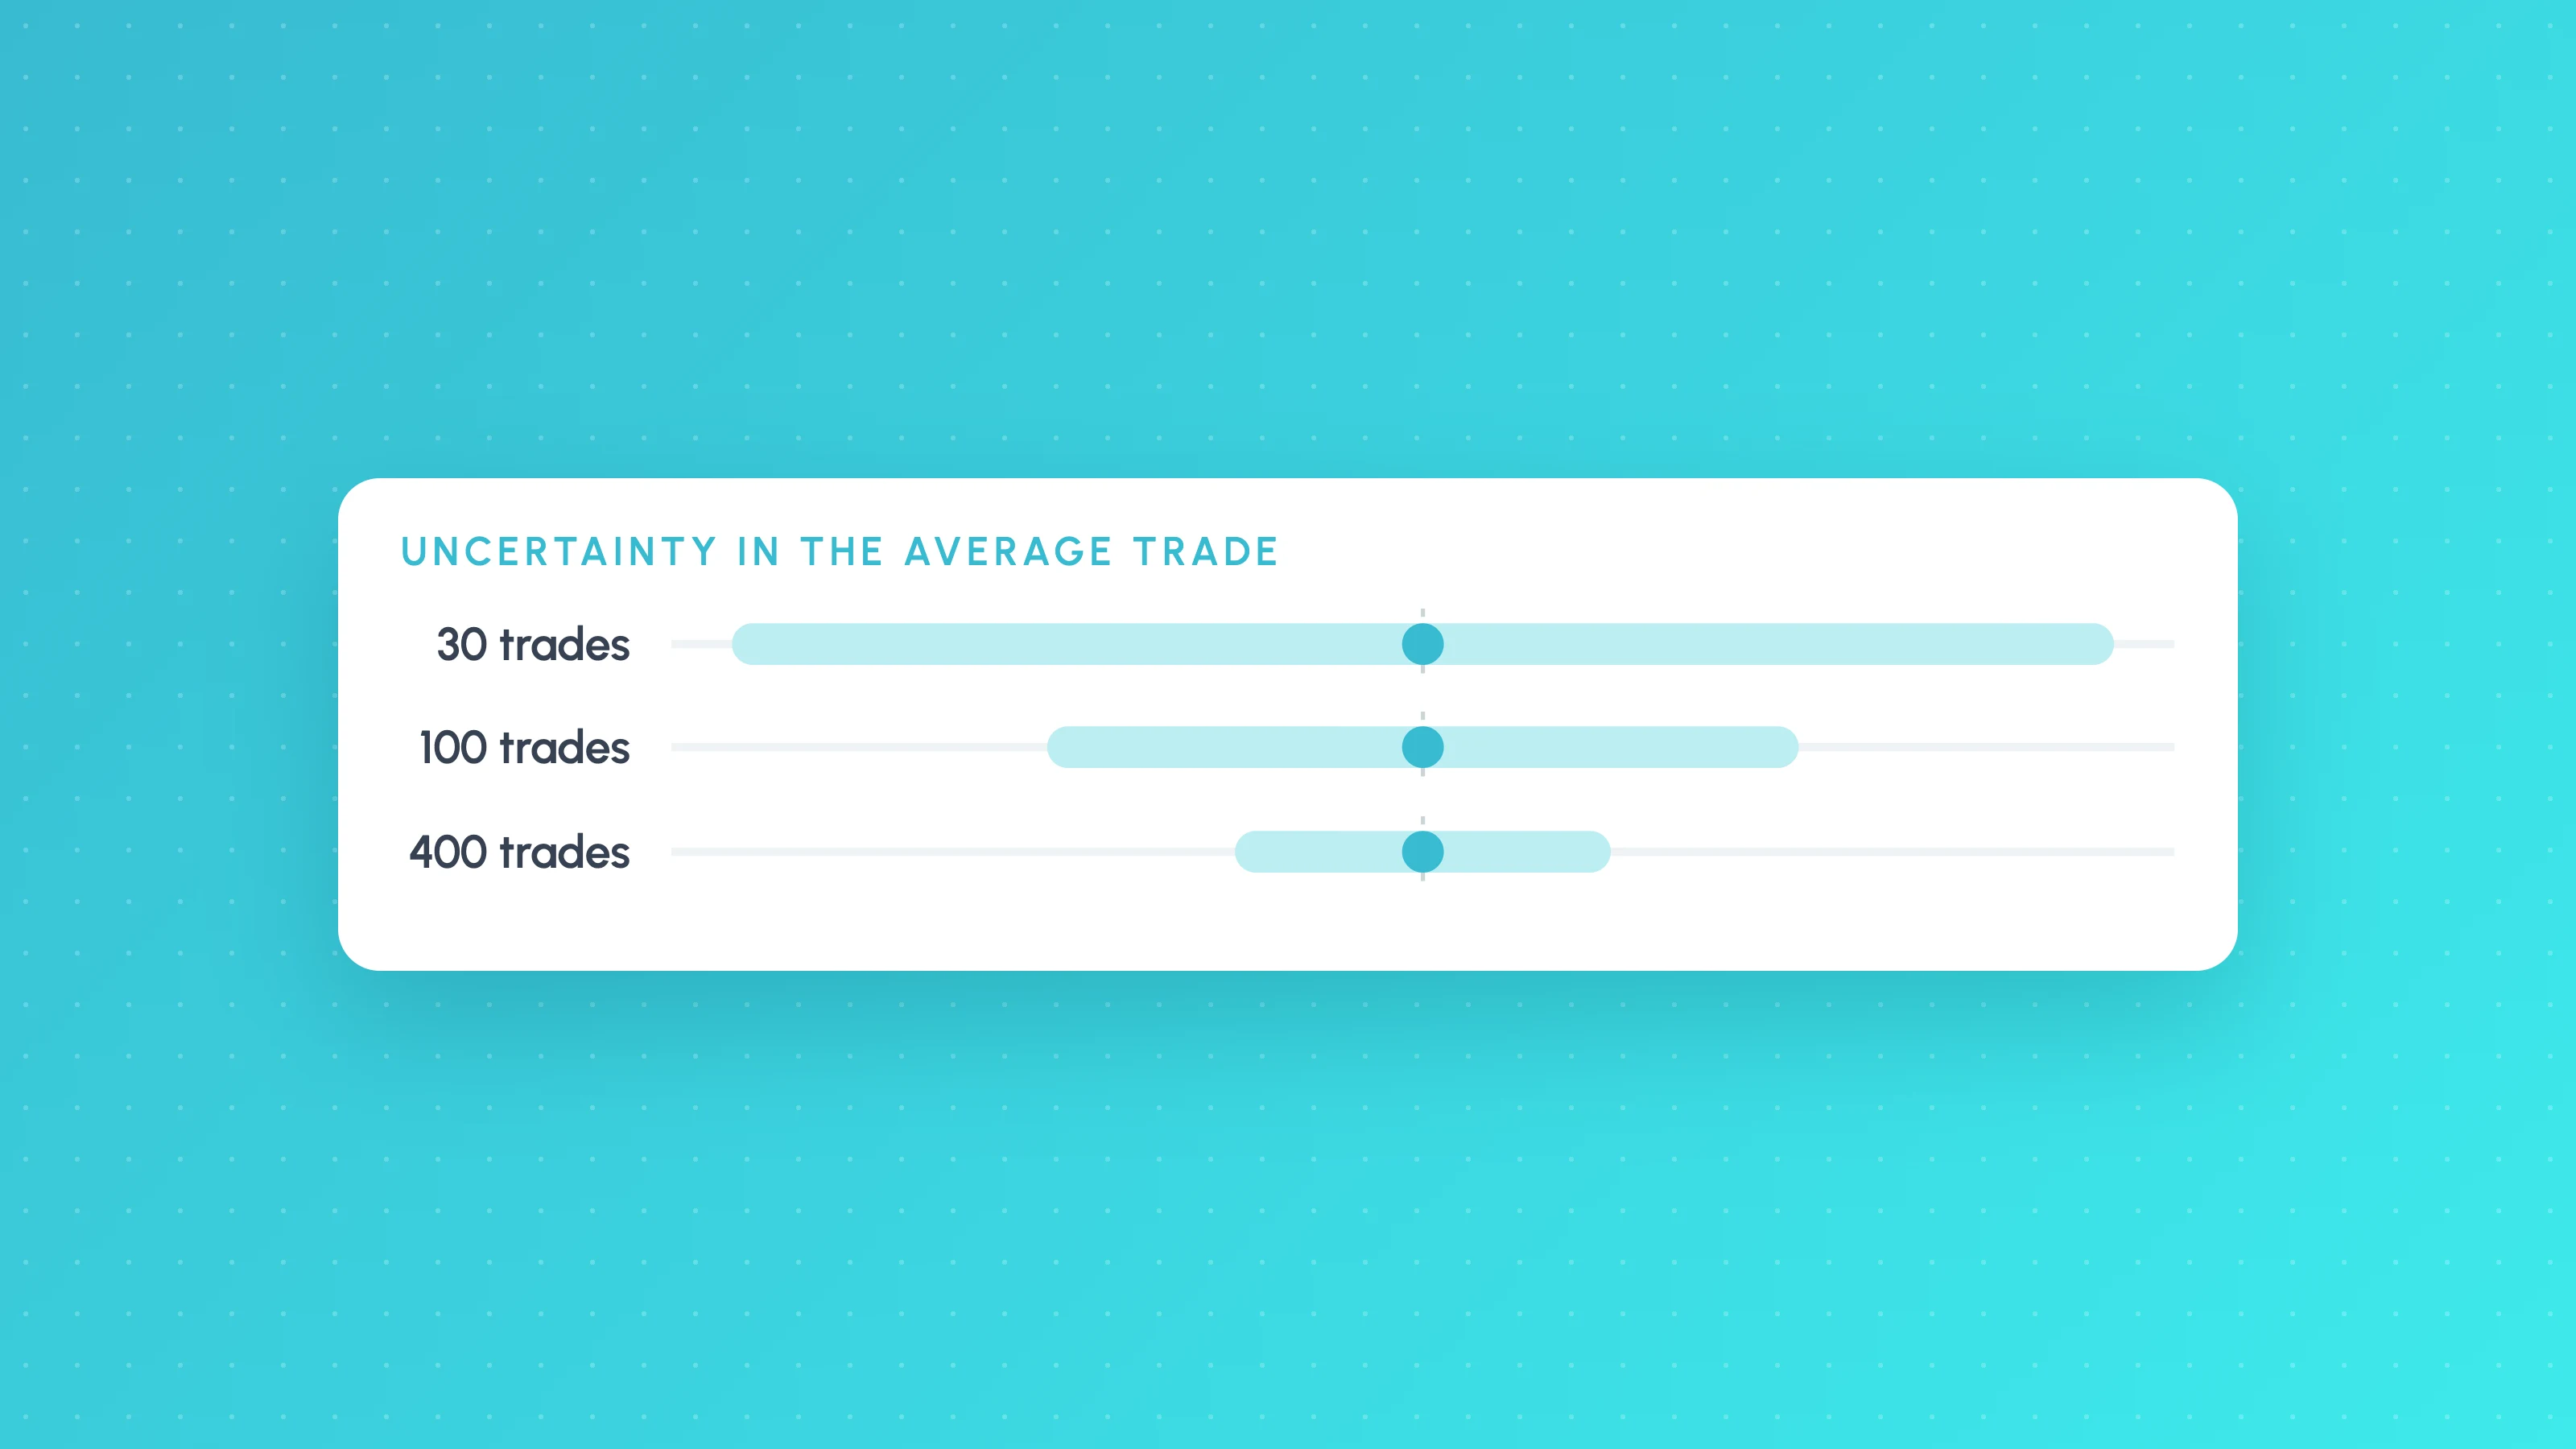
Every input, threshold and filter is a decision fitted to the data. With 60 trades and eight inputs, there's a lot of room to fit noise and very little evidence to check it against.
Check: count the trades and count the inputs and filters you tuned. As a rough guide, look for at least 100 trades overall and 30 or more in any condition you filter on, and more as the number of tuned decisions grows. How many trades a backtest needs shows how to calculate it properly from the size of the edge.
3. Small parameter changes break it
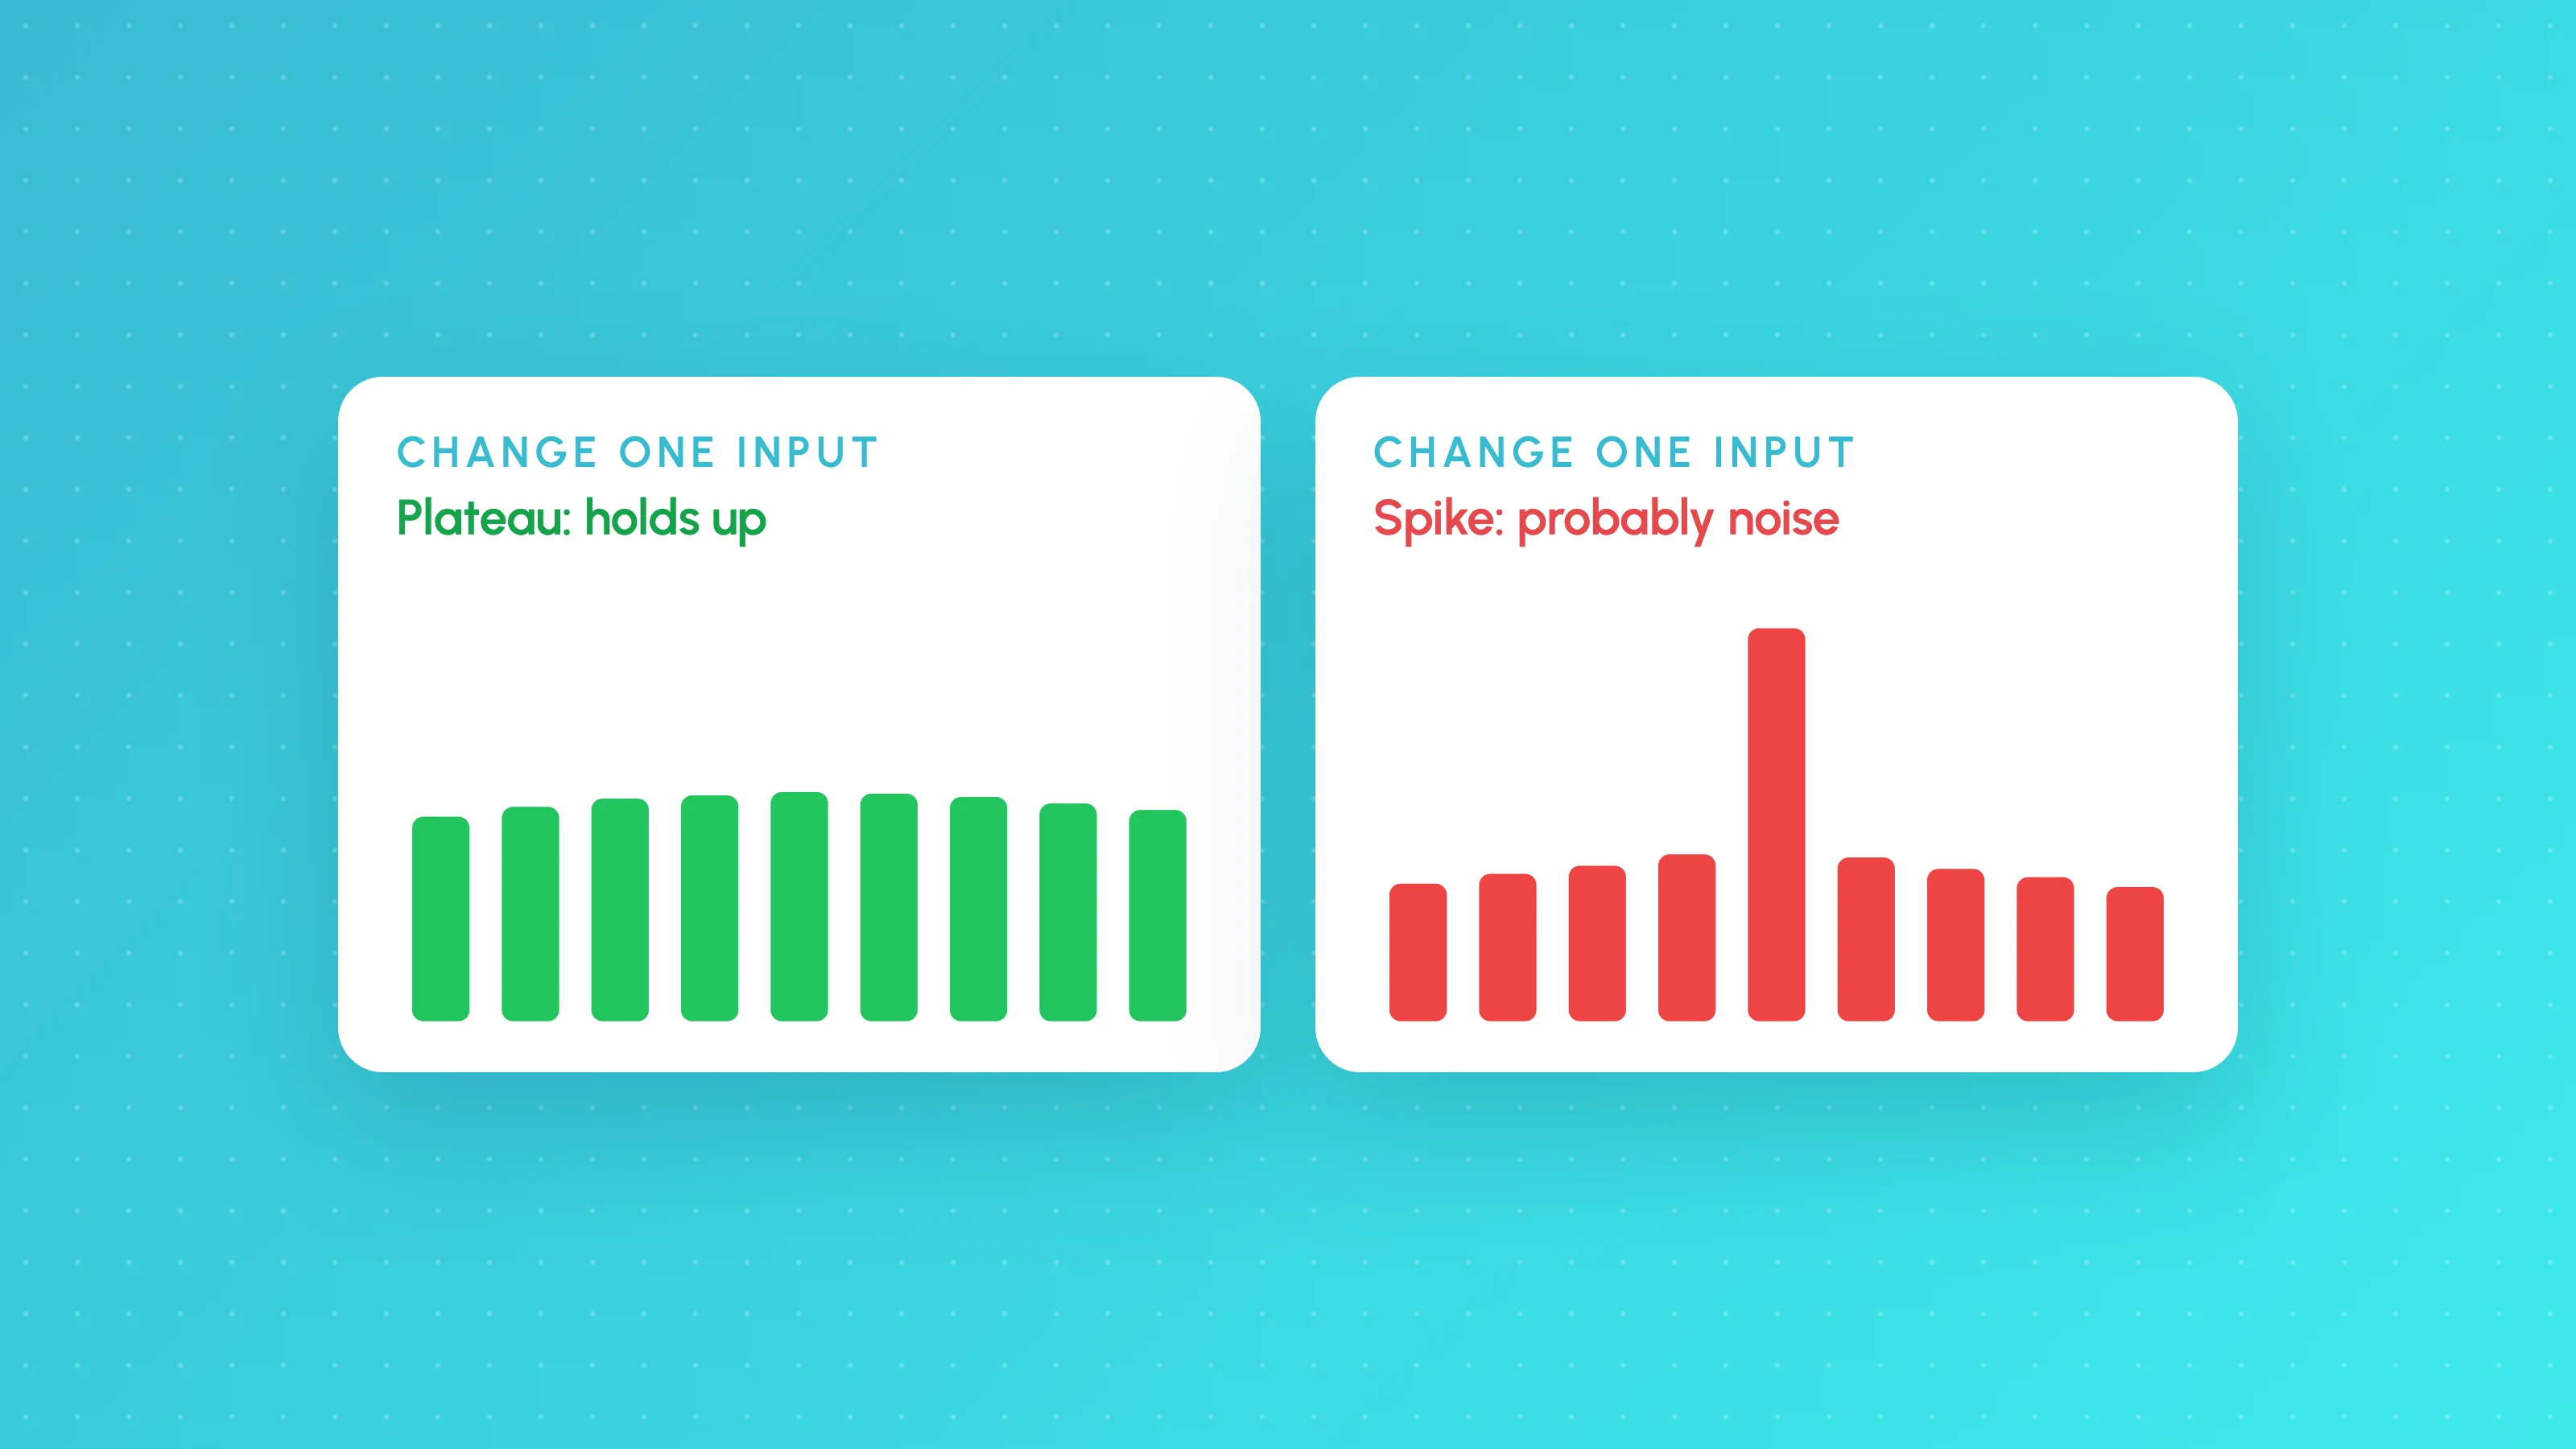
A real edge degrades gradually as you move an input away from its best value. An overfit one has a sharp peak: one exact combination works and its neighbours don't.
Check: change each important input by 10 to 20 percent in both directions, one at a time, and record the result. An illustrative example for an EMA length:
| EMA length | Robust strategy (profit factor) | Fragile strategy (profit factor) |
|---|---|---|
| 16 | 1.28 | 0.94 |
| 18 | 1.33 | 1.02 |
| 20 (chosen) | 1.35 | 1.71 |
| 22 | 1.31 | 1.05 |
| 24 | 1.26 | 0.97 |
The robust strategy sits on a plateau, so the exact value matters little. The fragile one has a spike at 20, which is almost certainly noise. If you have two inputs, run a small grid and look for a broad area of good results rather than a single best cell.
Changing the inputs tests the settings; changing the data tests the trades. A strategy whose result depends on a few exact prices is fitted to one data feed. Tessera's Strategy Lab has a "nudge the prices" test for this: it re-runs the strategy on 10 (up to 100) copies of the price history with small amounts of noise, calibrated to real differences between feeds, gives a verdict of stable or sensitive and lists the fragile trades. How to stress test a trading strategy covers it alongside cost and fill stress.
4. Filters that don't earn their place
Filters are where most overfitting hides. Each one removes some losing trades from the past, which always improves the backtest, whether or not it will help in future.
Check: remove each filter one at a time (an ablation test) and compare. An illustrative example:
| Version | Trades | Profit factor |
|---|---|---|
| All filters | 210 | 1.45 |
| Without session filter | 290 | 1.38 |
| Without RSI filter | 260 | 1.41 |
| Without day-of-week filter | 250 | 1.12 |
The session and RSI filters change little, so they may not be doing anything useful and are candidates to remove. The day-of-week filter carries most of the improvement. That isn't proof it's wrong, but it needs a reason (why would Tuesdays be bad for this strategy?) and must hold up out of sample. A filter that removes 40 trades to lift profit factor from 1.12 to 1.45 is exactly the kind of change that fits history.
You can run this test without editing the script by removing or keeping trades that match a condition and replaying them. Tessera's simulator does that on trades you've already taken and compares the versions side by side.
5. Out-of-sample test
Hold back a period the strategy never saw during development, and run the final version on it once.
How to do it in TradingView:
- Choose a cut-off date before you start tuning, for example the end of 2023.
- Develop and tune only on data before the cut-off.
- When the strategy is final, run it once on the period after the cut-off and record the result, whatever it is.
A date window input makes this easy:
//@version=6
strategy("Out-of-sample window", overlay = true)

startDate = input.time(timestamp("2018-01-01"), "Test from")
endDate   = input.time(timestamp("2023-12-31"), "Test to")
inWindow  = time >= startDate and time <= endDate

fastMa = ta.ema(close, 20)
slowMa = ta.ema(close, 50)
if inWindow and ta.crossover(fastMa, slowMa)
    strategy.entry("Long", strategy.long)
if ta.crossunder(fastMa, slowMa)
    strategy.close("Long")
Expect the out-of-sample result to be somewhat worse. If it's dramatically worse, or negative, the in-sample result was mostly fit. The test only works once: if you look at the out-of-sample result, change the strategy and look again, that period has become in-sample too. TradingView's own strategies documentation recommends this in-sample and out-of-sample split, while noting it can't guarantee future performance. Out-of-sample testing for traders goes further: where to put the hold-out, how big it should be and how to read a weaker result.
6. Walk-forward test
Walk-forward analysis repeats the out-of-sample test several times through history, which gives you more than one out-of-sample period to judge.
- Pick a training window (say two years) and a test window (say six months).
- Tune the strategy on the first training window.
- Run the tuned settings, unchanged, on the following test window and record the result.
- Move both windows forward by the test length and repeat until you reach the present.
- Join the test-window results together. That combined record is your walk-forward result.
In TradingView this is manual: change the date inputs, re-tune, record. It's tedious, which is a reason to keep the number of tuned inputs small. What you're looking for is whether the tuned settings stay roughly stable from window to window, and whether most test windows are profitable. Settings that jump around every window suggest there's no stable pattern to find.
7. You tried a lot of versions
This is the part most traders miss. Every variation you test is another draw. Try enough of them and one will look good by chance, even if none has an edge.
Bailey, Borwein, López de Prado and Zhu formalised this in The Probability of Backtest Overfitting, which proposes a way to estimate the probability that the best backtest out of many is overfit, and argues that a simple hold-out test isn't reliable on its own. In a companion paper, "Pseudo-Mathematics and Financial Charlatanism" (Notices of the AMS, 2014), the same authors give a striking example. Test strategies that have no real edge on five years of data, and the best of about 45 independent configurations is expected to show an in-sample annualised Sharpe ratio of 1, while its expected out-of-sample Sharpe ratio is zero. On two years of data, the best of only about seven does the same.
The practical lessons:
- Keep a count of every version you test, including the ones you threw away and the ones an AI assistant generated for you.
- Demand more from the winner the more versions you tried. A result that would be convincing as a first attempt is weak as the best of 50.
- Prefer fewer, simpler ideas to many variations of one.
Empirical evidence points the same way. A study of 888 algorithms on the Quantopian platform found that the more backtesting had gone into a strategy, the larger the gap between its backtest and out-of-sample performance (Wiecki et al.).
If you build in Strategy Lab, its backtest validation includes a multiple-testing warning, a reminder that the best of many versions needs a stricter bar than a first attempt.
8. The edge isn't stable across conditions
A real edge usually shows up, at different strengths, across years, sessions and similar markets. An overfit one often comes from one stretch of time or one condition.
Check: split the trades by year, session, weekday and volatility level (see how to analyse a TradingView backtest). Warning signs:
- Most of the profit comes from one year or one month.
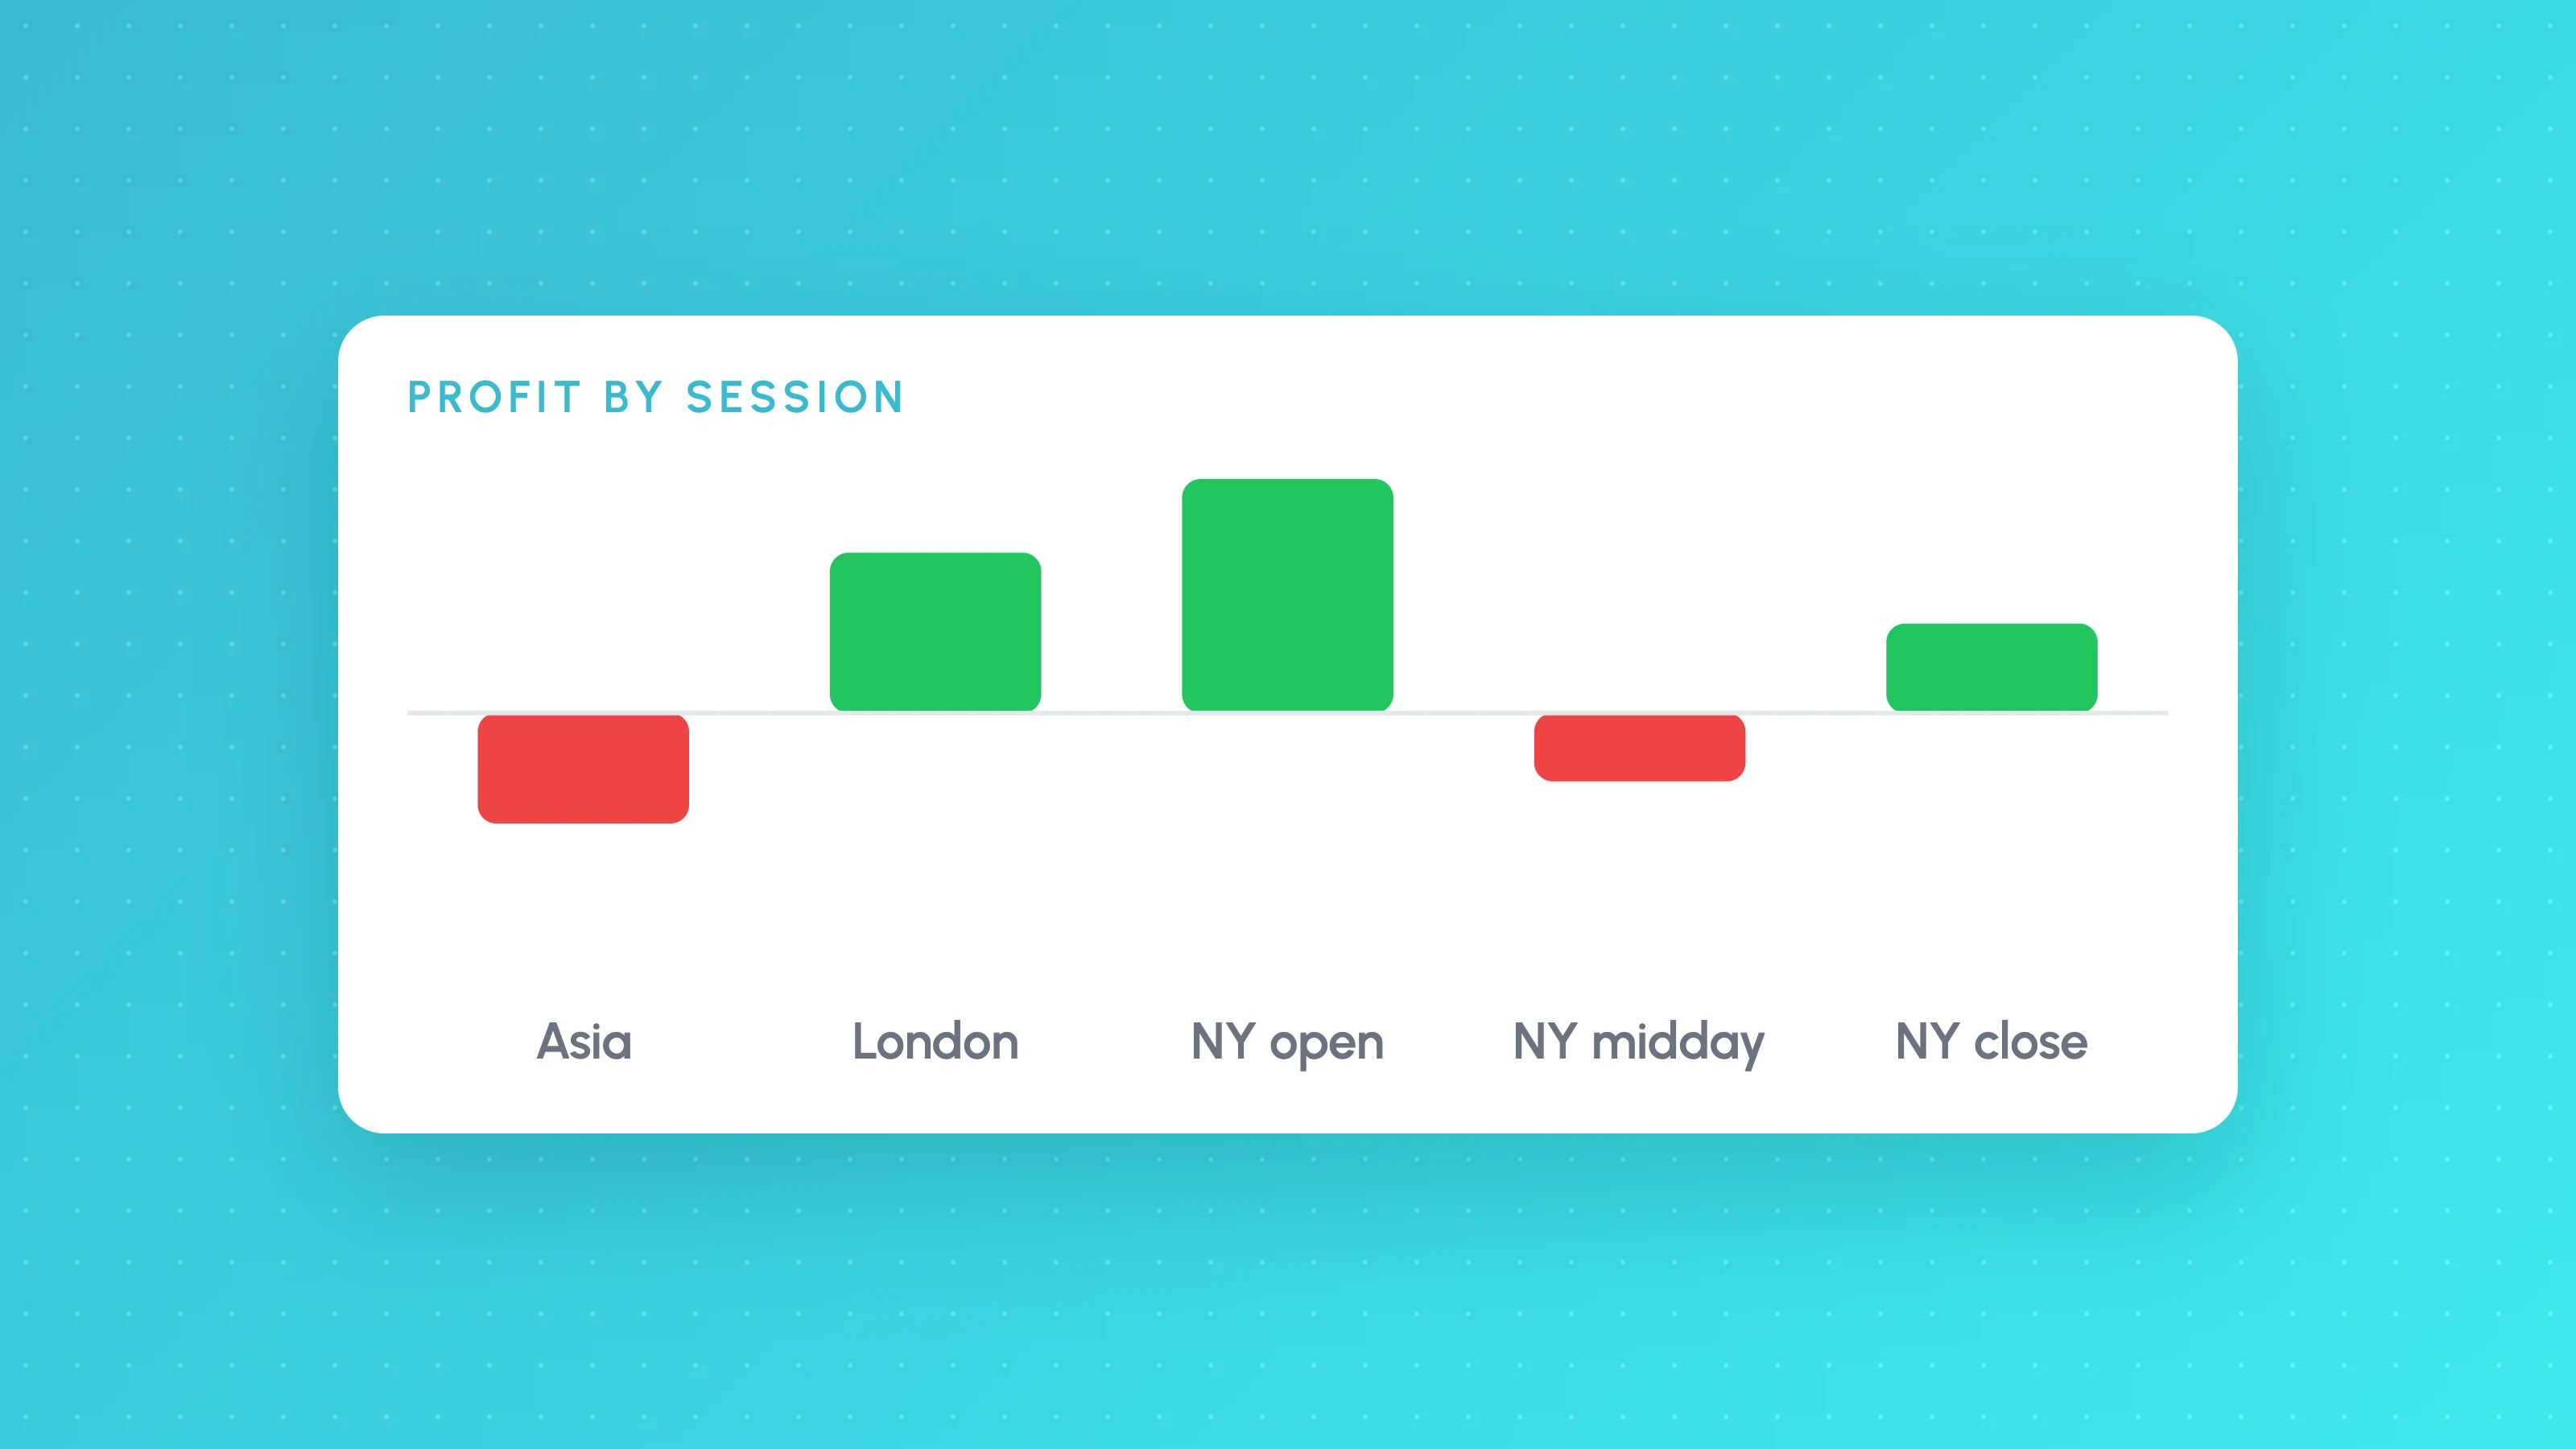
- One session makes all the money and the rest lose.
- The strategy works on the symbol you developed it on, but not on closely related ones (for example ES but not NQ, or EURUSD but not GBPUSD).
Each of these can have a genuine explanation. If you can't find one, assume the condition is noise.
How to avoid overfitting a trading strategy
- Decide on the idea and the out-of-sample cut-off before you look at results.
- Use as few inputs and filters as the idea needs, and round values (20, not 23).
- Add filters only when there's a reason and the ablation test shows they matter.
- Set realistic costs from the start, so you don't tune toward a cost-free illusion.
- Log every version you test.
- Paper trade or trade small before trusting it with full size.
The scored checklist
Score each check 0 (fails), 1 (partly) or 2 (passes). This is a heuristic, not a statistical test, but it makes the weak points obvious.
| Check | 0 points | 1 point | 2 points |
|---|---|---|---|
| Metrics plausible | Far better than similar strategies | Strong but explainable | In a normal range after costs |
| No lookahead or repainting | Not checked | Checked by reading code | Checked live and by reloading |
| Trade count | Under 50 | 50 to 100 | Over 100, 30+ per condition used |
| Inputs and filters | Many, unexplained | Some unexplained | Few, each with a reason |
| Parameter sensitivity | Sharp peak | Mixed | Broad plateau |
| Filter ablation | One filter carries the result | Unclear | Each filter adds a little |
| Out of sample | Not done or negative | Much worse but positive | Similar range |
| Walk-forward | Not done | Most windows profitable | Most windows profitable, stable settings |
| Versions tried | Unknown or many | Counted, many | Counted, few |
| Stable across conditions | One year or session carries it | Some concentration | Spread across years and sessions |
16 to 20: low risk of overfitting, worth forward testing. 10 to 15: fix the weak checks before risking money. Below 10: treat the backtest as unproven.
Next step
Run your own export through the free Entry Analysis report to see whether the results are spread across sessions, weekdays and volatility levels or concentrated in one of them. No card needed.
Frequently asked questions
- What is overfitting in trading?
- Overfitting, or curve fitting, is when a strategy's rules and settings are tuned to the noise in historical data rather than to a pattern that repeats. The backtest looks good because it was shaped to fit that particular history, and it usually performs much worse on new data.
- How do I know if my trading strategy is curve fitted?
- Check whether small input changes break it, whether removing each filter barely matters or one filter carries everything, whether it holds up on a period you didn't tune on, and how many versions you tried before choosing it. A sharp peak in parameter results and a weak out-of-sample period are the clearest signs.
- Is walk-forward testing better than a single out-of-sample test?
- It gives you several out-of-sample periods instead of one, so a single lucky or unlucky stretch matters less, and it shows whether the best settings are stable over time. It takes more work in TradingView because each window has to be tuned and recorded by hand.
- How many parameters is too many?
- There's no fixed number. What matters is how many trades you have per tuned decision and whether each parameter sits on a plateau. A strategy with three inputs and 500 trades is far less exposed than one with eight inputs and 80 trades.
- Can an overfit strategy still make money?
- Sometimes, if there's a real but smaller edge underneath the fitted part. Removing filters that fail the ablation test and widening parameters to the middle of a plateau often reveals that smaller edge. Size it based on the out-of-sample result, not the in-sample one.
Keep reading
 TradingView backtests
How Many Trades Do You Need for a Valid Backtest?
How many trades a backtest needs: rules of thumb, the t-statistic formula with a worked example, a table by edge size, per-bucket minimums and multiple testing.
 TradingView backtests
Why Does My Strategy Work in Backtest but Not Live?
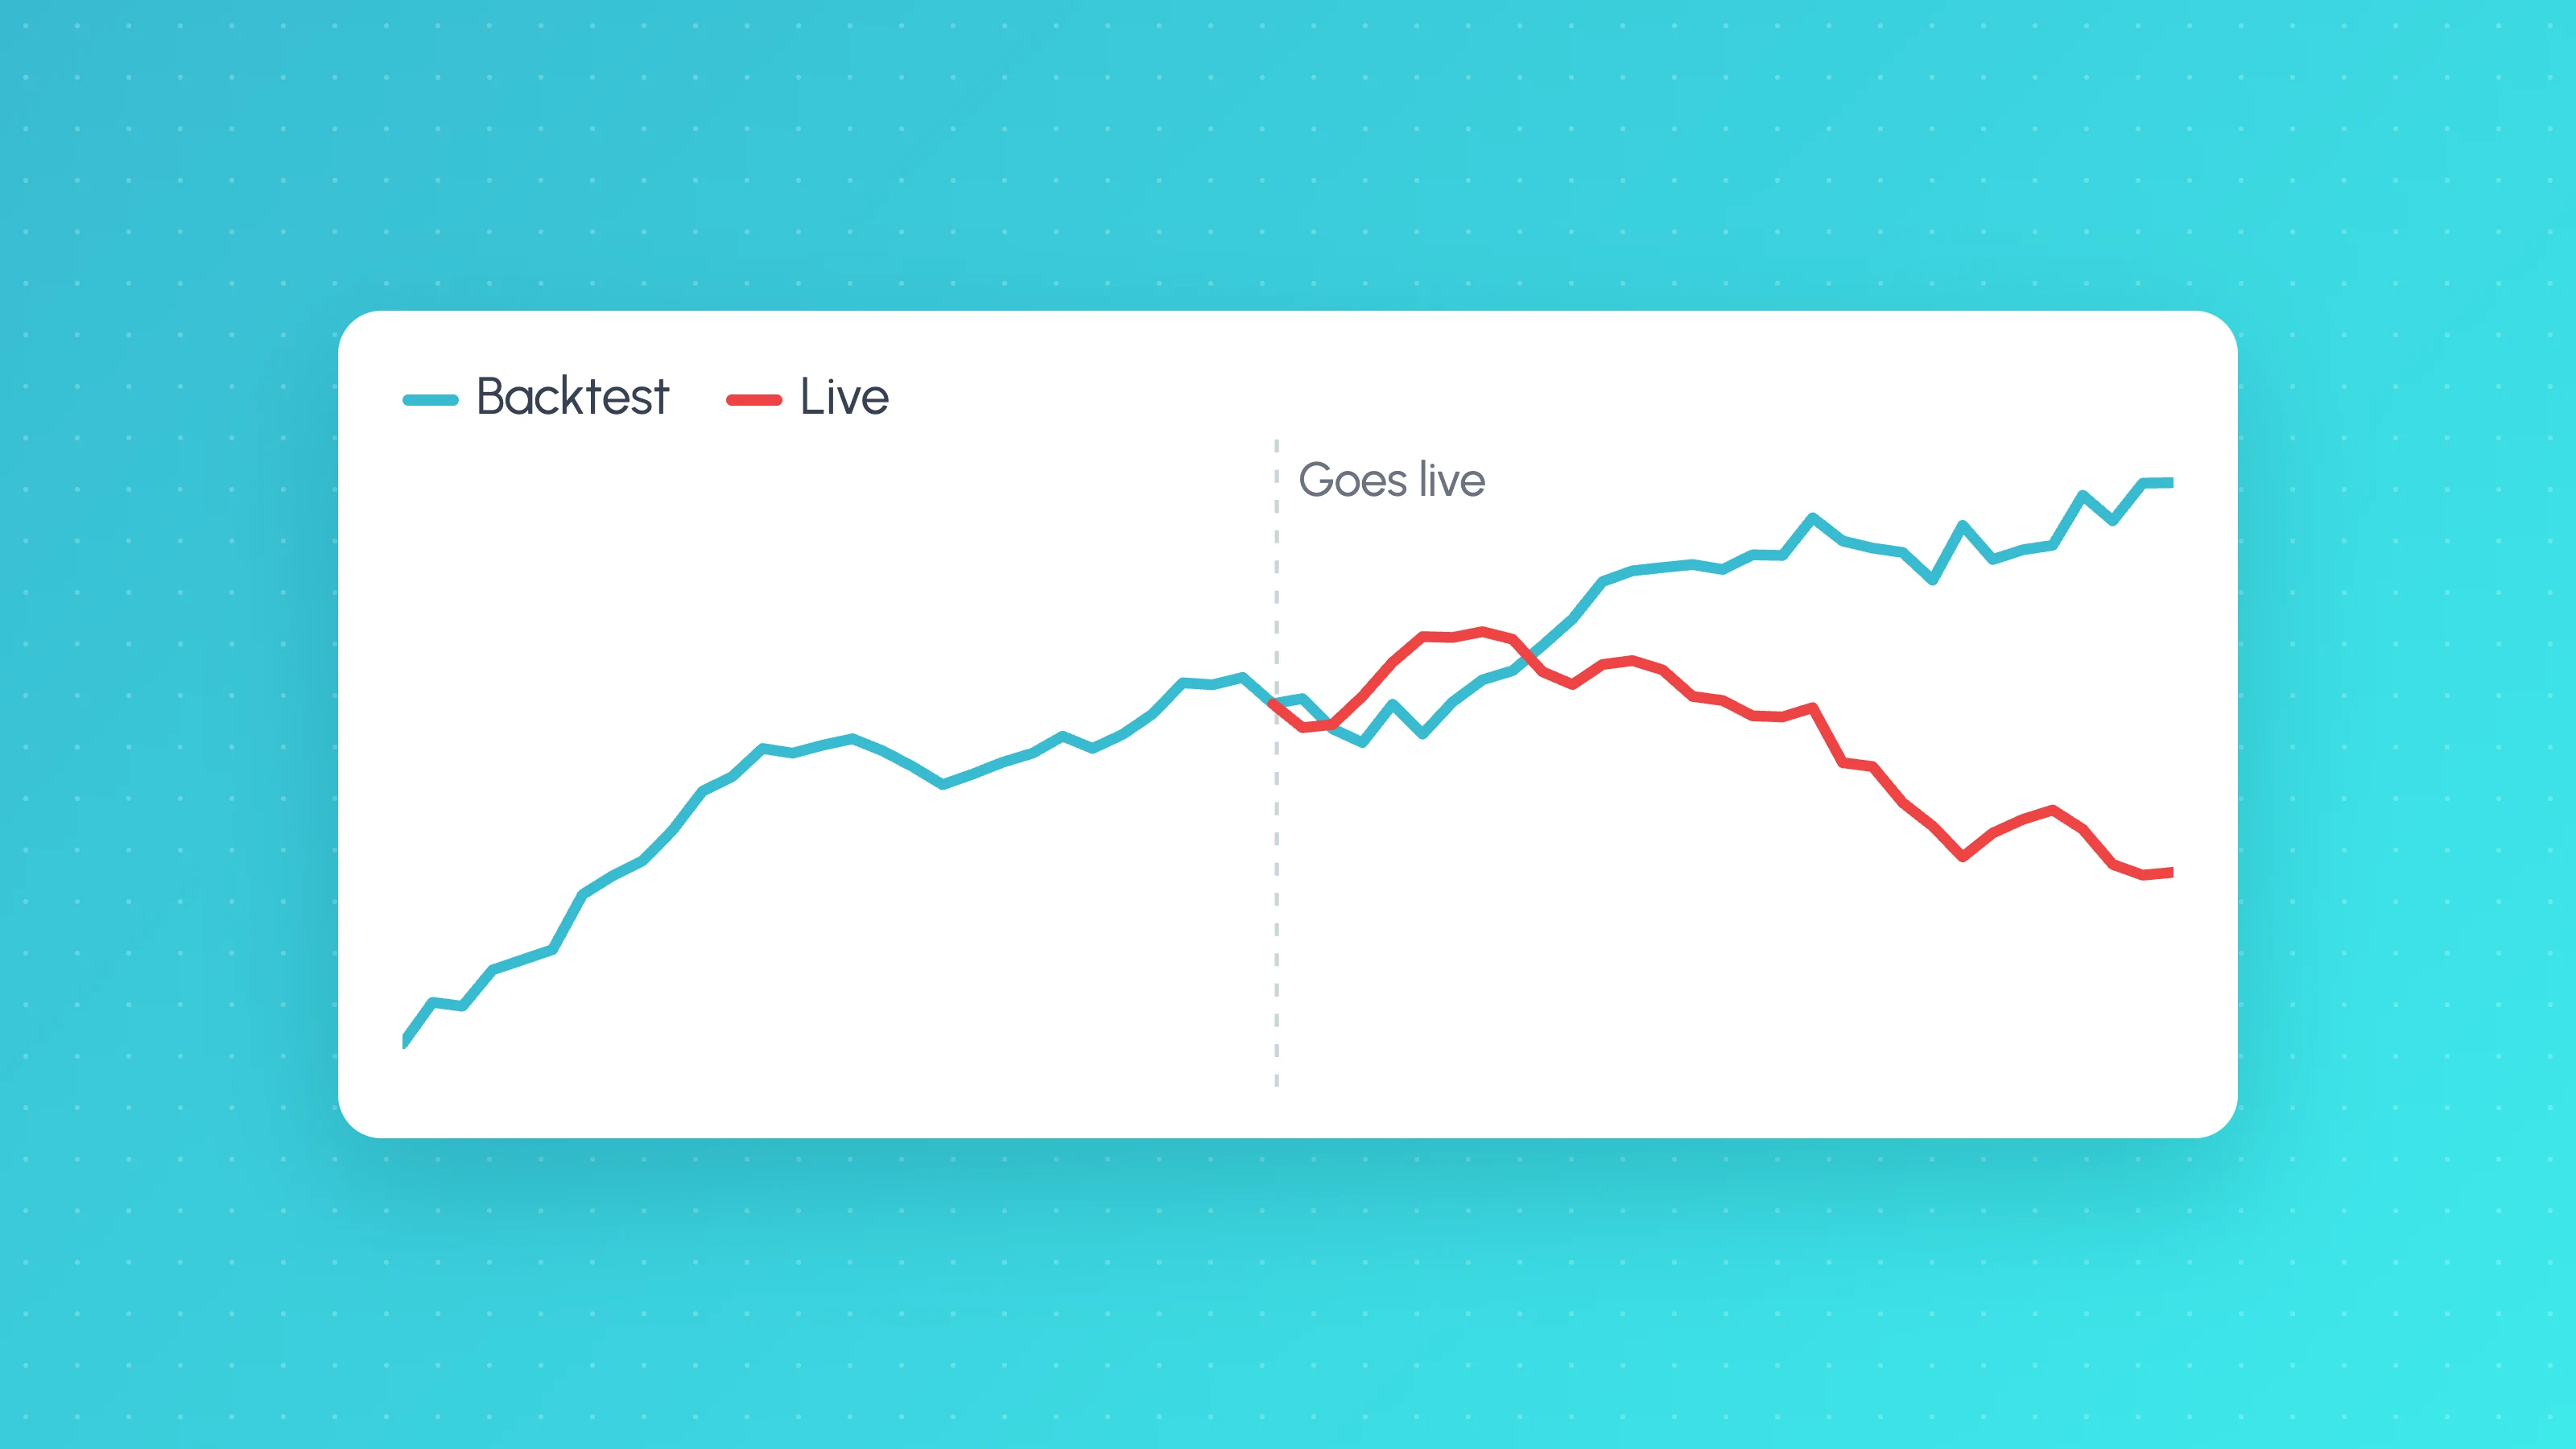
Why a TradingView strategy works in backtest but not live: costs, fill assumptions, repainting, gaps, data, alert delays and overfitting, with a check for each.
 TradingView backtests
How to Analyse a TradingView Backtest by Session, Weekday and Hour
Analyse a TradingView backtest beyond the summary: split trades by session, weekday, hour, volatility and direction, check sample sizes, then test the rule.