

How to Stress Test a Trading Strategy: 6 Tests Before You Go Live
How to stress test a trading strategy before going live: six robustness tests, what each one catches and a pass or fail rule of thumb, with worked examples.
By Tessera Trades · Updated · 11 min read
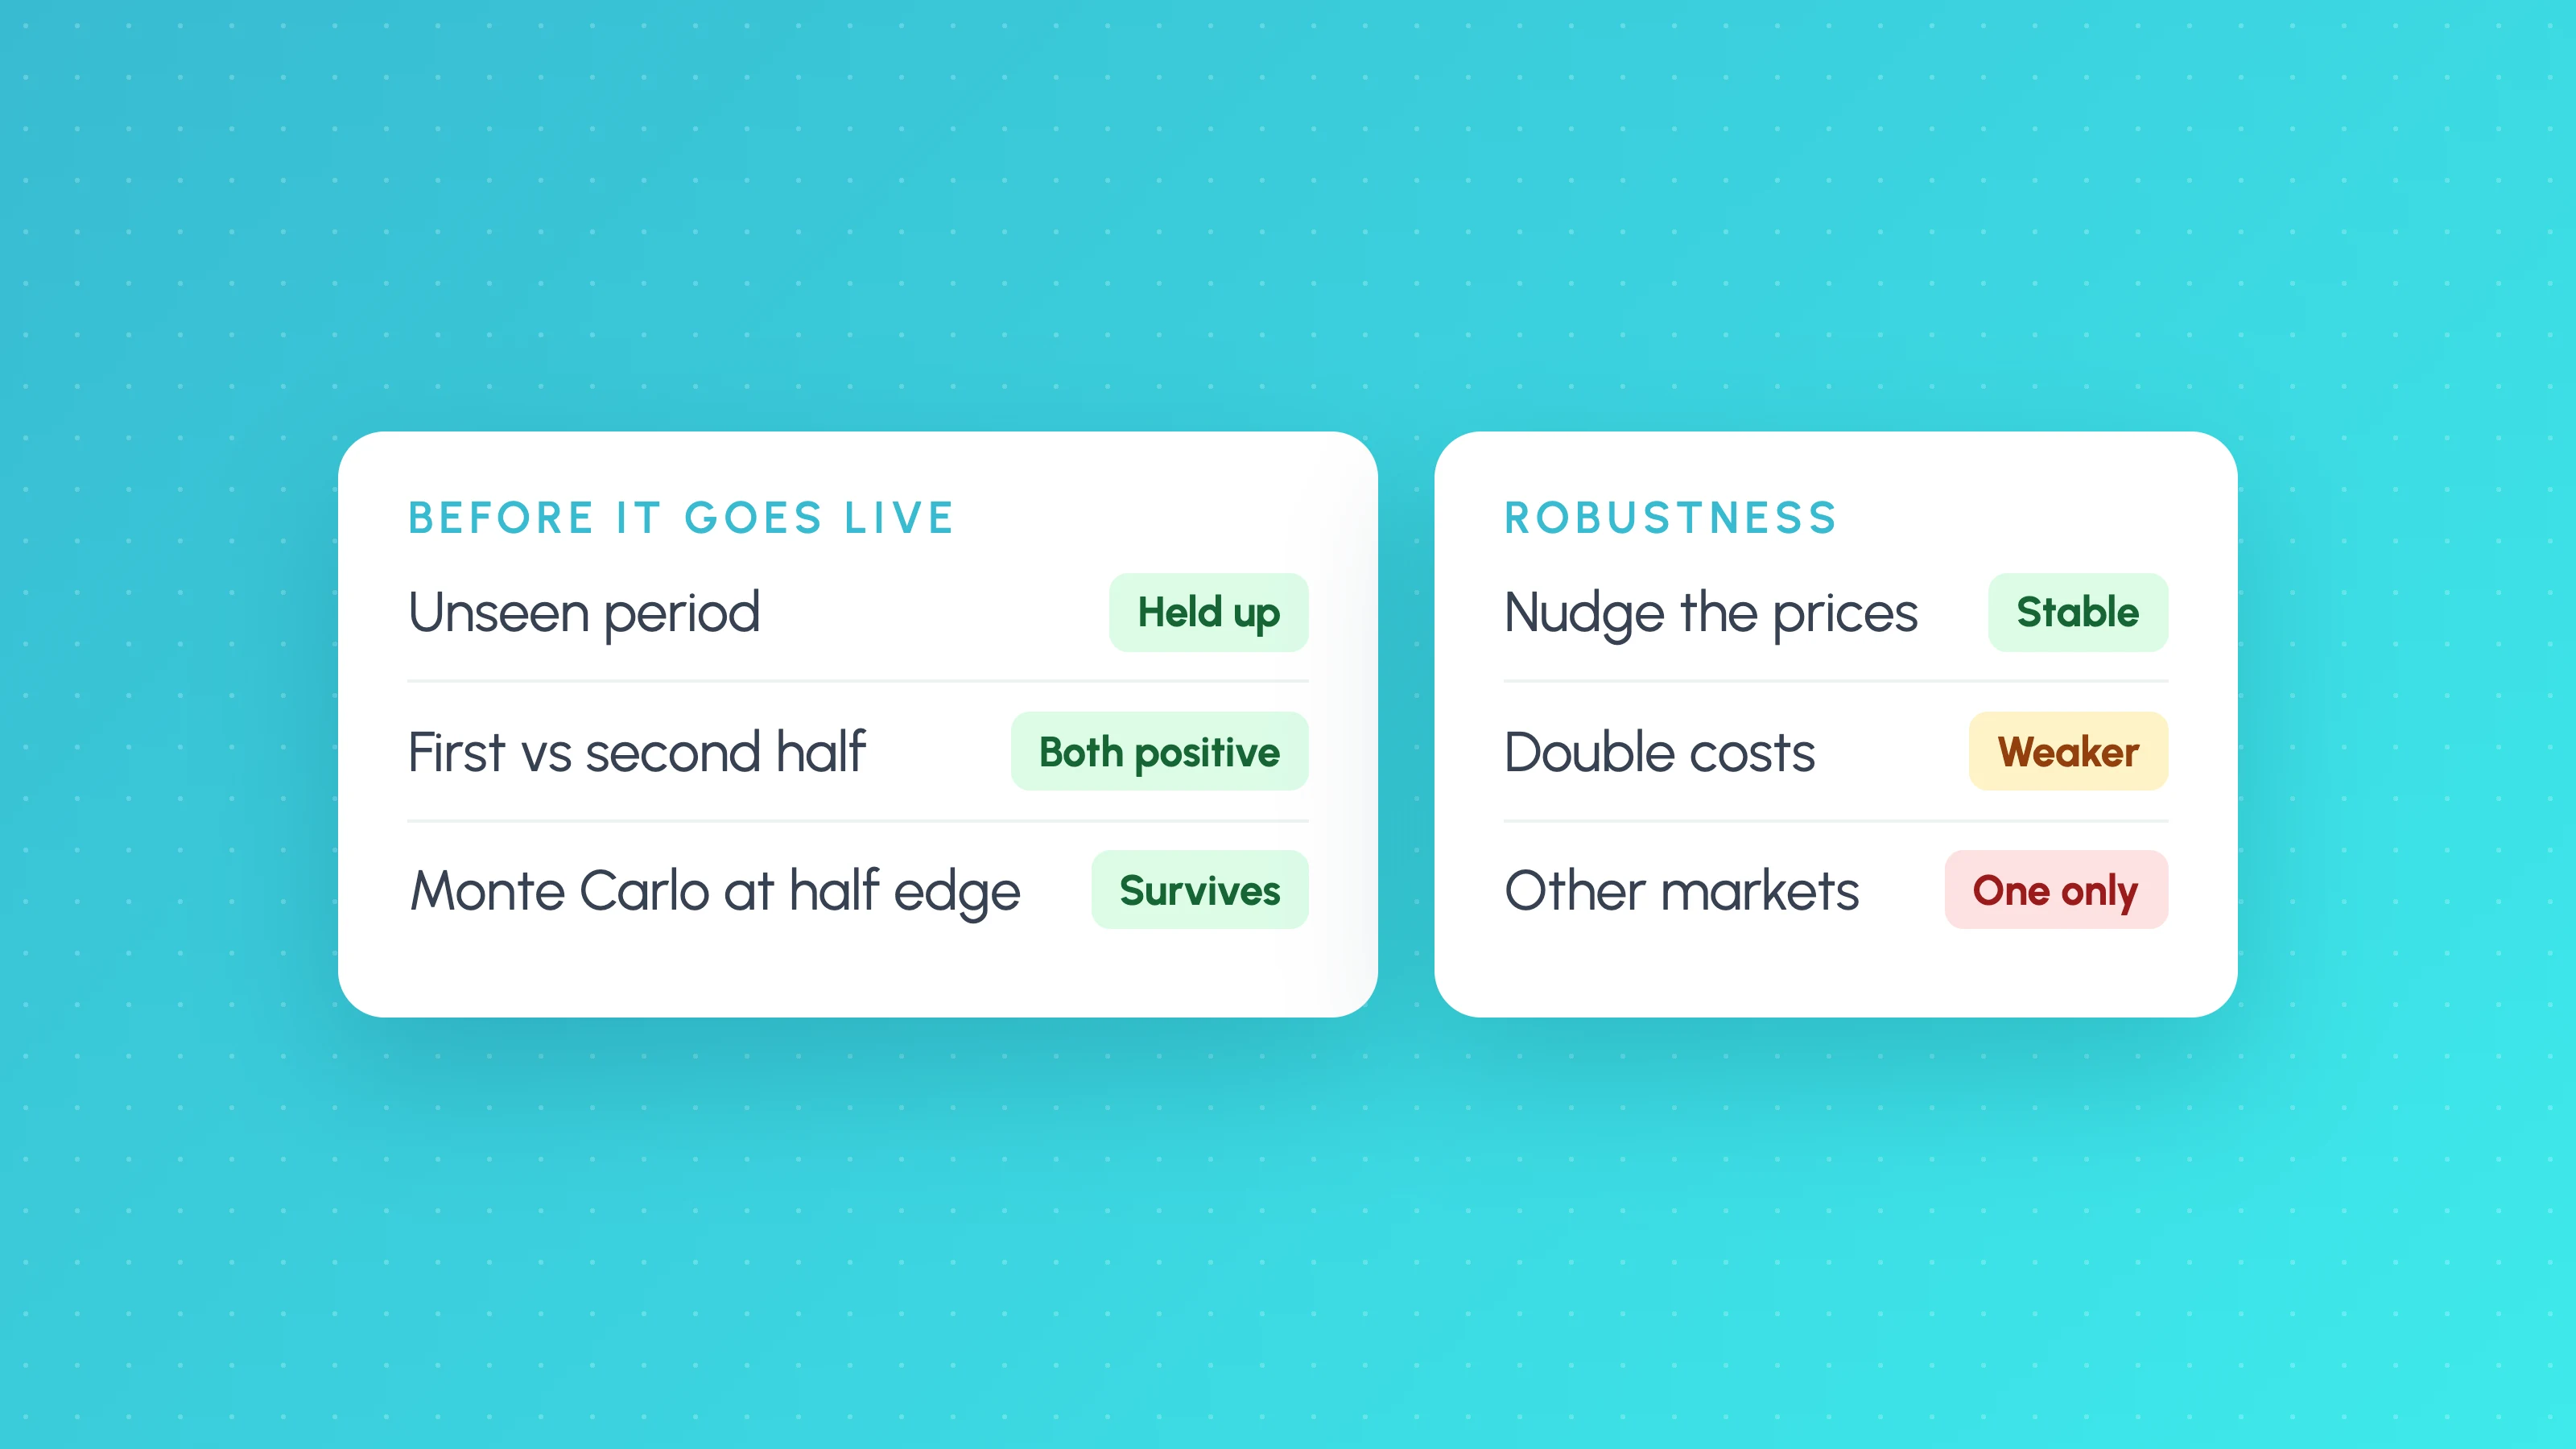
To stress test a trading strategy, deliberately make its backtest harder and see whether the edge survives: run it on a period it never saw, compare the first half of the data with the second, reshuffle its trades with Monte Carlo, re-run it on slightly noisy prices, double its costs and assume the stop is hit first inside ambiguous candles, then try it on other markets. A robust strategy gets a little worse under each test. A fragile one collapses under one or more of them.
A stress test asks how much has to go wrong before the rules stop making money. Below are six tests, what each catches, and a pass or fail rule of thumb for each. The thresholds are judgement, not statistical standards, so write yours down first.
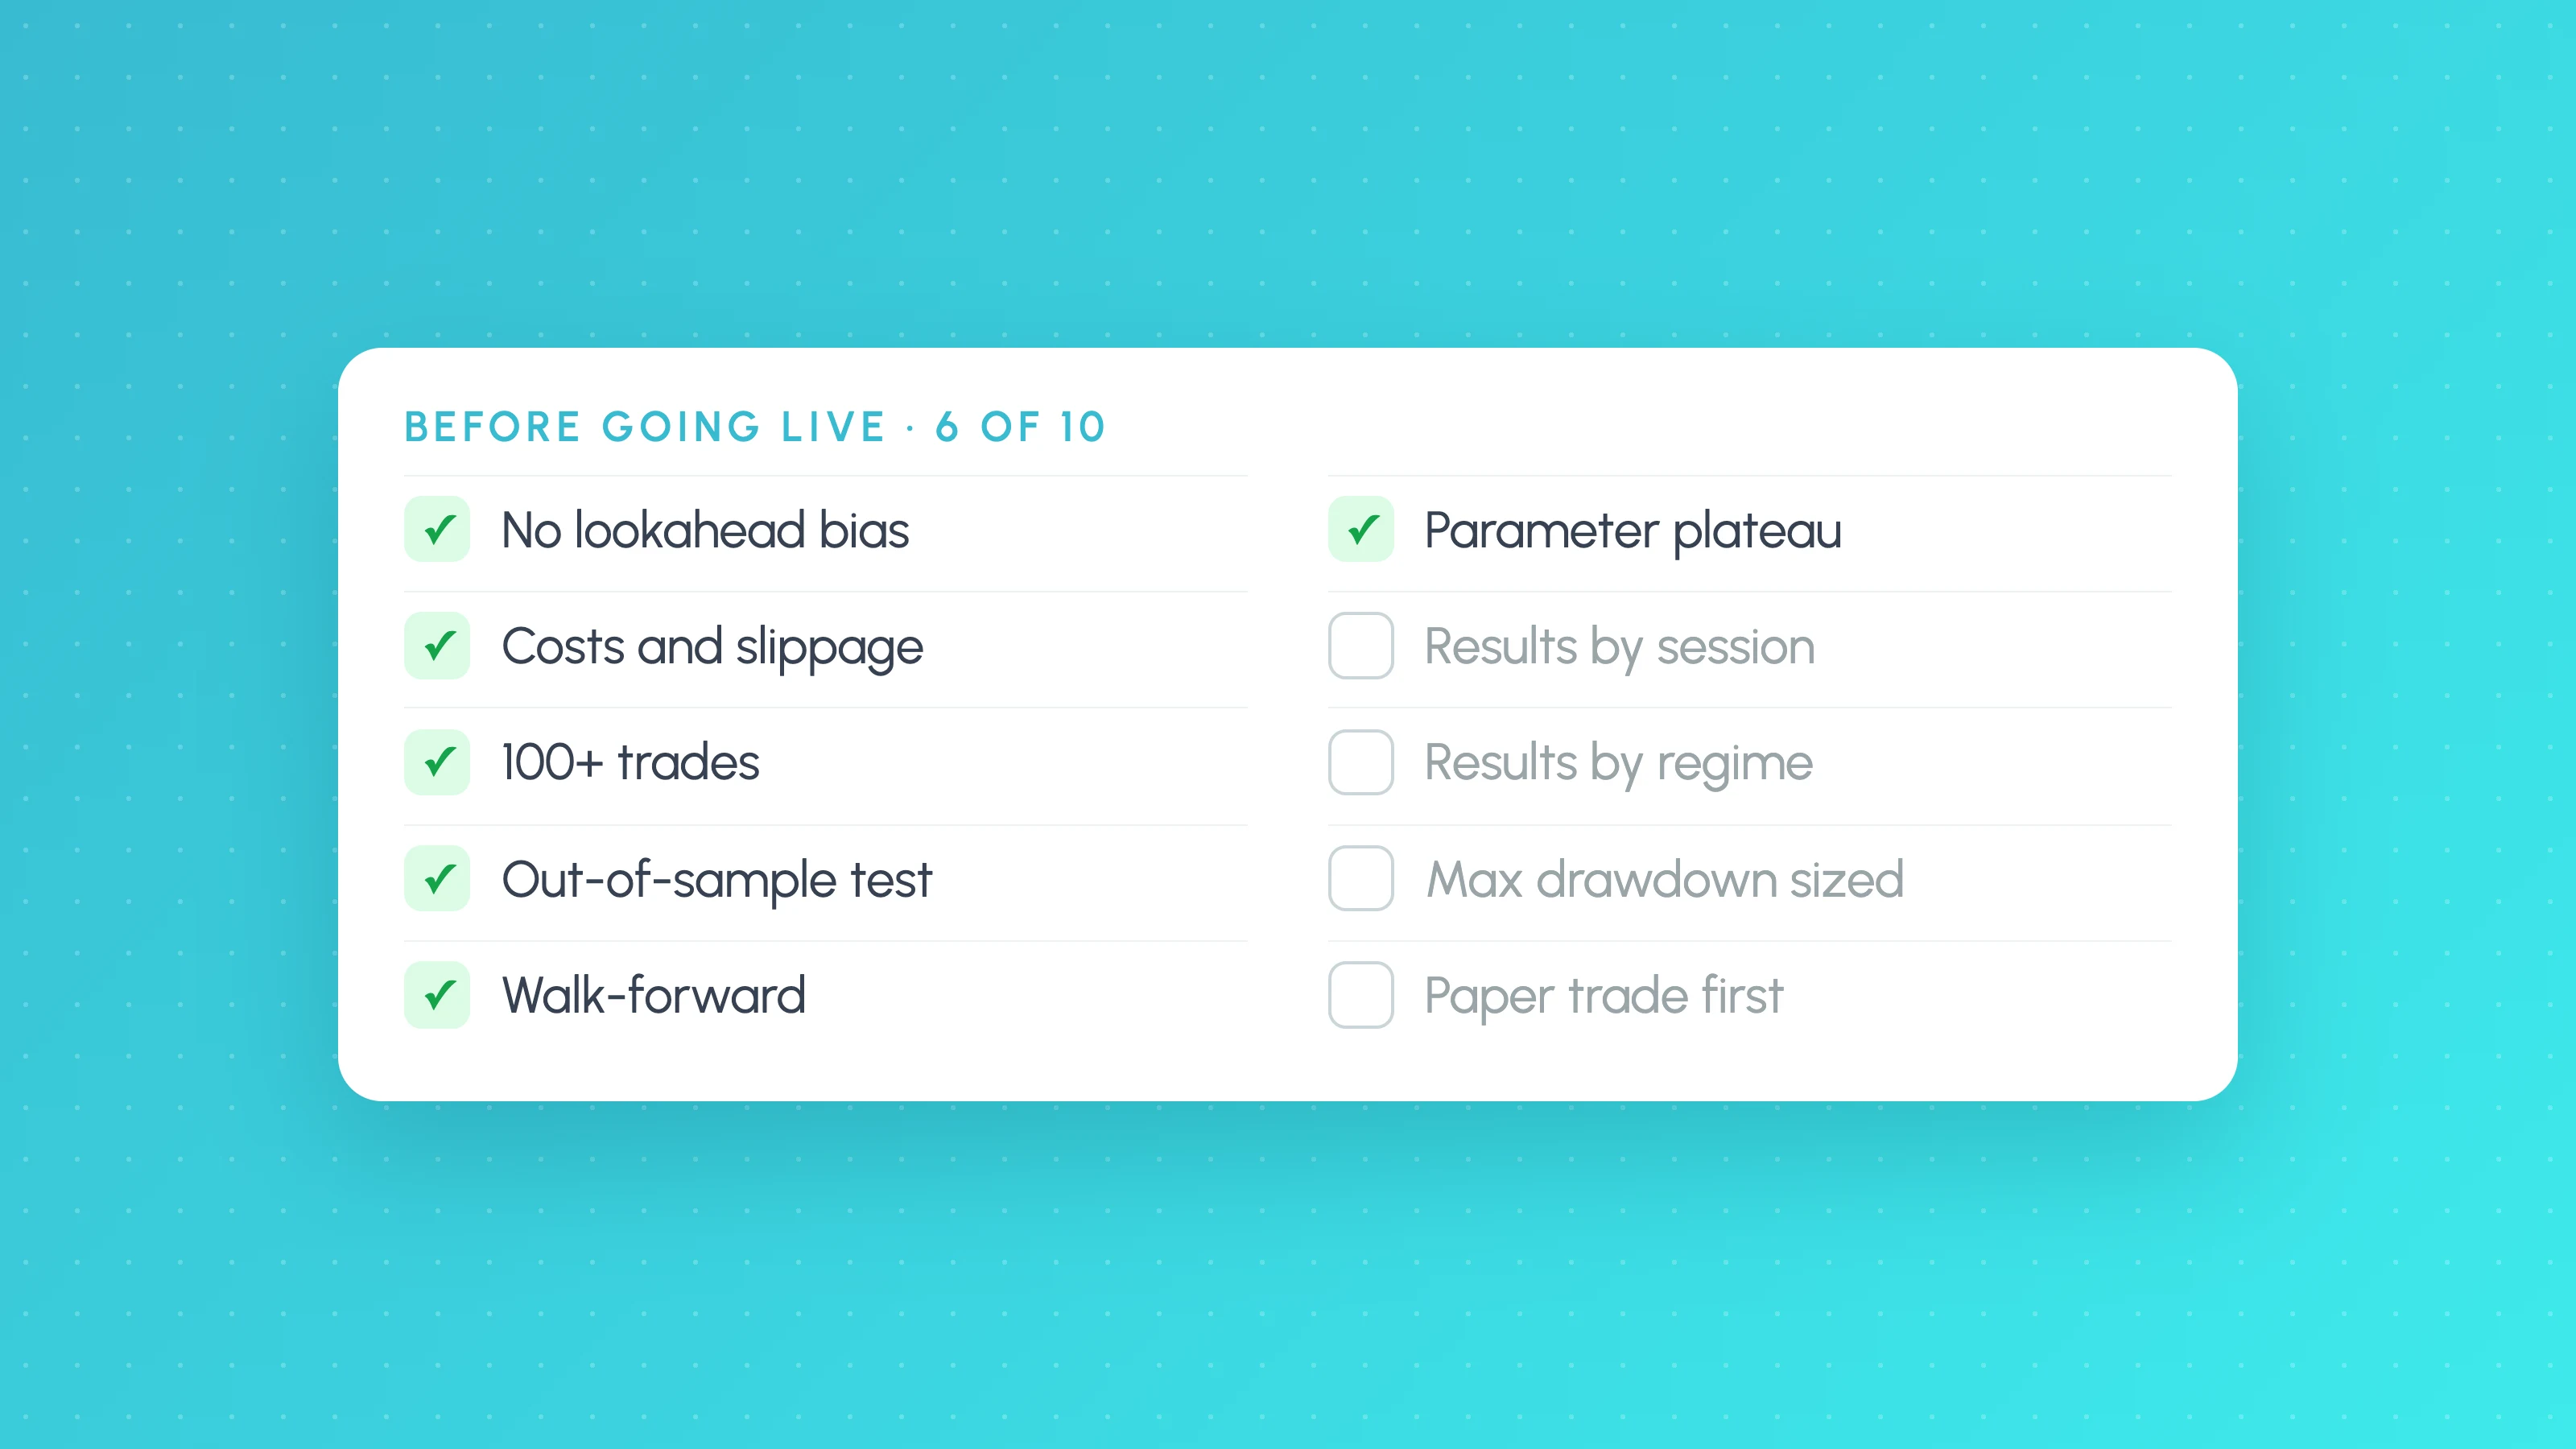
If you have not yet checked that the backtest itself is honest (no lookahead, realistic fills, enough trades), start with the backtest validation checklist. Stress testing a backtest built on impossible trades only tells you how robust an illusion is.
The six tests at a glance
| # | Test | What it catches | Pass (rule of thumb) |
|---|---|---|---|
| 1 | Unseen period | Rules fitted to the data you built them on | Positive on the hold-out, with at least about half the development edge |
| 2 | First half vs second half | An edge that lived in one era | Both halves positive, neither carries most of the profit |
| 3 | Monte Carlo | A drawdown understated by one lucky trade order | You could survive the bad-case drawdown at half the edge |
| 4 | Price noise | Trades that depend on an exact tick | Results stable across noisy copies of the data |
| 5 | Cost and intrabar stress | An edge thinner than real trading costs, or built on lucky fills | Still positive at double costs and with stop-first fills |
| 6 | Other markets | A pattern that only exists in one symbol's history | Works without re-tuning on several related markets |
Run them roughly in this order. Tests 4 and 5 are the ones most traders skip.
1. The unseen period
What it catches: overfitting. Every rule you chose looked good on the data in front of you; data you never looked at is the only fair judge.
How to run it: hold back the most recent part of your history, commonly 20 to 30%, and build only on the rest. When the strategy is finished, run it once on the held-out part. Out-of-sample testing for traders covers how big the hold-out should be and why you can only use it once.
Pass or fail:
- Held up: the hold-out is profitable and its expectancy per trade is at least about half of the development period's.
- Weaker: still profitable, but well under half. Treat the edge as smaller than the backtest says and size for that.
- Failed: negative on the hold-out. The development result was mostly fit.
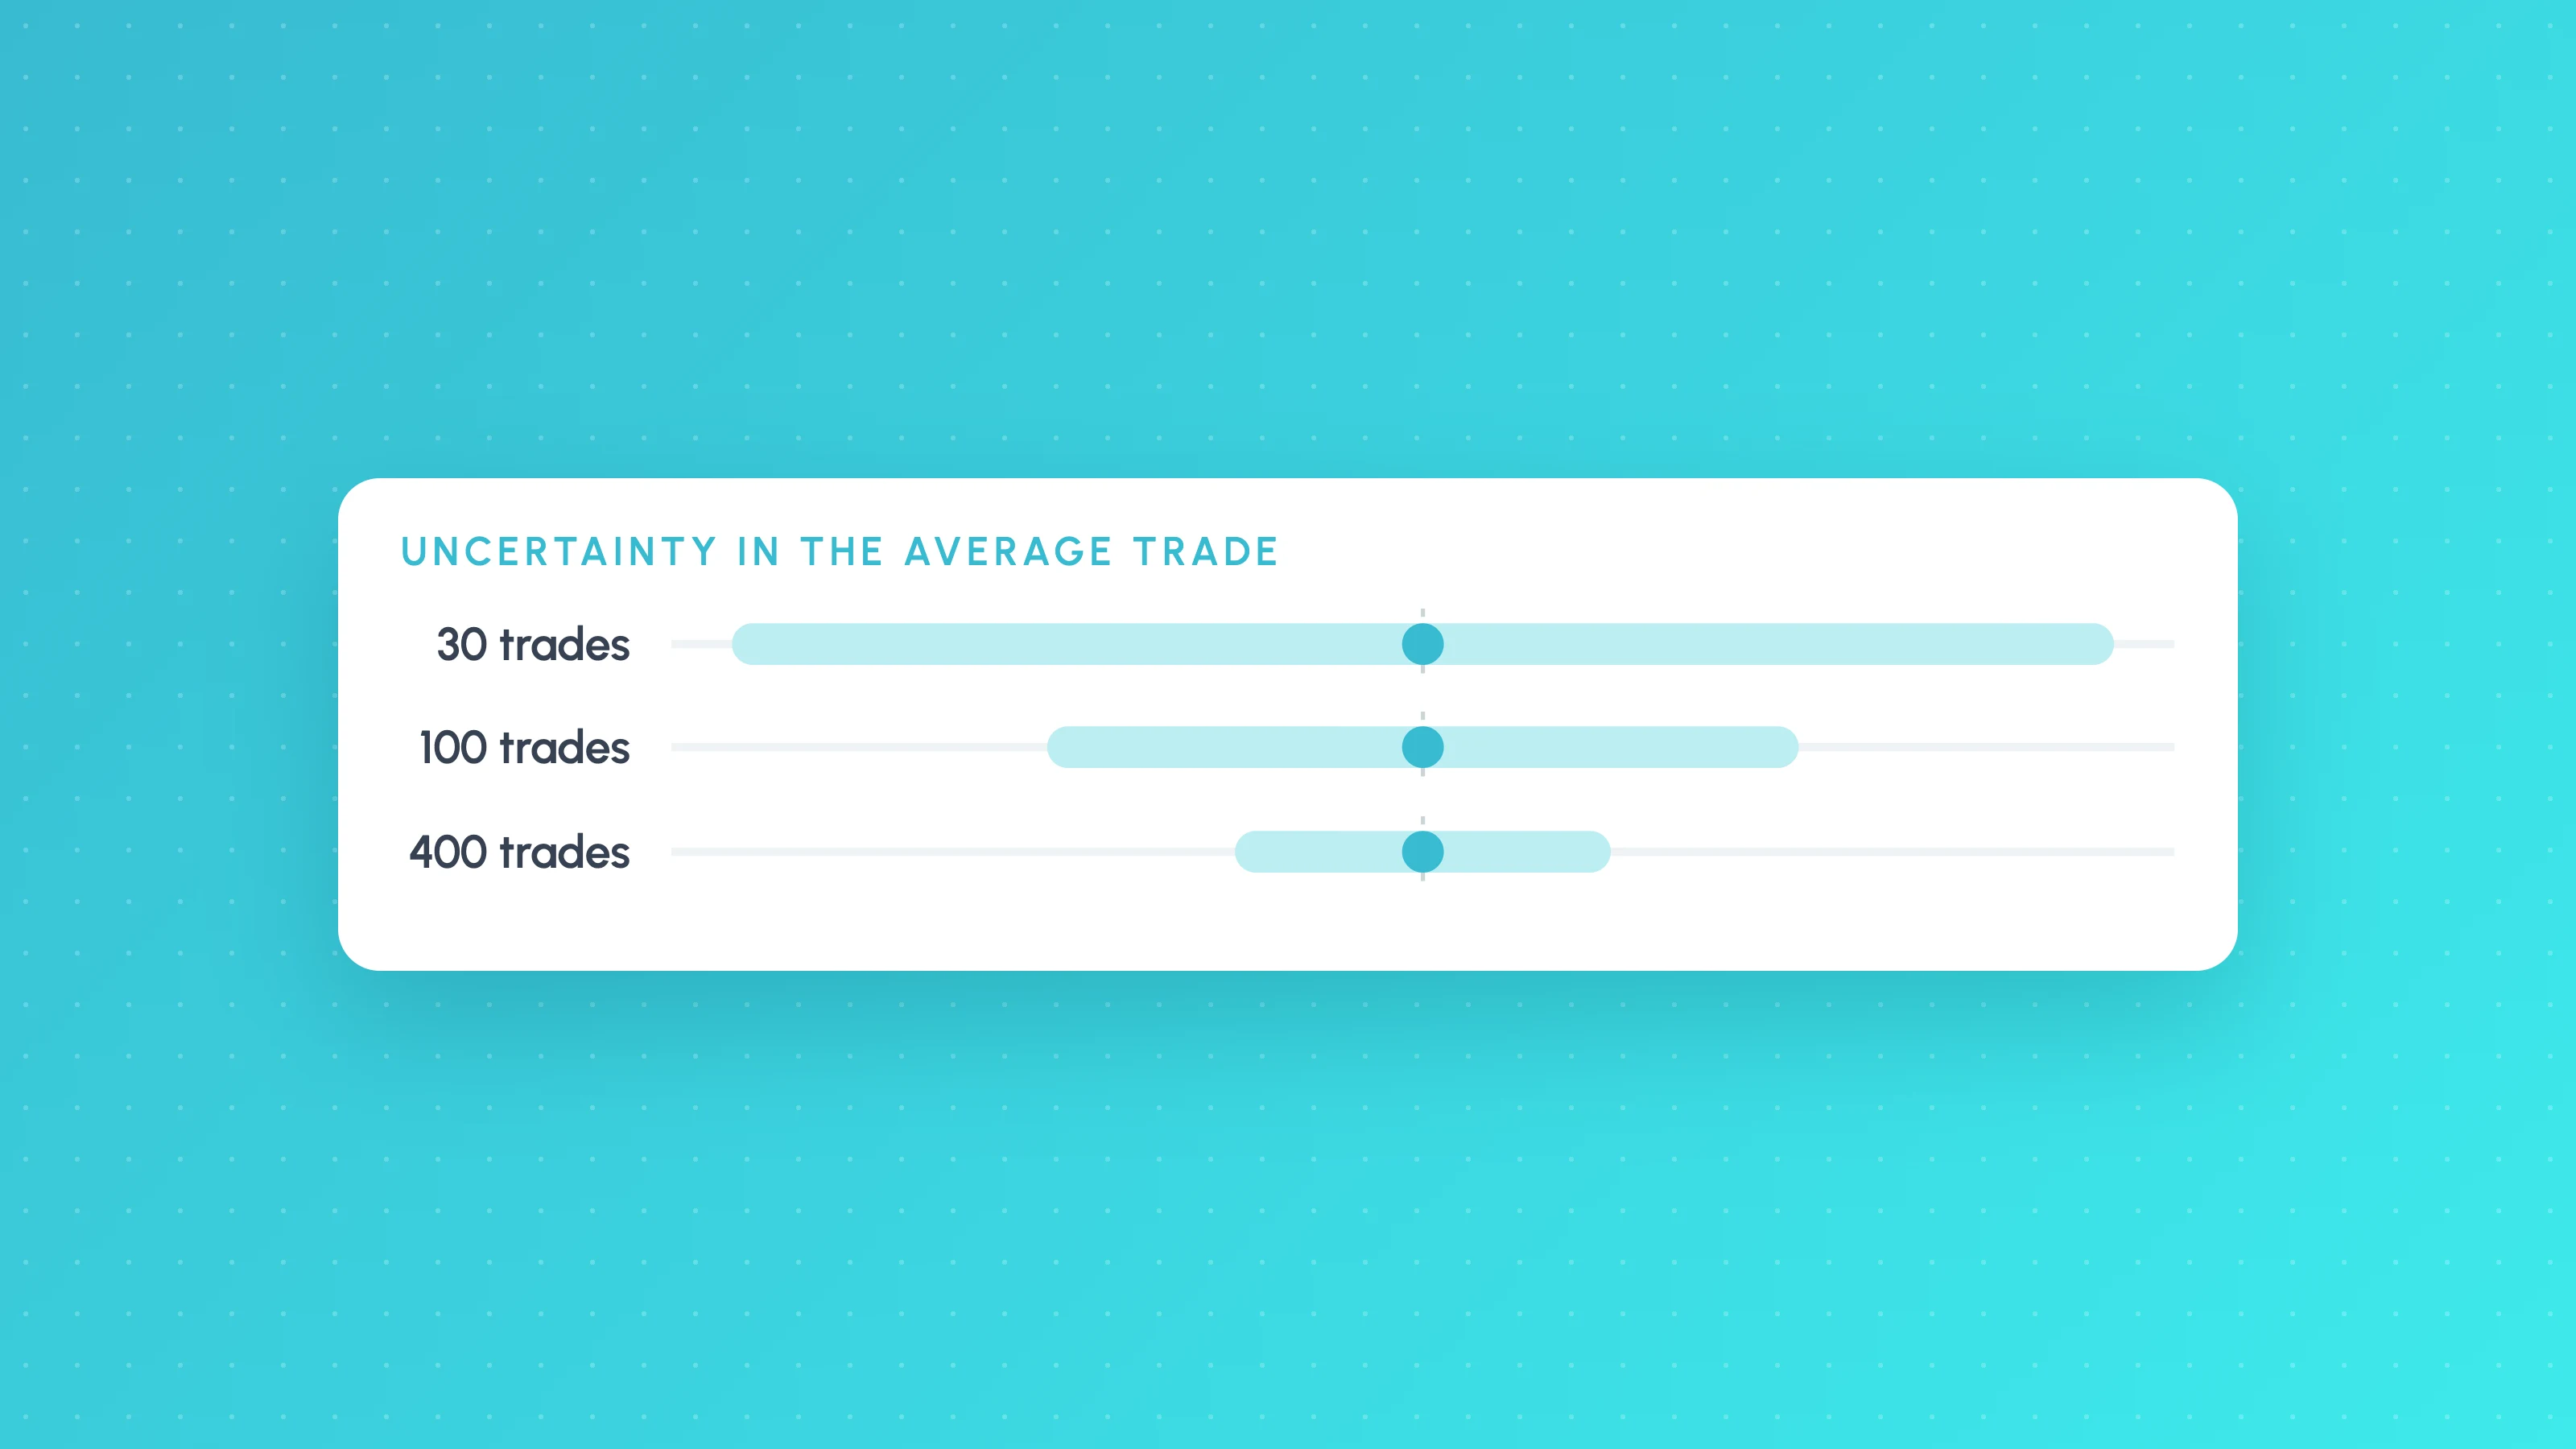
- Too few trades: under about 30 trades in the hold-out, the result is noise either way. Get more data or more markets, not a verdict.
2. First half versus second half
What it catches: an edge that came from one era. A strategy that made all its money in a high-volatility stretch, or before a market changed its structure, can show a good overall result while being flat or negative for years.
How to run it: split the development period in two by date and compare the halves on expectancy, profit factor and drawdown. Also look at the last 12 months on their own, because that is the market you are about to trade.
Worked example (hypothetical, round numbers): a strategy makes 60R over 400 trades. The first half made 52R over 200 trades and the second half made 8R over 200 trades.
- First half expectancy: 52 ÷ 200 = 0.26R per trade
- Second half expectancy: 8 ÷ 200 = 0.04R per trade
Both halves are positive, but the second half has less than a sixth of the first half's edge, and 0.04R per trade is easily eaten by costs. The headline 0.15R average describes a market that may no longer exist.
Pass or fail: both halves positive, and neither half supplies more than about three quarters of the total profit. If the edge is fading from one half to the next, check the last 12 months before going any further.
3. Monte Carlo
What it catches: a drawdown that looks small only because the trades happened to arrive in a kind order. Your backtest is one sequence of trades. Monte Carlo builds thousands of other plausible sequences from the same trades and reports the range of drawdowns and returns.
How to run it: resample the trade list many times and record the worst drawdown and the 12-month return in each run. A block bootstrap, which resamples runs of consecutive trades rather than single trades, keeps losing streaks together and gives more honest drawdowns. Run it twice: once as tested, and once with the edge cut in half, because the backtest's average trade is usually the best version of a strategy you picked from several. Monte Carlo backtesting explained covers the methods and how to read the output, and the free Monte Carlo simulator runs the basic version on any trade list.
Pass or fail: at half the edge, the 95th percentile drawdown is one you could sit through without abandoning the strategy or breaching an account limit, and losing years are rare enough that you would keep trading through one. If not, reduce size before going live. It needs at least about 20 trades to run and far more to trust: see how many trades a backtest needs.
4. Price noise: nudge the prices
What it catches: trades that only exist because of an exact price. If a breakout entry triggers because the high cleared a level by one tick, a feed that printed one tick lower would never have taken it. Your broker's prices are not identical to the data you backtested on, so a strategy that depends on exact ticks will trade differently live.
How to run it: make copies of the price data with small random changes to each candle's open, high, low and close, sized like the differences you actually see between feeds, then re-run the unchanged strategy on each copy. Ten copies show the direction of the problem. More copies make the range clearer.
What to look at:
- How much the expectancy and profit factor move between copies.
- Whether any copy turns negative.
- Which trades appear in some copies and not others. These fragile trades are where the strategy sits on a knife edge.
Pass or fail: stable if the results stay in a narrow range and every copy keeps the same sign. Sensitive if the spread is wide or some copies lose money. A sensitive strategy is not always worthless, but look at the fragile trades: if the best trades in the backtest are among them, the edge is partly an artefact of one data feed.
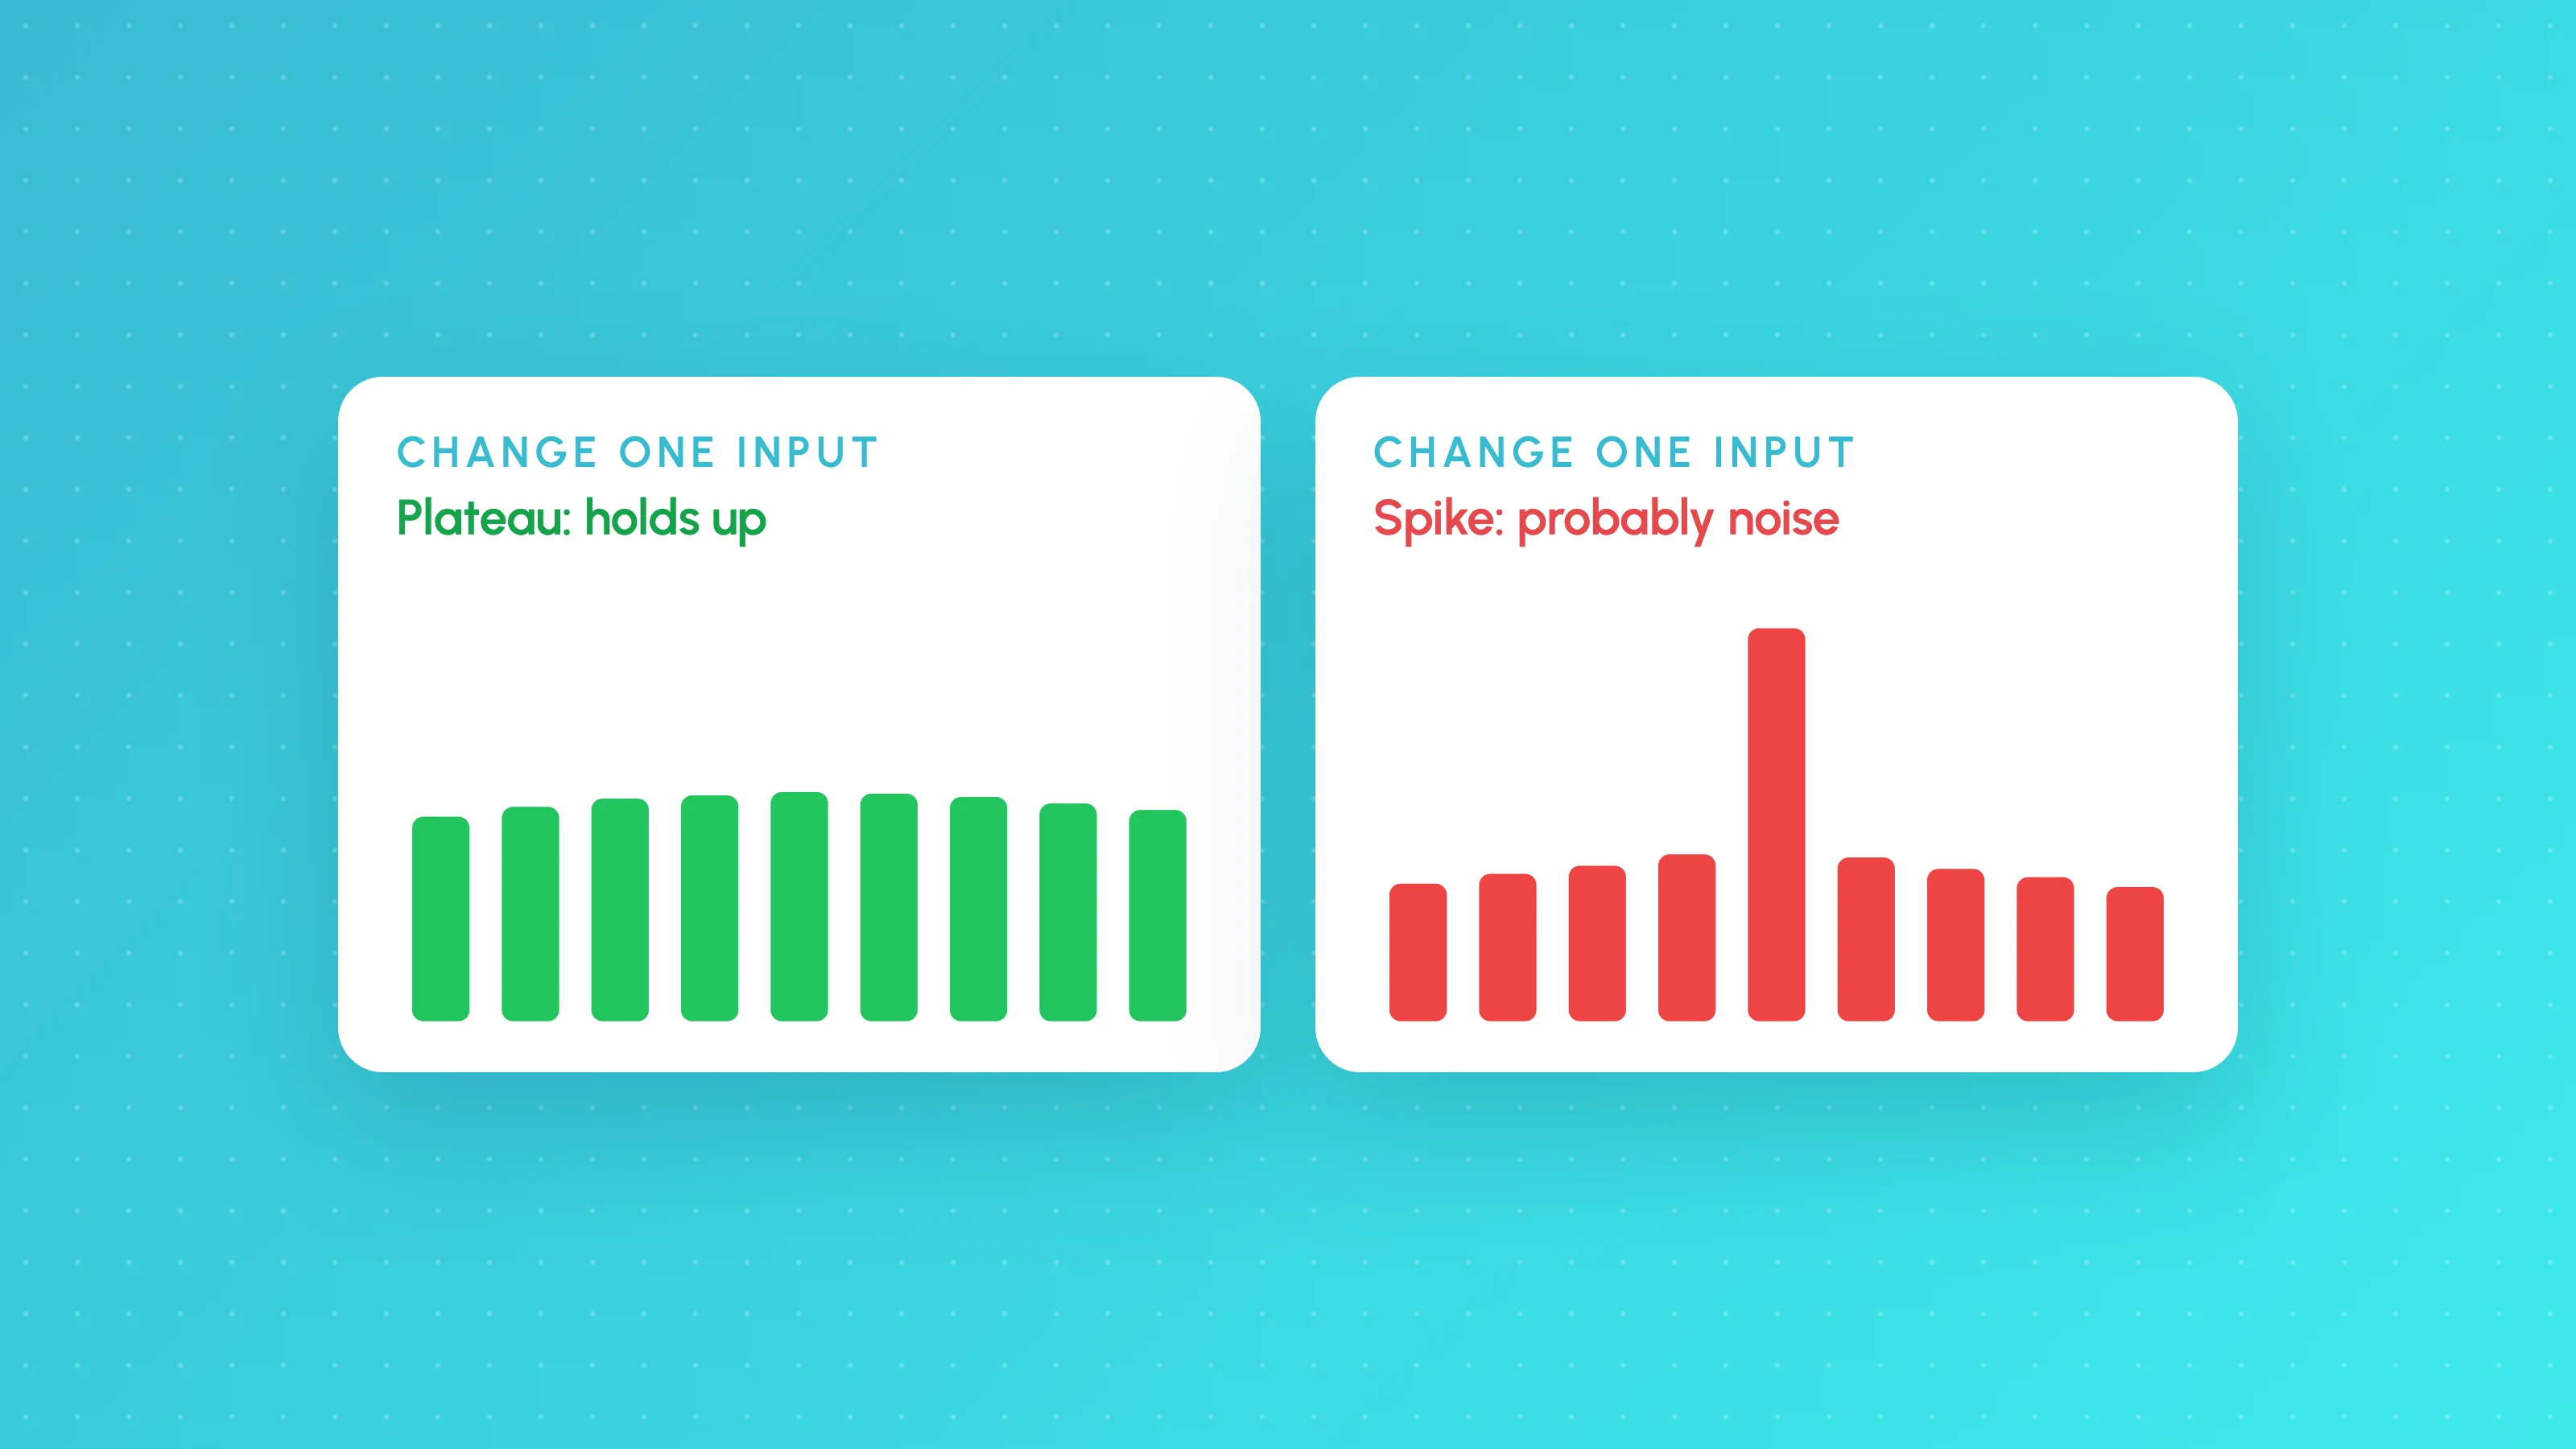
Unlike parameter sensitivity, which moves your inputs (see is my backtest overfit?), noise testing keeps the inputs fixed and moves the market.
5. Cost stress and intrabar stop-first
What it catches: an edge that is thinner than real trading costs, and results that depend on generous guesses about what happened inside a candle.
Costs at half and double
Re-run with commission, spread, slippage and swap at half and at double your typical figure. Half shows how much you would gain from a better broker. Double is the stress: spreads widen at the open and around news, and live slippage is often worse than you assumed. How much slippage to assume in a backtest covers how to pick the typical figure.
Worked example (hypothetical): a strategy makes 0.25R per trade before costs, and typical costs come to 0.08R per trade.
| Cost level | Cost per trade | Net expectancy |
|---|---|---|
| Half | 0.04R | 0.21R |
| Typical | 0.08R | 0.17R |
| Double | 0.16R | 0.09R |
At double costs the strategy keeps about half its net edge (0.09 ÷ 0.17 ≈ 0.53). That passes, but only just. A strategy making 0.12R gross with the same costs would be at -0.04R at double costs, which fails.
Intrabar stop-first
When a candle's range covers both the stop and the target, a backtest has to guess which was hit first. TradingView's default bar path guesses from where the open sat; a lower-timeframe bar magnifier checks finer data; stop-first assumes the worst every time. TradingView bar detalization explained covers the TradingView settings.
Worked example (hypothetical): 300 trades with a 2R target make 51R in total (0.17R a trade). Forty trades had the stop and target inside the same candle, and the default bar path scored 25 of them as winners. Under stop-first, each of those 25 goes from +2R to -1R, a swing of 3R each.
- Lost to stop-first: 25 × 3R = 75R
- New total: 51R - 75R = -24R
The strategy was never profitable on fills it could rely on. Tight stops on higher timeframes are the usual cause.
Pass or fail: still profitable at double costs, and still profitable under stop-first, with the drop small enough that you would trade the stop-first version. If stop-first wipes out the edge, widen the stop, use a lower timeframe for exits, or drop the strategy.
6. Other markets
What it catches: a quirk of one symbol's history. If an opening-range breakout works on one index and no other, you probably found noise in that one chart.
How to run it: run the unchanged strategy, with no re-tuning, on related markets: other major indices for an index strategy, other majors for a forex strategy, other large coins for a crypto strategy. Unrelated markets are a weaker test, because a session-based index setup has no reason to work on a 24-hour crypto perp.
Pass or fail:
- Carries across: positive on most related markets, even if weaker than on the original. This is strong evidence of a real effect.
- Some markets: positive on a few. Acceptable if you can explain why those markets and not the others.
- One market or none: treat the original result as unproven, however good it looks.
What stress testing can't tell you
Passing all six tests means the edge is not obviously fitted, fragile or cost-bound. It does not mean the strategy will make money. Markets change, and a backtest, however tough, describes the past. Your strategy, your settings and your risk are your responsibility. Leveraged products such as CFDs and forex can lose money quickly, so size every live trade on the assumption that results will be worse than the backtest.
The next step after a strategy passes is a forward test on live prices. How long to paper trade a strategy covers how many trades you need and what to compare.
Run all six in Strategy Lab
Strategy Lab runs these tests automatically on every backtest, on every plan including Free:
- Unseen period: the last 30% of the data is held out and given a verdict of held up, weaker, failed or too few trades. You also get the first half against the second half, the last 12 months, a check that removes the best trades, cost fragility, skipped signals and a multiple-testing warning.
- Monte Carlo: 1,000 simulated years by block bootstrap, as tested and at half the edge, with the chance of a 30% or 50% drawdown, the median worst drawdown, 12-month return bands from 5% to 95% and losing years. It needs 20 or more trades.
- Nudge the prices: the strategy is re-run on 10 noisy copies of the data (up to 100), calibrated to real feed differences, with a stable or sensitive verdict and the fragile trades listed.
- Cost and intrabar stress: half, typical and double costs, and a stop-first stress test. You can also choose TradingView bar path, TradingView Bar Magnifier or stop-first as the fill rule.
- Other markets: the same strategy on up to 50 markets (1 on Free, 5 on Standard, 20 on Plus, 50 on Pro), with a verdict of carries across, some markets, one market or none.
You can build the strategy without code, with TES, the AI strategy coach, or the recipe composer, and TES can run these tests and explain the results. If you plan to trade a prop firm account, the prop firm challenge simulator replays the same trades through the account's rules. See pricing for what each plan includes.
Frequently asked questions
- What is a robustness test for a trading strategy?
- A robustness test changes something the strategy should not depend on, such as the time period, trade order, exact prices, costs or market, and checks whether the edge survives. A robust strategy gets somewhat worse under each change; a fragile one stops working under one of them.
- How do you stress test a backtest?
- Run the finished strategy on a held-out period, compare the two halves of the data, reshuffle the trades with Monte Carlo, re-run it on slightly noisy prices, double the costs and assume stop-first fills, then try it on related markets without re-tuning. Decide the pass criteria before you look at the results.
- What is a noise test in backtesting?
- A noise test re-runs the unchanged strategy on copies of the price data with small random changes to each candle. If the results stay similar, the strategy does not depend on exact ticks. If they swing widely, some trades only exist because of one feed's exact prices.
- How much should costs be stressed in a backtest?
- Doubling your typical costs is a common stress level, because spreads and slippage widen in fast markets. A strategy that stays clearly positive at double costs has room for the costs you will actually pay; one that turns negative has an edge too thin to trade.
- Does passing stress tests mean a strategy will work live?
- No. Stress tests reduce the chance that the backtest is fitted or fragile, but they cannot predict a change in the market. Forward test on live prices, start at small size, and compare live results with the backtest's expected range as the trades come in.
Keep reading
 TradingView backtests
Backtest Validation Checklist: 10 Checks Before You Trade a Strategy Live
A backtest validation checklist: 10 checks to run before going live, from costs, fills and repainting to out-of-sample, Monte Carlo and forward tests.
 TradingView backtests
Is My Backtest Overfit? A Practical Checklist for Traders
How to tell if a backtest is overfit: too-good metrics, thin samples, fragile inputs, useless filters, out-of-sample and walk-forward tests, plus a checklist.
 TradingView backtests
How Many Trades Do You Need for a Valid Backtest?
How many trades a backtest needs: rules of thumb, the t-statistic formula with a worked example, a table by edge size, per-bucket minimums and multiple testing.