

TradingView Strategy Tester Settings Changed: Bar Detalization, Limit Fills and Order Delay Explained
TradingView bar detalization replaced Bar Magnifier in July 2026. What it, Limit order execution and Order execution delay do to fills and results.
By Tessera Trades · Updated · 11 min read
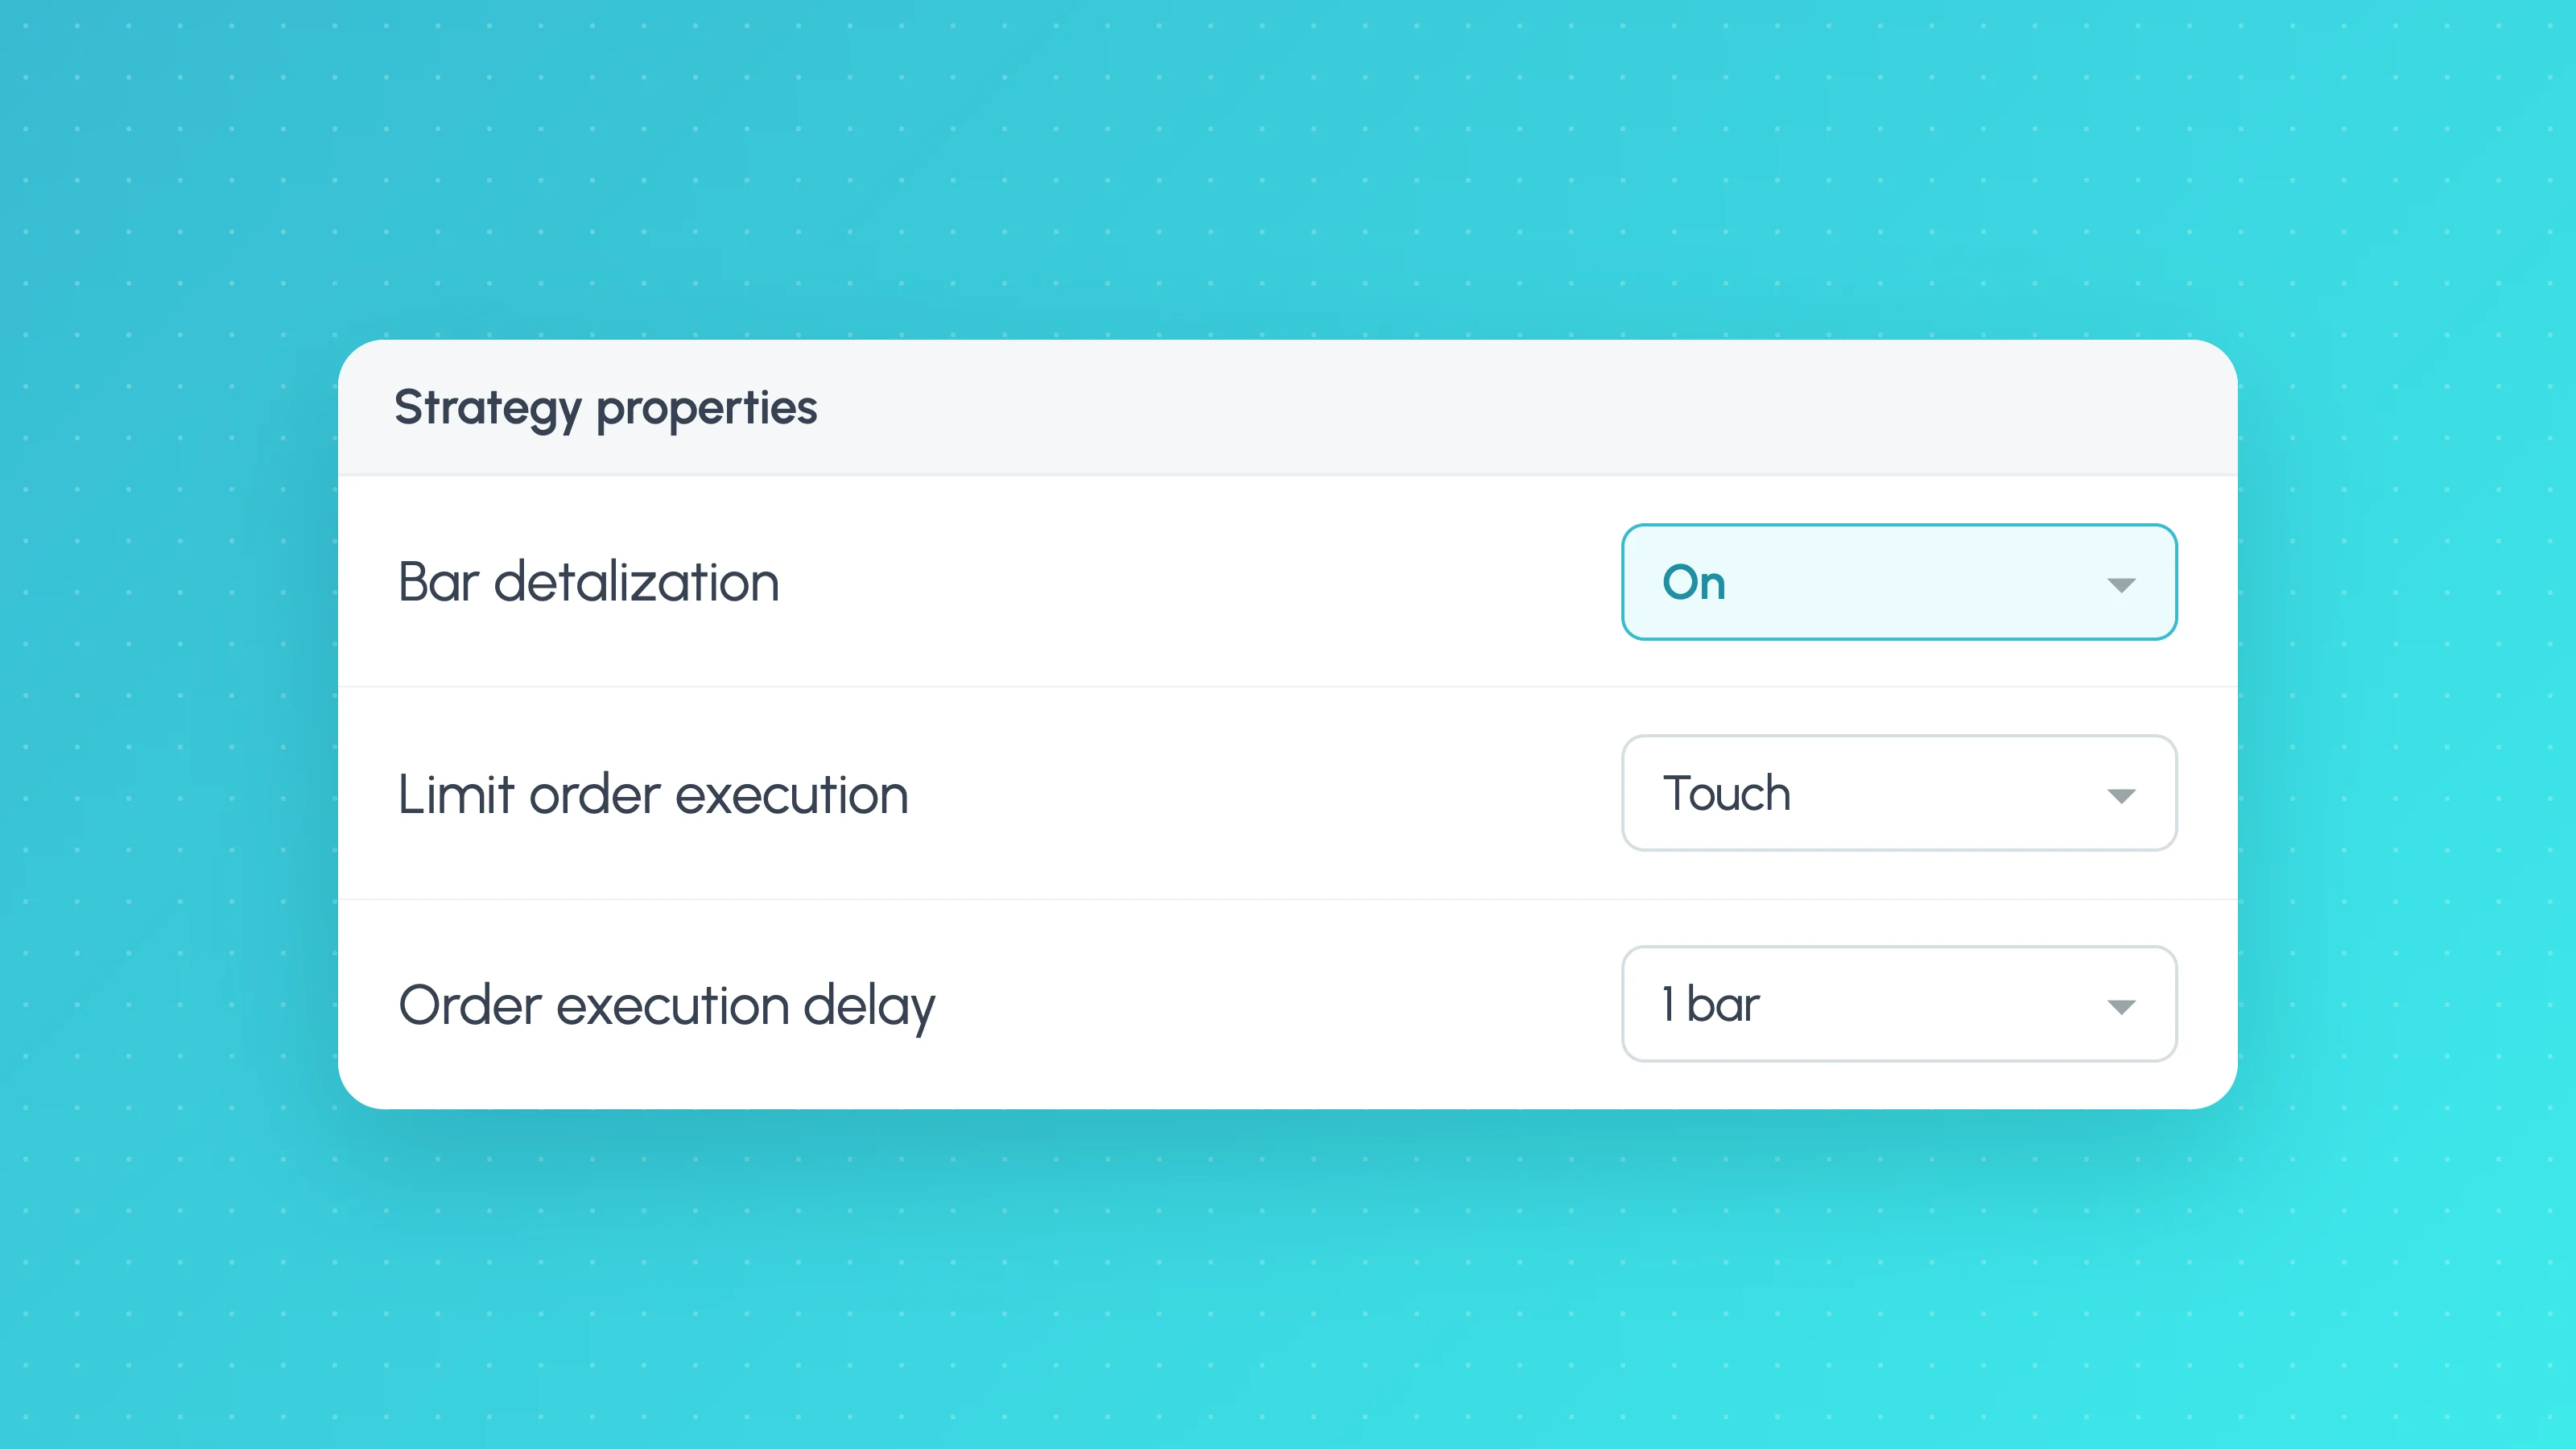
In TradingView, "detalization" means how much price detail inside each historical bar the Strategy Tester uses to fill orders, so more detail gives more realistic fills. Bar detalization is the setting that replaced the Bar Magnifier in July 2026: it controls how many simulated price ticks the broker emulator uses inside each historical bar, either 4 (open, high, low, close) on Default or roughly 60 on High, which needs Premium or Ultimate. More intrabar detail means fewer guesses about which price came first, so stops, targets and limit orders that sit inside the same bar fill more realistically.
The same July 2026 Pine Script release also turned two other Properties checkboxes into menus: "Verify price for limit orders" became Limit order execution, and the fill-on-close checkbox became Order execution delay. The strategy() parameters you already use (use_bar_magnifier, backtest_fill_limits_assumption, process_orders_on_close) still work; they now set the default value of each menu. If your results don't match an older screenshot or tutorial, these renamed settings are the first place to look.
What changed, in one table
The table is based on the July 2026 section of the Pine Script release notes and the older Strategy properties help page, checked in October 2026.
| Old name (pre-July 2026) | New name | Pine parameter that sets the default |
|---|---|---|
| "Using bar magnifier" checkbox (Bar Magnifier) | Bar detalization menu | use_bar_magnifier |
| "Verify price for limit orders" | Limit order execution dropdown | backtest_fill_limits_assumption |
| Fill orders on bar close checkbox | Order execution delay | process_orders_on_close |
| "Recalculate" options | Script execution menu | calc_on_every_tick, calc_on_order_fills, calc_on_every_history_tick (new) |
| "Fill orders using standard OHLC" | Heikin Ashi mode (only shown on Heikin Ashi charts) | fill_orders_on_standard_ohlc |
| Margin for long/short positions | Long leverage / Short leverage | margin_long, margin_short (converted to leverage) |
| Strategy Tester | Strategy report | n/a |
The strategy() parameters keep their names and now set each input's default; for the margin parameters the release notes say they remain "for backward compatibility". What changes is where you find each control, what the options are called, and in a couple of cases how many options there are.
Bar detalization: what it changes in fills
On historical bars, TradingView's broker emulator doesn't know the real sequence of trades inside a bar. With the Default setting it replays each bar as four ticks. The strategies documentation explains the assumed path: if the open is closer to the high, price goes open, high, low, close; if it is closer to the low, open, low, high, close.
That guess matters whenever two orders sit inside one bar's range. Say a long trade has a stop 10 points below entry and a target 15 points above, and the next bar's range covers both. On Default, the emulator decides which was hit first from the open's position alone. If the open was nearer the high, the target fills first and the trade is a winner, even if in reality price fell to the stop before rallying.
Setting Bar detalization to High replaces the four-tick guess with a simulation built from lower-timeframe data. TradingView's Detalization and execution help article says High uses about 60 ticks per bar on average, chosen from the chart resolution. A few examples from its table:
| Chart timeframe | Intrabar timeframe used | Ticks per bar on High |
|---|---|---|
| 1 minute | 10 seconds | 24 |
| 5 minutes | 30 seconds | 40 |
| 15 minutes | 2 minutes | 28 |
| 1 hour | 10 minutes | 24 |
| 4 hours | 30 minutes | 32 |
| 1 day | 60 minutes | 96 |
| 1 week | 1 day | 28 |
The help article notes the number of ticks "may vary due to calculation factors", so treat these as typical rather than exact. Two other limits from the strategies documentation:
- Scripts can request at most 200,000 bars from a lower timeframe, so on long histories the earliest bars may not get lower-timeframe detail.
- On 1-tick and 1-second charts the setting has no effect.
To turn High on by default in code:
//@version=6
strategy("Detalization example", overlay = true, use_bar_magnifier = true)
use_bar_magnifier = true keeps its old name but now selects High in the Bar detalization menu. A user can still change the menu in the Properties tab or at the top of the strategy report.
Who gains or loses from High
Strategies with tight stops and targets relative to the bar range, scalping systems on 5 to 15 minute charts, and anything with many trades lasting zero or one bar are most exposed to the four-tick guess. A daily swing system whose stop and target are rarely both inside one bar will usually barely change. If switching to High cuts a strategy's results sharply, the original backtest was partly built on favourable intrabar assumptions, which is one of the causes covered in why a strategy works in backtest but not live.
On history bar tick and calc_on_every_history_tick
Bar detalization changes how orders fill. A separate new option changes how often your script runs on historical bars. The Script execution menu now has an On history bar tick checkbox, set in code with the new calc_on_every_history_tick parameter. According to the release notes, when it is true the script executes once for each available tick in every historical bar, with price and volume variables updated to approximate what was known while the bar was forming. It needs Premium or Ultimate and works only on standard charts.
The help article lists the four Script execution options:
| Option | Parameter | What it does |
|---|---|---|
| On bar close | (always on) | Runs once per bar close on historical and realtime bars; cannot be disabled |
| On order fill | calc_on_order_fills | Extra run straight after a fill |
| On realtime bar tick | calc_on_every_tick | Runs on every tick of the open realtime bar; no effect on history |
| On history bar tick | calc_on_every_history_tick | Runs on each simulated tick of historical bars; the number of runs depends on Bar detalization |
This matters for strategies that update stops or exits inside the bar, such as trailing logic. Before this option, historical bars ran once at the close while realtime bars could run on every tick, so a trailing stop could behave differently in the backtest and live. The help article suggests comparing results with and without On history bar tick to see whether exits depend on the tick sequence. The parameter has to be passed by name:
//@version=6
strategy("Intrabar exits", overlay = true,
     use_bar_magnifier = true,
     calc_on_every_history_tick = true)
Limit order execution
By default, TradingView fills a historical limit order as soon as price reaches its level. In live markets a limit order resting at the exact high or low of a move may not fill, because other orders can be ahead of it in the queue.
The new Limit order execution dropdown gives two choices, described in TradingView's broker emulator help article:
| Option | Fill rule | Use it for |
|---|---|---|
| Requested price | Fills when price reaches the limit | Optimistic case |
| Requested price and 1 tick beyond | Fills only after price trades one tick through the limit | More conservative testing |
TradingView's article recommends the second option "to prevent fills at prices the market only touched". Either way, the strategies documentation says verified limit orders still fill at their specified price, not one tick worse.
In code, backtest_fill_limits_assumption sets the default in ticks. The strategies documentation gives the default as 0 (fill on touch) and uses backtest_fill_limits_assumption = 3 as an example of requiring three ticks through. The dropdown only offers the two fixed options, so if you choose one of them manually you override a coded value like 3; the documentation says "Reset settings" restores the value from the declaration.
//@version=6
strategy("Conservative limits", overlay = true,
     backtest_fill_limits_assumption = 1)
Strategies that enter on limit orders at swing points, mean-reversion systems that buy the exact low of a band, and grid-style systems are the most affected. If a large share of their winning entries were fills on a touch, results can fall noticeably with one tick through.
Order execution delay
By default, a strategy calculates once at each bar's close, and orders it creates there fill on the next available tick, normally the next bar's open. The strategies documentation explains why: filling on the same tick that created the order is unrealistic.
The Order execution delay input replaces the old fill-on-close checkbox. Options are from the broker emulator article; the code equivalents are from the release notes, which say process_orders_on_close still sets the default:
| Option | What happens | Equivalent code |
|---|---|---|
| None | Orders fill on the same bar (the closing tick) that created them | process_orders_on_close = true |
| One tick | Orders fill on the next tick, allowing for a one-tick delay | process_orders_on_close = false (the default) |
"None" is the setting that most often flatters a backtest. A strategy that signals on the close and fills at that same close assumes you could see the final price and trade at it with no delay. Live, your alert fires after the close and your order arrives some time later. Use "One tick" unless your live execution really does fill at the closing price.
Why your TradingView backtest results changed
If the same script shows different numbers from last month, or from a tutorial screenshot, check these in order:
- Bar detalization. Was the old run on Bar Magnifier and the new one on Default, or the other way round?
- Script execution. Is On history bar tick ticked in one run and not the other?
- Limit order execution. Touch fills versus one tick through.
- Order execution delay. None versus One tick.
- Leverage. Margin percentages are now shown as leverage. The release notes say old
margin_longandmargin_shortvalues are converted, so the behaviour should match, but check the displayed value if position sizes look different. - Data range. Deep Backtesting, a different symbol or feed, or simply more history loaded will change the trade list. Our guide to exporting Strategy Tester results covers the 9,000 trade limit and Deep Backtesting.
Older third-party guides, and even some of TradingView's own help pages, still use the old labels. As of October 2026, TradingView's Strategy properties help page still describes "Using bar magnifier", "Verify Price For Limit Orders" and the "On bar close" checkbox. The parameters it documents are the same; only the interface names have moved.
Which settings give realistic results?
There is no single correct setting, but the conservative combination is easy to state. For a backtest you plan to trade:
| Setting | Conservative choice | Why |
|---|---|---|
| Bar detalization | High, if your plan has it | Removes most of the four-tick guess |
| On history bar tick | On, if exits update inside the bar | Historical runs behave more like realtime |
| Limit order execution | Requested price and 1 tick beyond | No fills on a touch |
| Order execution delay | One tick | No trading at a price you only saw after the close |
| Commission and slippage | Your broker's real values | Both default to zero |
As code:
//@version=6
strategy("Realistic settings", overlay = true,
     use_bar_magnifier = true,
     calc_on_every_history_tick = true,
     backtest_fill_limits_assumption = 1,
     process_orders_on_close = false,
     commission_type = strategy.commission.cash_per_contract,
     commission_value = 2.5,
     slippage = 2)
Replace the commission and slippage values with your own. TradingView's documentation also warns that excessive simulated slippage can make results unrealistically worse, so base it on what you see on your fills; how much slippage to assume covers measuring it.
None of these settings fixes repainting, lookahead from request.security(), or overfitting. They make the fill model more honest; the backtest validation checklist covers the rest.
Measure how much of the result came from fill assumptions
The most useful test is to run the same strategy twice, once with the optimistic settings (Default detalization, touch fills, no delay) and once with the conservative set above, and compare the two trade lists rather than just the headline numbers.
- Run the optimistic version and export the List of Trades as CSV.
- Switch to the conservative settings, re-run over the same range and export again.
- Compare which trades disappeared, which changed result and which conditions they were in.
If the lost profit is spread evenly, the strategy's edge is simply thinner than it looked. If it clusters in one session, one time of day or high-volatility bars, the fill assumptions were doing the most work there, and that is where live results are likely to disappoint. Our guide to analysing a TradingView backtest shows how to break the trades down by session, weekday and hour in a spreadsheet.
Tessera imports TradingView Strategy Tester exports and breaks each one down by session, weekday, time of day, volatility and symbol, so you can load both runs and see where the difference sits. It analyses the trades TradingView produced; it doesn't re-run the backtest or generate new fills.
Check your strategy under realistic fills
Export your strategy with the conservative settings and upload it to the free Entry Analysis report to see which market conditions its results come from. No card needed.
Frequently asked questions
- What happened to Bar Magnifier in TradingView?
- In July 2026 TradingView replaced the "Using bar magnifier" checkbox with a Bar detalization menu that has Default and High options. High does what Bar Magnifier did: it fills historical orders using lower-timeframe data. The
use_bar_magnifier = trueparameter still works and now selects High by default. - What does bar detalization do in TradingView?
- It sets how many simulated ticks the broker emulator uses inside each historical bar. Default uses four (open, high, low, close), while High uses lower-timeframe data for about 60 ticks per bar on average. More ticks mean fewer guesses about whether a stop or target inside the same bar was hit first.
- Why did my TradingView backtest results change?
- Usually because one of the renamed settings differs between the two runs: Bar detalization, On history bar tick, Limit order execution or Order execution delay. A different data range, symbol or Deep Backtesting period will also change the trade list. Compare the Properties tab of both runs before assuming the strategy itself changed.
- Is bar detalization High available on the free plan?
- No. As of October 2026 TradingView's documentation lists High bar detalization and On history bar tick as Premium and Ultimate features. Users on other plans have the Default setting, which replays each bar as four ticks.
- Should I use "Requested price" or "Requested price and 1 tick beyond" for limit orders?
- For a backtest you plan to trade, use "Requested price and 1 tick beyond". It stops the emulator filling limit orders that price only touched, which often don't fill live. If results drop a lot when you switch, many of the strategy's entries depended on touch fills.
- What does process_orders_on_close do now?
- It sets the default for the Order execution delay input.
process_orders_on_close = trueselects "None", so orders fill on the same closing tick that created them; the defaultfalseselects "One tick", so they fill on the next tick, usually the next bar's open. "One tick" is the more realistic choice for most strategies.
Keep reading
 TradingView backtests
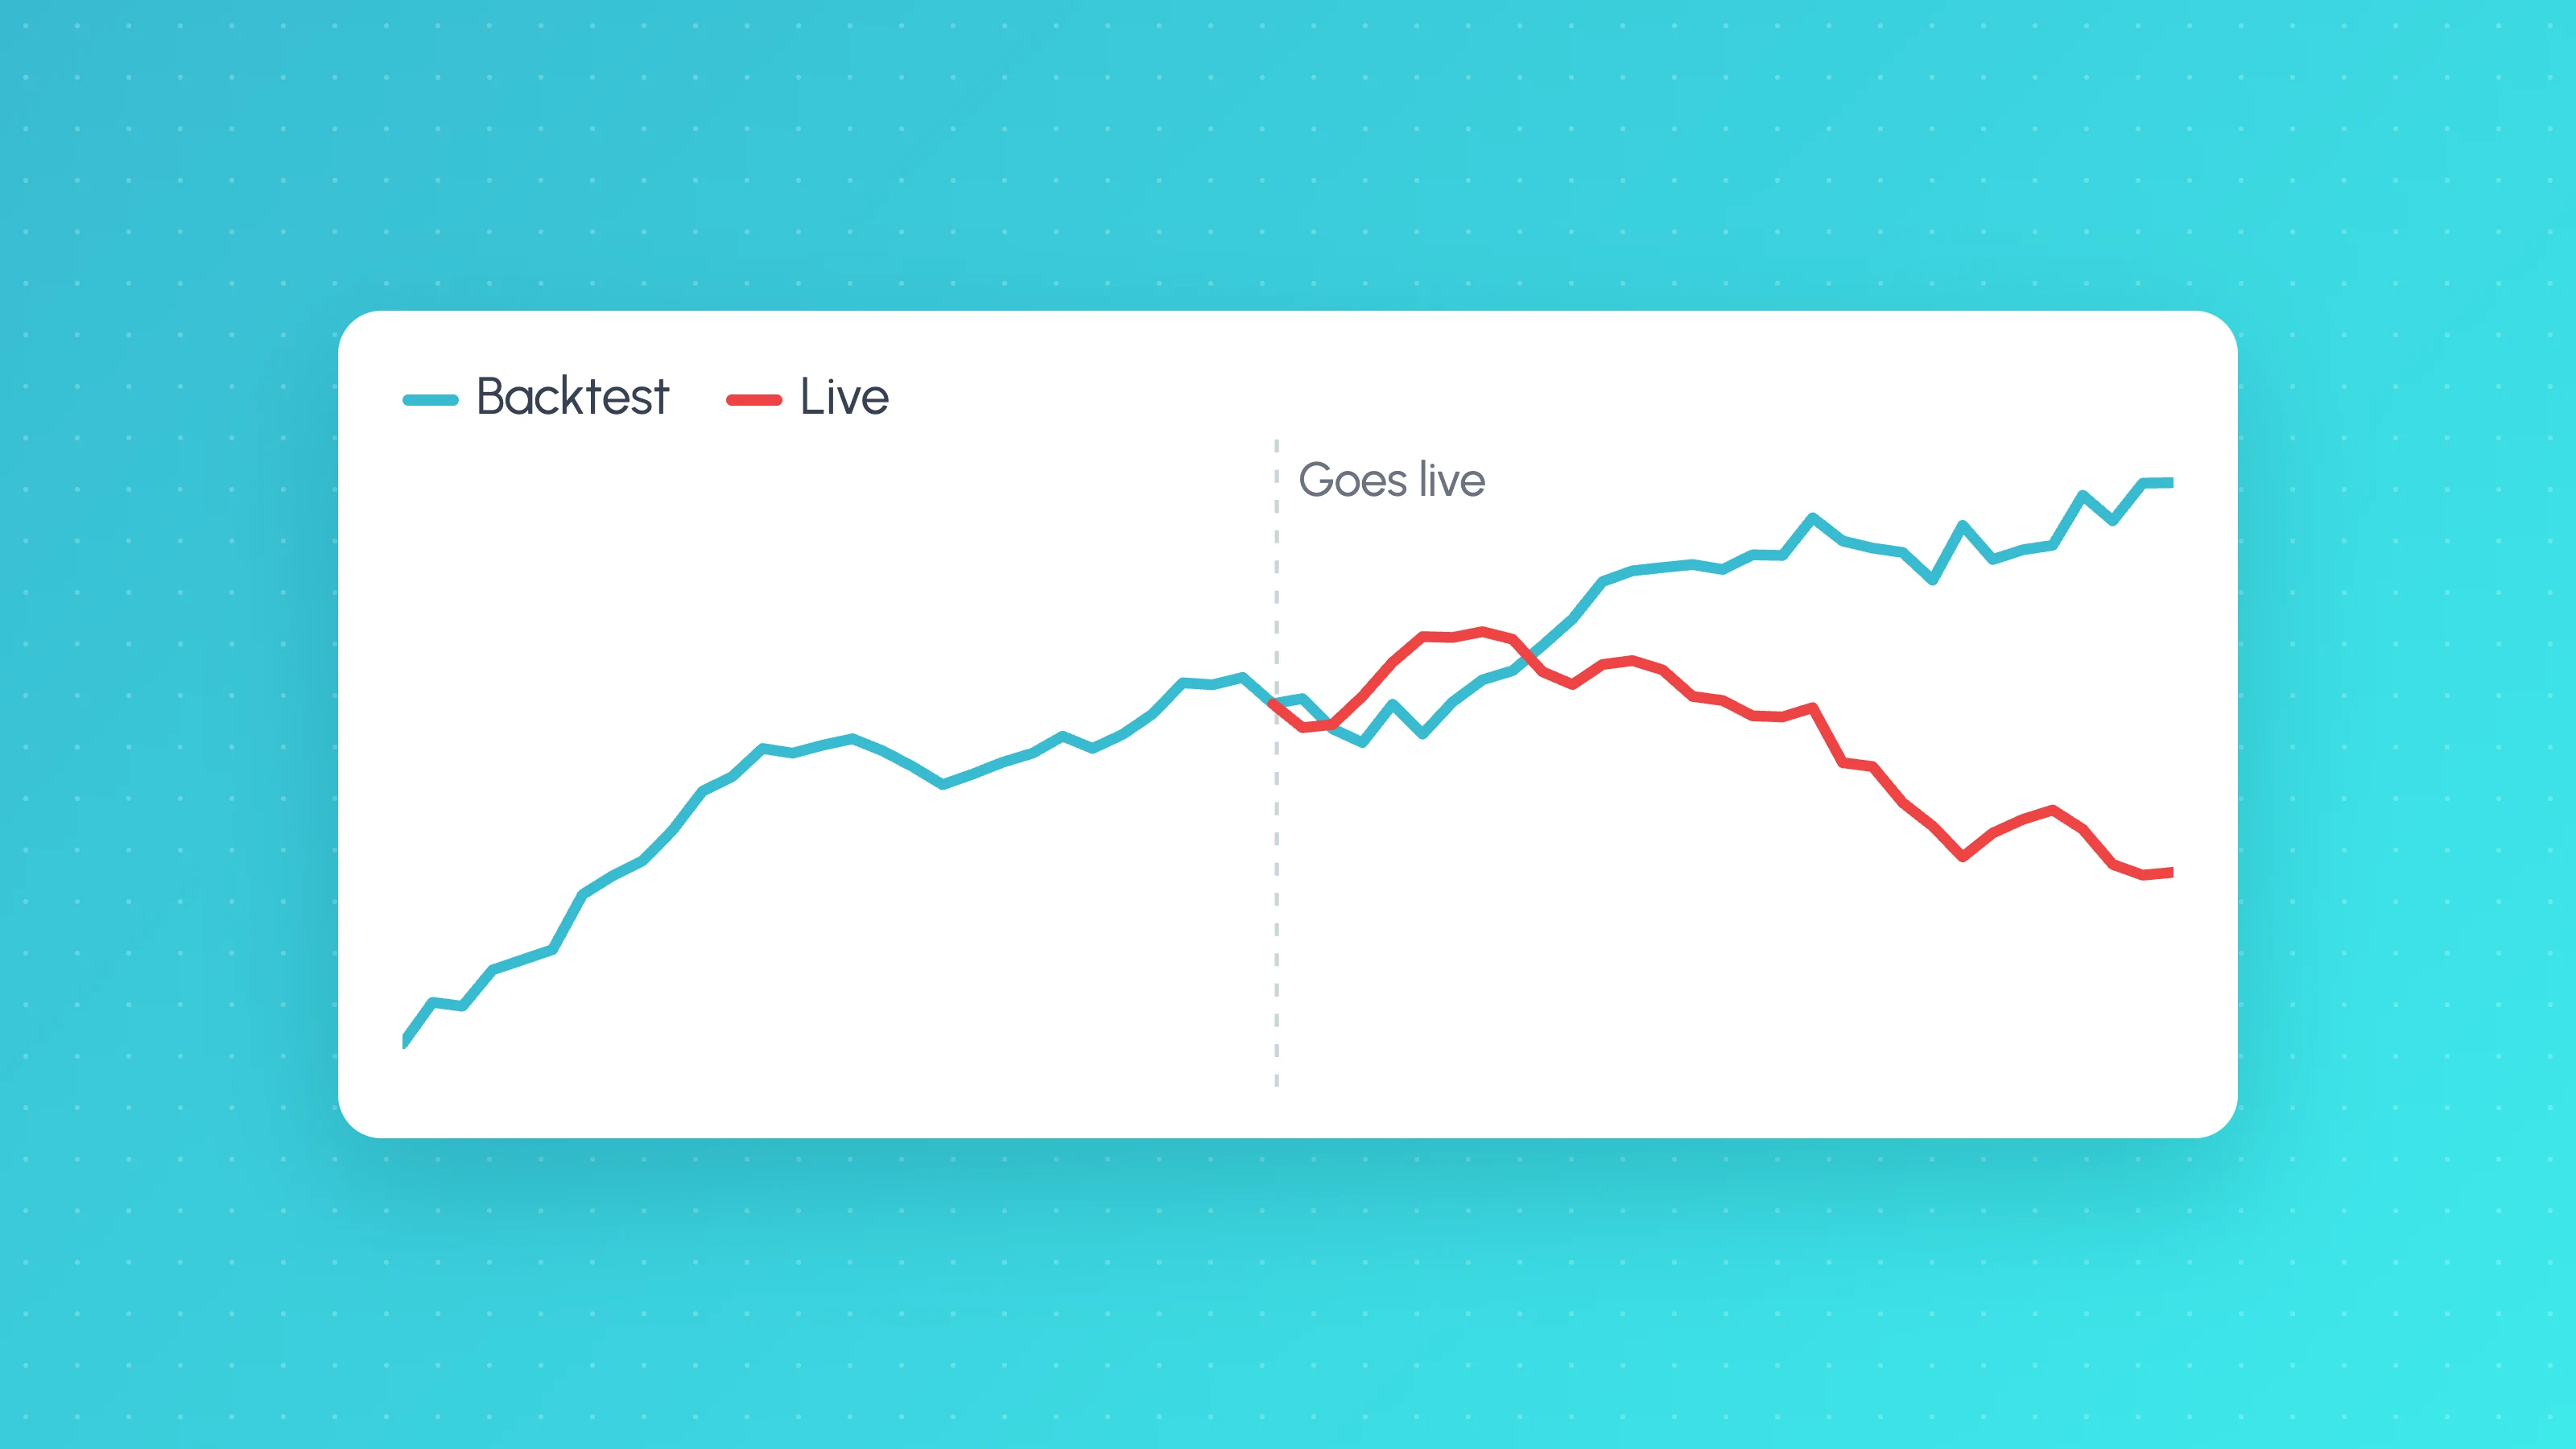
Why Does My Strategy Work in Backtest but Not Live?
Why a TradingView strategy works in backtest but not live: costs, fill assumptions, repainting, gaps, data, alert delays and overfitting, with a check for each.
 TradingView backtests
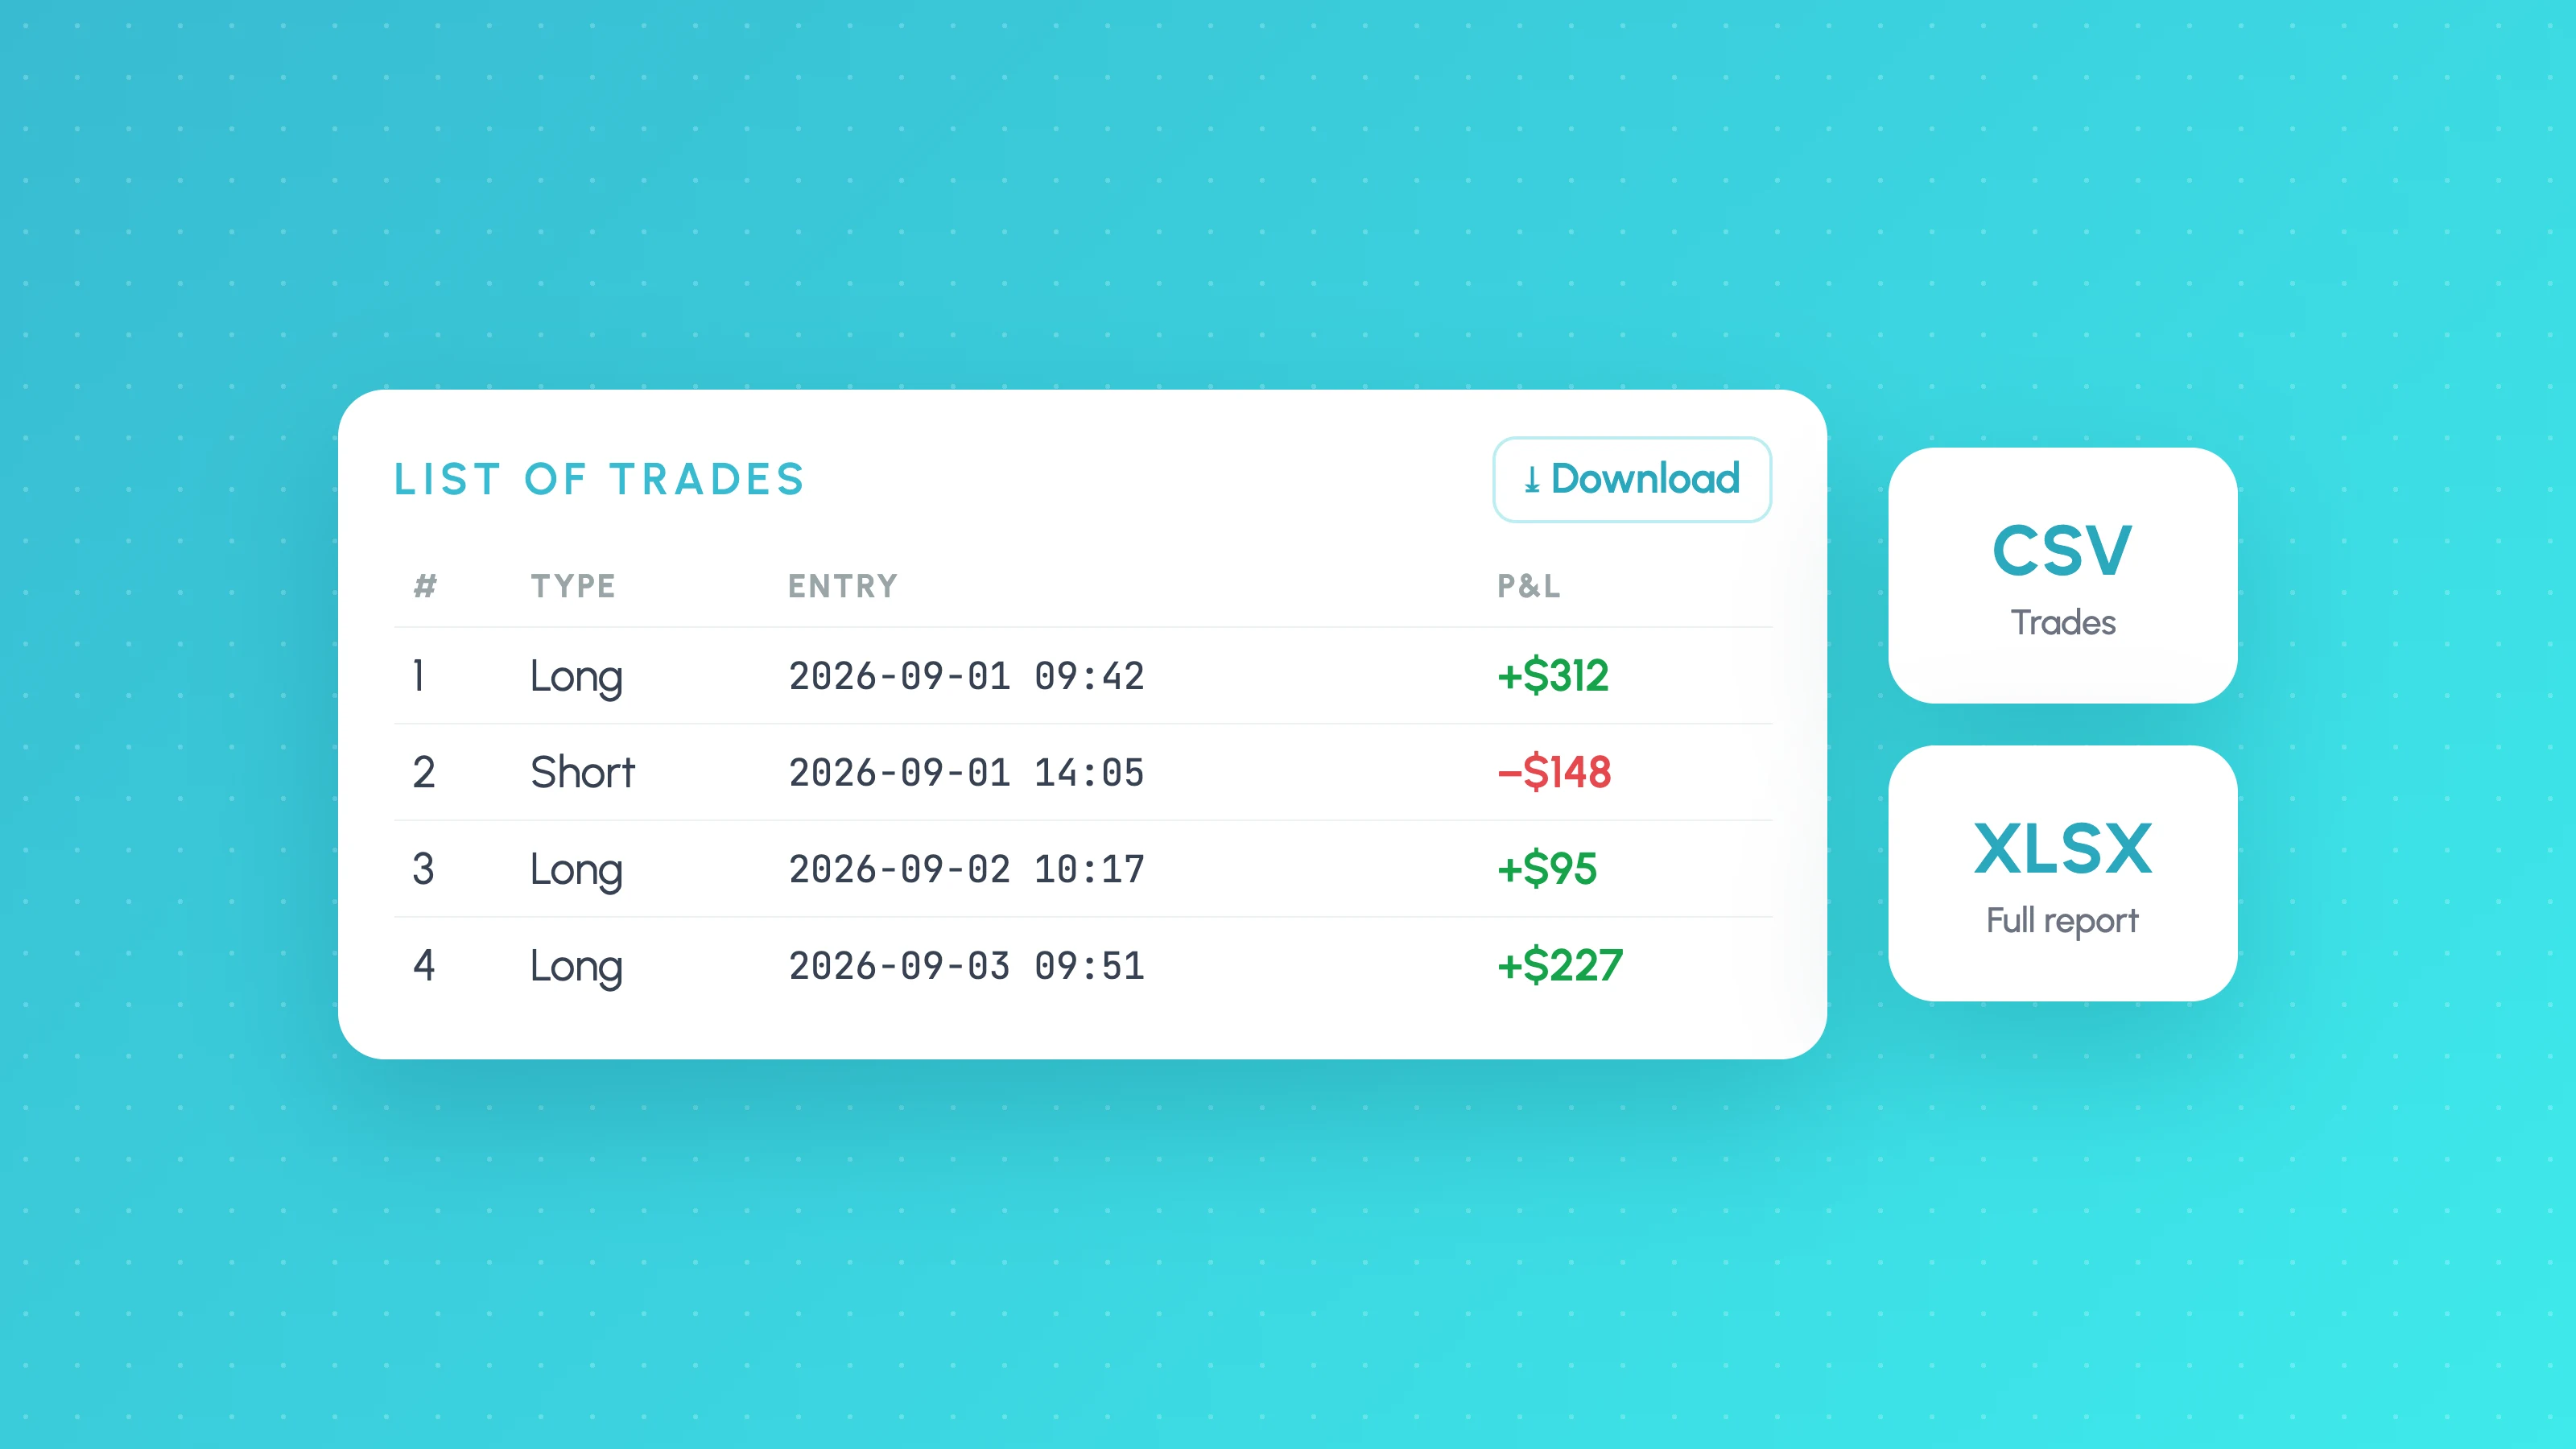
How to Export TradingView Strategy Tester Results (2026)
Export TradingView Strategy Tester results as CSV or XLSX: where the download buttons are, which plan you need, the 9,000 trade limit and what columns mean.
 TradingView backtests
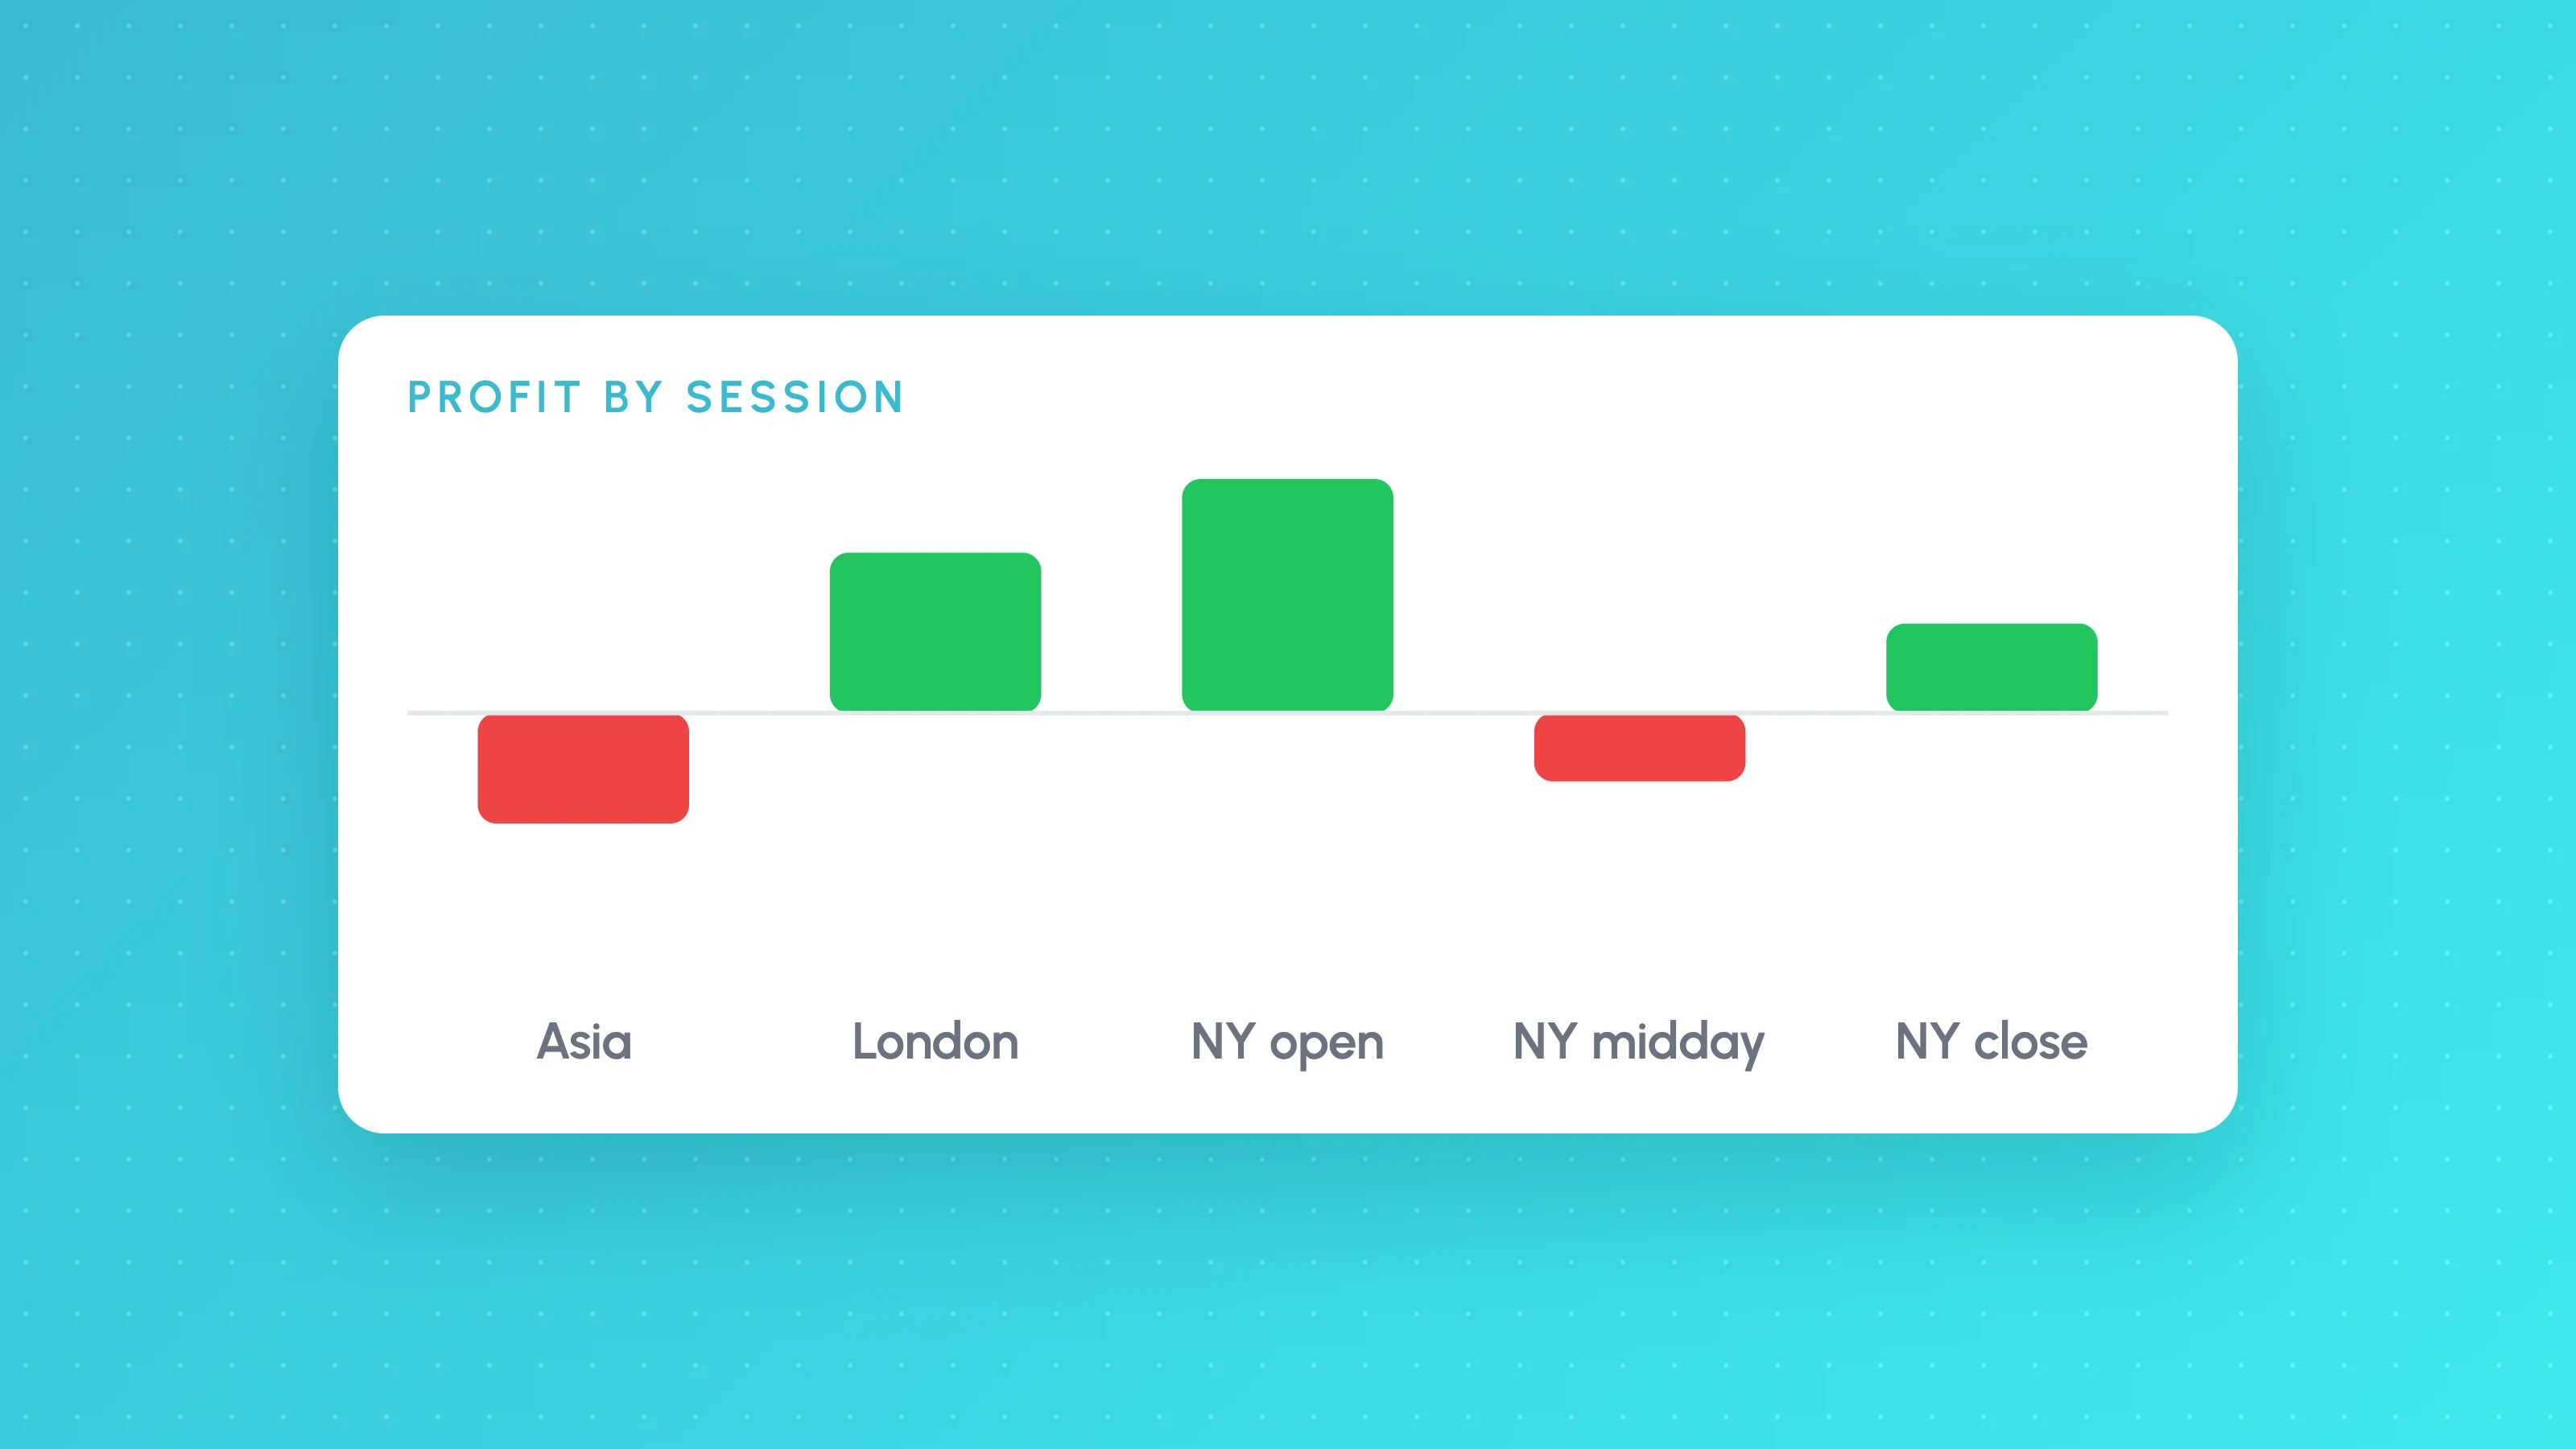
How to Analyse a TradingView Backtest by Session, Weekday and Hour
Analyse a TradingView backtest beyond the summary: split trades by session, weekday, hour, volatility and direction, check sample sizes, then test the rule.