

How to Analyse a TradingView Backtest by Session, Weekday and Hour
Analyse a TradingView backtest beyond the summary: split trades by session, weekday, hour, volatility and direction, check sample sizes, then test the rule.
By Tessera Trades · Updated · 8 min read
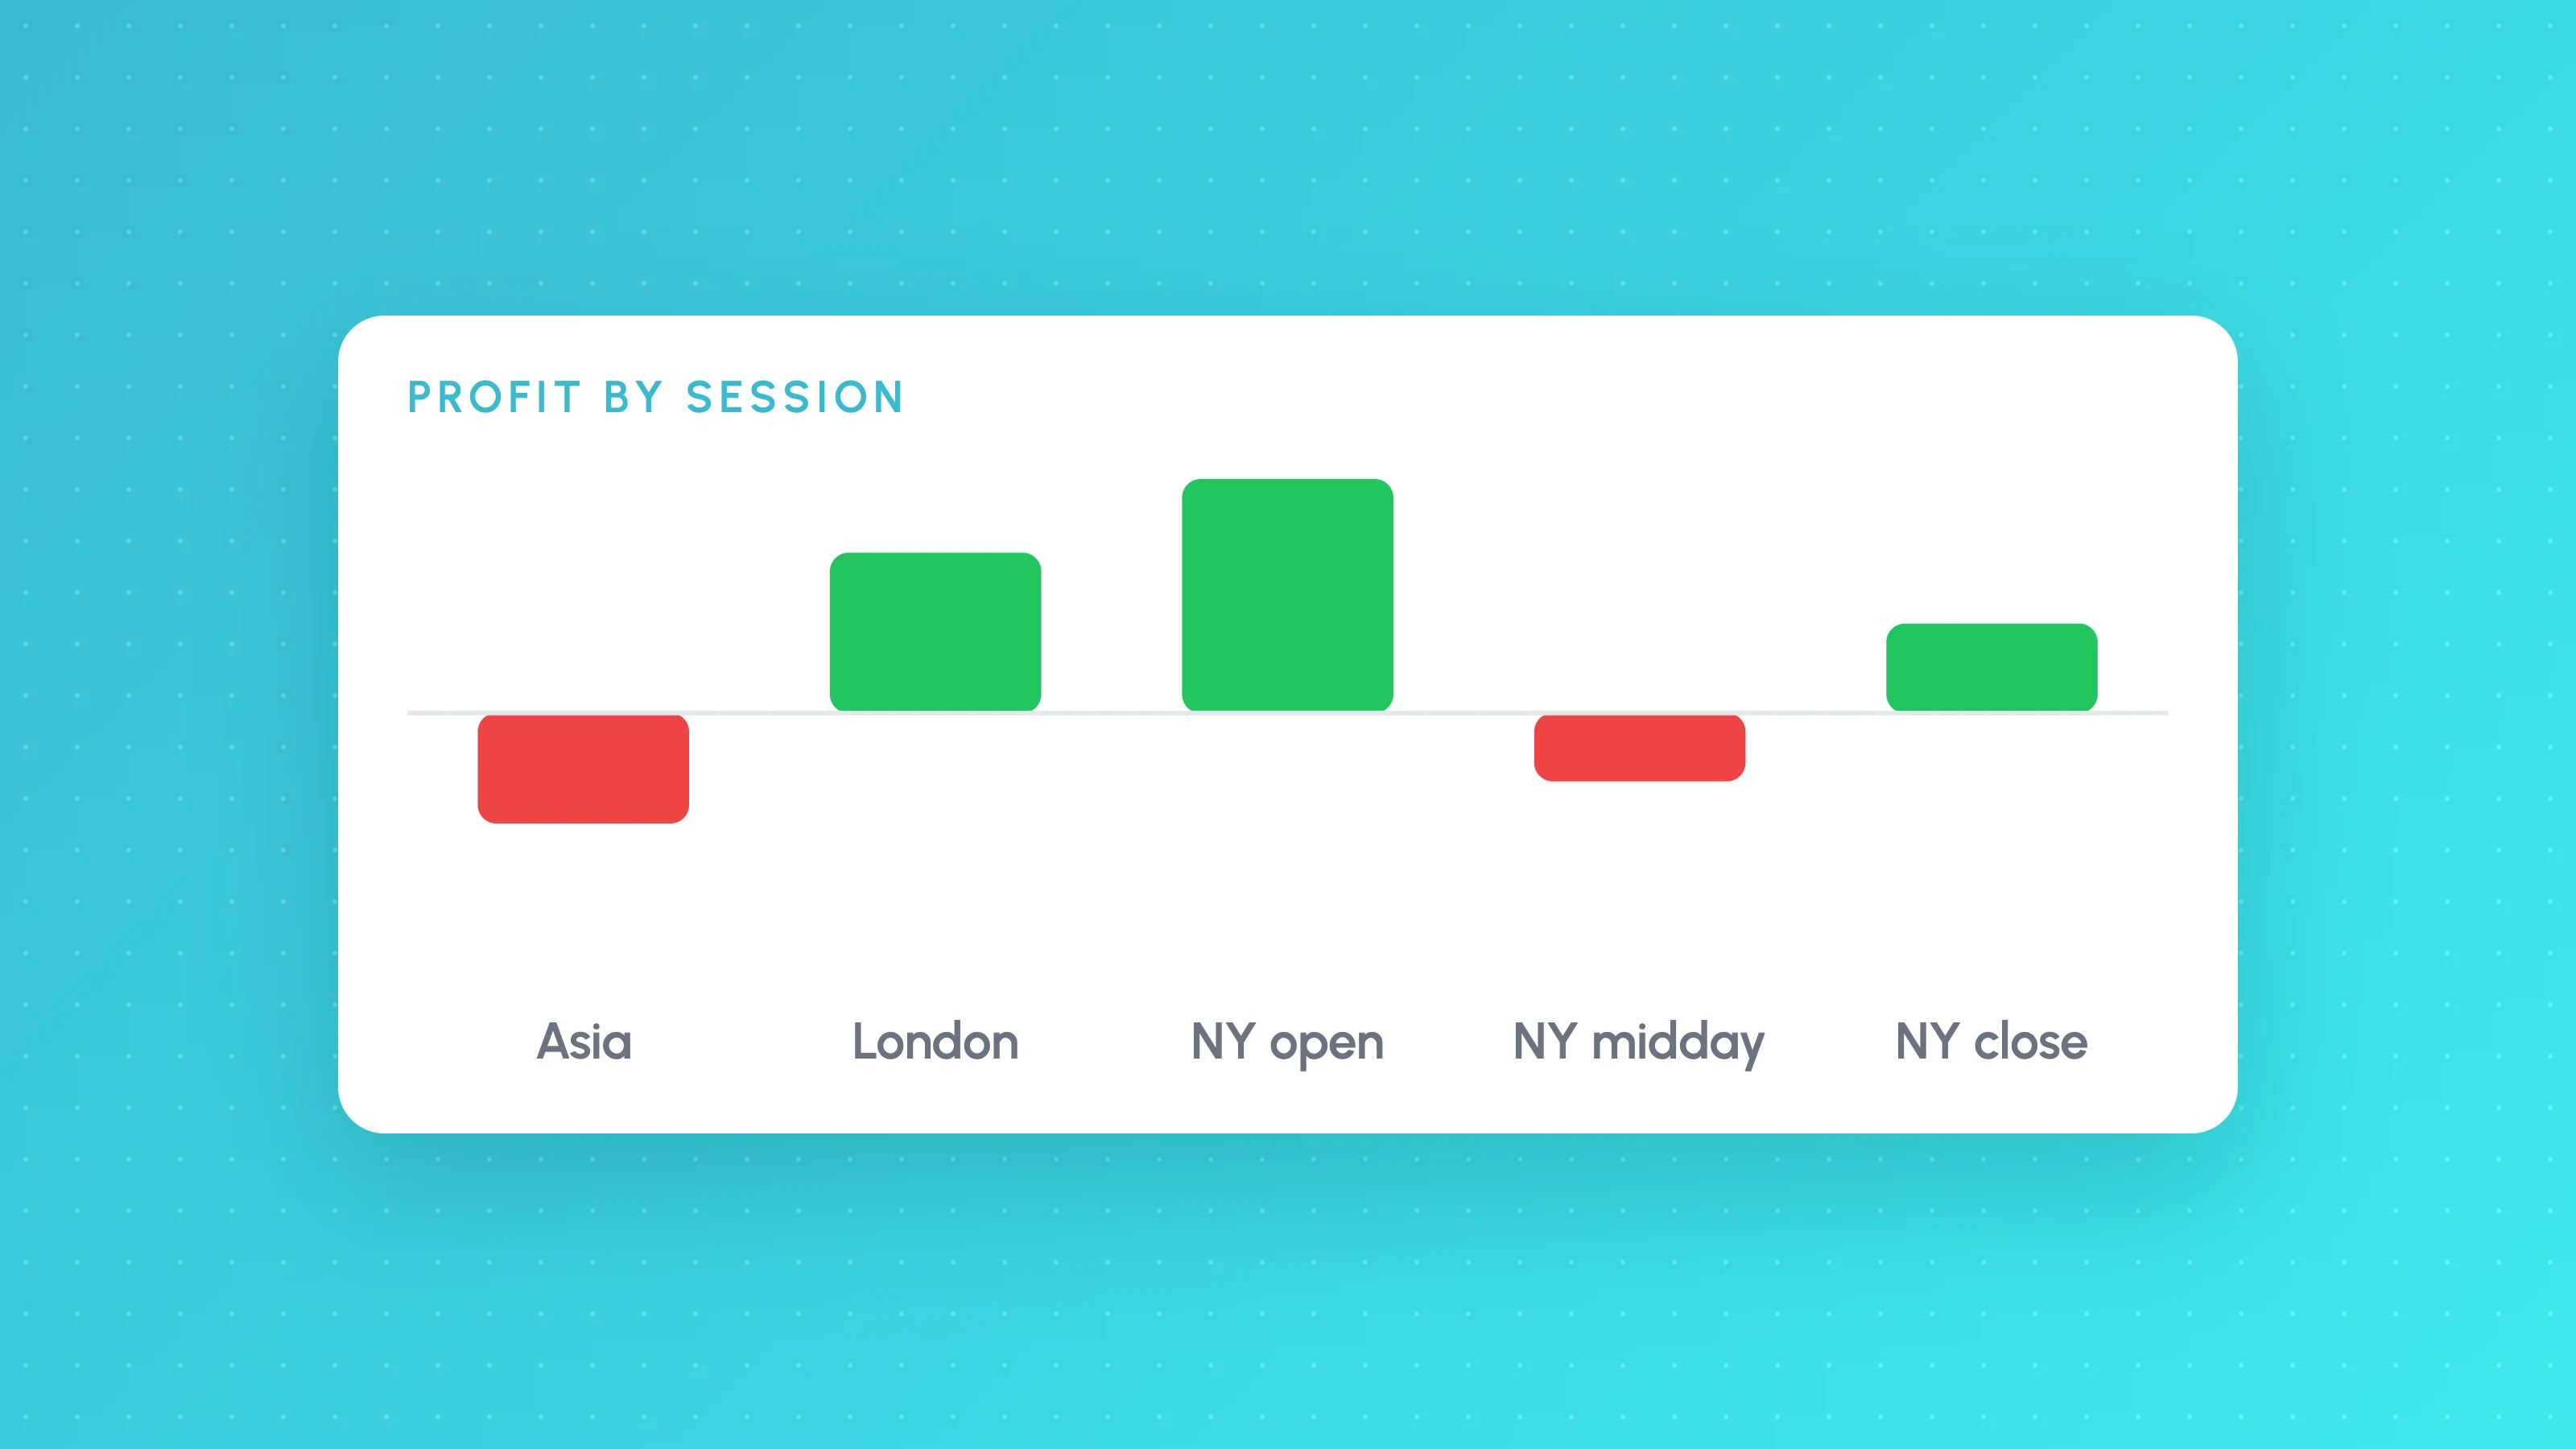
To analyse a TradingView backtest properly, export the List of Trades and group the trades by the conditions they happened in: session, weekday, hour of entry, volatility and direction. Then compare trade count, win rate, average result and profit factor for each group, ignore groups with too few trades, and treat any difference you find as a rule to test, not a conclusion.
The Strategy Tester's summary answers "did this make money overall?". It can't answer "when does it make money, and when does it give it back?", and that second question is where most improvements come from. This guide shows the spreadsheet method step by step, with formulas, and a worked example.
Why the summary hides problems
A profit factor of 1.3 over 240 trades is an average. Behind it there might be a session that earns 1.6 and one that loses steadily, or a strategy whose longs carry the shorts. Averages also hide timing: a strategy can look fine over five years while the last year, in a different volatility regime, loses money.
TradingView's strategy report has improved here. Its help centre describes a Time patterns view in the trades analysis section, a chart of winning and losing trades grouped by entry hour, day of week or month (TradingView Strategy Report: How to start). It's a useful first look. It doesn't group by trading session or volatility, and it doesn't put a sample size warning next to each bar, so for anything you plan to act on you still need the trades themselves.
Step 1: Export the trades and fix the time zone
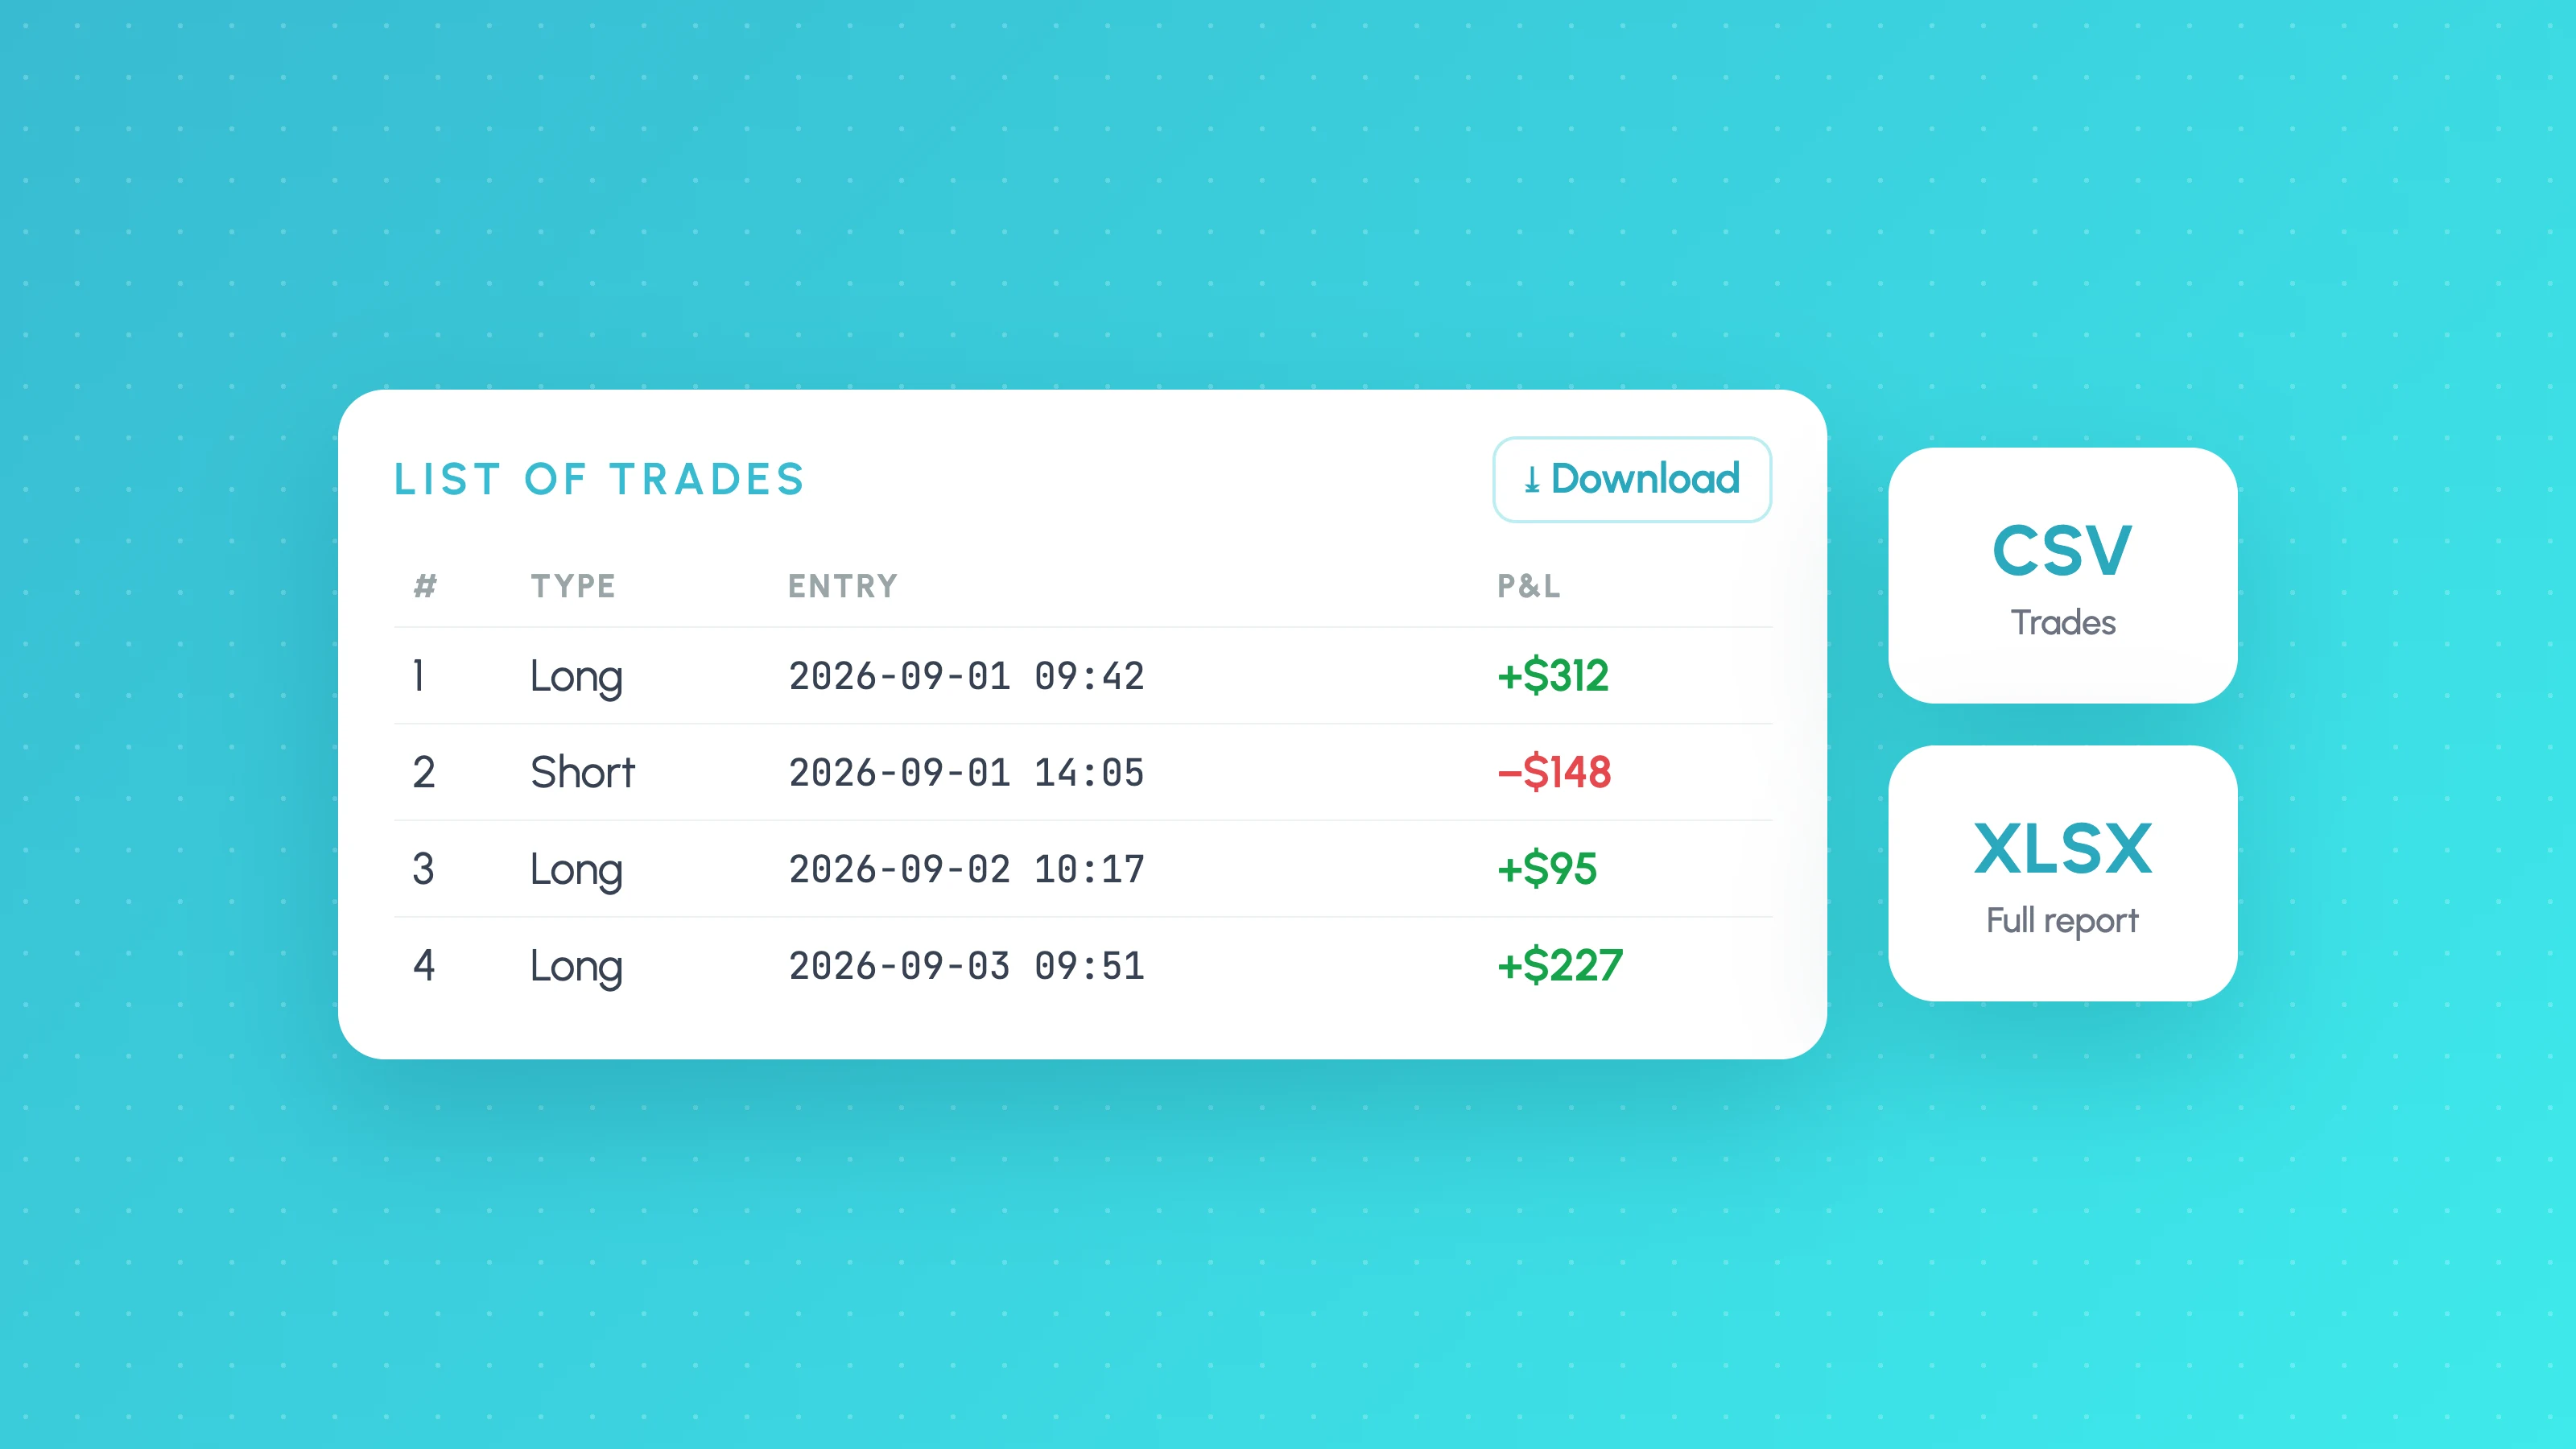
Export the List of Trades as CSV from the Trades tab of the strategy report. How to export TradingView Strategy Tester results covers the buttons, plan requirements and the 9,000 trade limit.
Before exporting, set the chart's time zone deliberately. TradingView shows trade times in the chart's time zone, so the hour you group by depends on that setting. For session analysis, UTC or the exchange's own time zone is easiest. Write down which one you used.
Step 2: Make one row per trade
The export usually lists each trade's entry and exit as separate rows with the same trade number. For analysis you want one row per trade with:
- the entry time (from the entry row), because conditions at entry are what a filter can act on
- the net result (from the exit row), in currency, percent or R
- the direction, long or short
- the Signal text, which holds the order ID or comment
In a spreadsheet, sort by trade number and type, then copy the entry rows to a new sheet and pull the result from the matching exit row with a lookup. In Python, a groupby on trade number does the same.
Step 3: Add the condition columns
Lay the sheet out with the trade number in column A, entry time in B, net result in C and the Signal text in D (if your order IDs don't say long or short, point the direction formula at the Type column instead). Then add these columns, in this order (they work in Excel and Google Sheets):
| Column | Holds | Formula in row 2 | Notes |
|---|---|---|---|
| E | Entry hour | =HOUR(B2) | Hour in the chart time zone you exported in |
| F | Session | =IFS(E2<7,"Asia",E2<12,"London",E2<21,"New York",TRUE,"Late") | Example boundaries in UTC; adjust to your market |
| G | Weekday (1 = Monday) | =WEEKDAY(B2,2) | Use =TEXT(B2,"ddd") for a name |
| H | Direction | =IF(ISNUMBER(SEARCH("long",D2)),"Long","Short") | Reads the Signal text |
| I | Win | =IF(C2>0,1,0) | For win rate |
The session boundaries above are an example for UTC hours. London and New York change their clocks on different dates in spring and autumn, so a fixed UTC boundary is off by an hour for a few weeks a year. For most strategies that is small; for one that trades the open, convert using exchange time instead.
If you exported in a different time zone and need to shift, add the offset as a fraction of a day: =B2+5/24 adds five hours. Remember that offset itself changes with daylight saving.
Step 4: Add a volatility tag in Pine Script
The export doesn't include indicator values, so you can't group by volatility from the CSV alone. The simplest fix is to write the volatility level into the order comment, which appears in the Signal column:
//@version=6
strategy("Volatility tag demo", overlay = true)

atrRank = ta.percentrank(ta.atr(14), 100)
volTag  = atrRank < 33 ? "lowvol" : atrRank < 67 ? "midvol" : "highvol"

longCondition = ta.crossover(ta.ema(close, 20), ta.ema(close, 50))
if longCondition
    strategy.entry("Long", strategy.long, comment = "Long " + volTag)
if ta.crossunder(ta.ema(close, 20), ta.ema(close, 50))
    strategy.close("Long")
ta.percentrank ranks the current ATR against the last 100 bars, so the tag means "low, normal or high volatility for this market recently" rather than an absolute number. In the spreadsheet, =IF(ISNUMBER(SEARCH("highvol",D2)),"High",IF(ISNUMBER(SEARCH("lowvol",D2)),"Low","Mid")) turns it back into a column.
Step 5: Summarise each bucket
Build a small table per condition. With sessions in column F and results in column C:
| Measure | Formula for the London row |
|---|---|
| Trades | =COUNTIFS(F:F,"London") |
| Win rate | =COUNTIFS(F:F,"London",C:C,">0")/COUNTIFS(F:F,"London") |
| Average trade | =AVERAGEIFS(C:C,F:F,"London") |
| Total | =SUMIFS(C:C,F:F,"London") |
| Profit factor | =SUMIFS(C:C,F:F,"London",C:C,">0")/-SUMIFS(C:C,F:F,"London",C:C,"<0") |
A pivot table does the same thing faster once you're comfortable with it. Repeat for weekday, hour, volatility and direction.
Look at the average trade and the trade count first. Win rate on its own misleads: a bucket with a lower win rate can still have the better average trade if its winners are bigger. If you're not sure how these measures relate, trading expectancy explains it.
Step 6: Respect the minimum trades per bucket
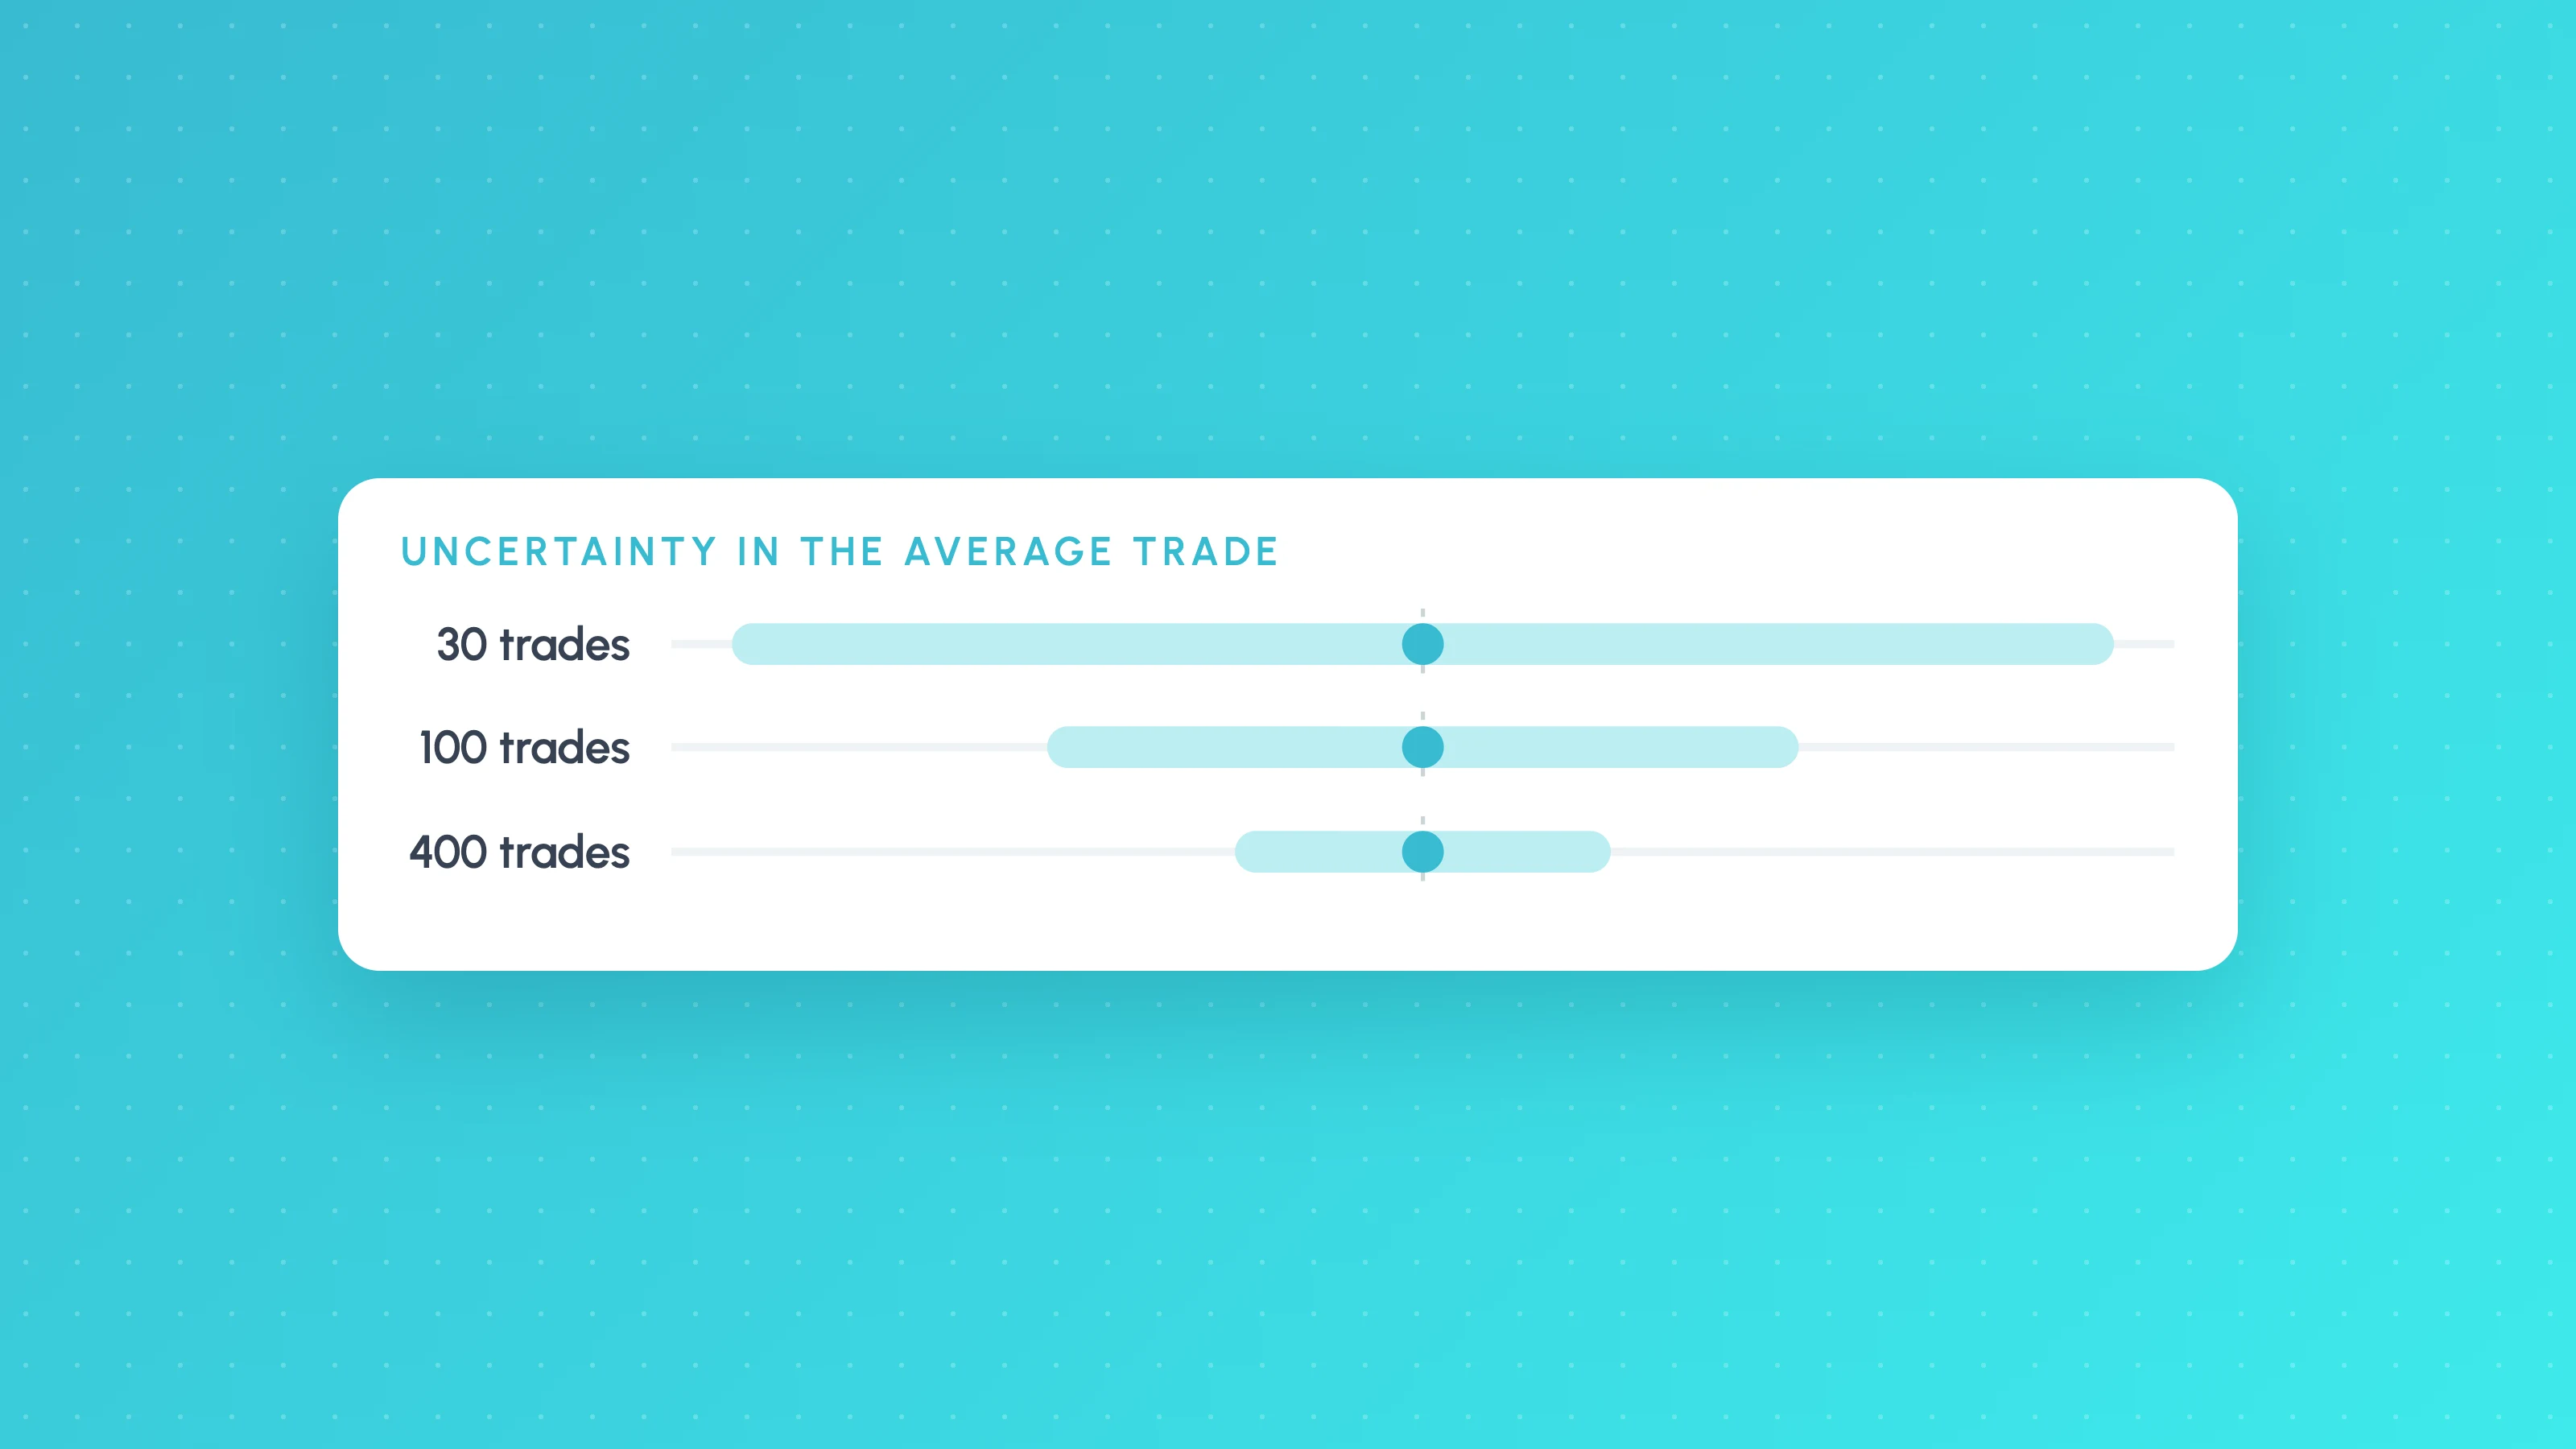
Splitting 240 trades five ways leaves about 48 per bucket. Splitting by hour can leave single digits. Small buckets produce large differences by chance alone.
Two working rules:
- Don't act on a bucket with fewer than about 30 trades. Treat it as "no information".
- For buckets above that, check whether the difference is bigger than noise. A quick test is the t-statistic of the bucket's average trade: average divided by (standard deviation divided by the square root of the trade count). In a spreadsheet:
=AVERAGEIFS(C:C,F:F,"Asia")/(STDEV.S(FILTER(C:C,F:F="Asia"))/SQRT(COUNTIFS(F:F,"Asia"))). Values between about -2 and +2 are within normal noise.
The more buckets you look at, the more likely one of them looks extreme by luck. How many trades a backtest needs covers the maths and the multiple-testing adjustment.
Worked example
This is an illustrative example, not a real strategy. Say an intraday strategy has 240 trades, measured in R (multiples of the initial risk), with a total of +31.5R, an average of about +0.13R per trade, and a per-trade standard deviation of about 1.3R. Split by session:
| Session (UTC) | Trades | Wins | Average trade | Total |
|---|---|---|---|---|
| Asia | 60 | 21 | -0.15R | -9.0R |
| London | 90 | 41 | +0.20R | +18.0R |
| New York | 90 | 42 | +0.25R | +22.5R |
| All | 240 | 104 | +0.13R | +31.5R |
The obvious idea is "stop trading Asia". Without those 60 trades the strategy has 180 trades totalling +40.5R, an average of +0.225R.
Now check the evidence. The Asia bucket's t-statistic is -0.15 / (1.3 / √60) = -0.15 / 0.168 ≈ -0.89. That's well inside normal noise. On its own it doesn't prove Asia is bad. What would strengthen the case:
- A reason. Perhaps the strategy is a breakout system and Asian hours on this market have narrower ranges.
- Consistency over time. Split the Asia trades by year. If Asia lost in four of five years, that matters more than the total.
- Agreement from neighbouring cuts. If the losing hours are the quietest hours and the low-volatility bucket also loses, the findings support each other.
- An out-of-sample check. If you formed the idea on 2019 to 2023, see whether Asia also lagged in 2024 to 2026.
Turning a finding into a testable rule
Write the rule precisely: "No new entries between 00:00 and 07:00 UTC". Then test it in this order:
- Apply it to the trades you already have and compare both versions side by side: total, average trade, drawdown and trade count.
- Check it on a period you didn't use to find it.
- Add it to the Pine Script and re-run the Strategy Tester. Filtering trades after the fact assumes the remaining trades stay the same; in a real backtest, skipping one trade can change when the next one happens.
A session filter in Pine Script v6 looks like this. Keep the exit outside the filter so open positions can still close:
//@version=6
strategy("Session filter demo", overlay = true)

inSession = not na(time(timeframe.period, "0700-2100", "UTC"))
fastMa = ta.ema(close, 20)
slowMa = ta.ema(close, 50)

if inSession and ta.crossover(fastMa, slowMa)
    strategy.entry("Long", strategy.long)
if ta.crossunder(fastMa, slowMa)
    strategy.close("Long")
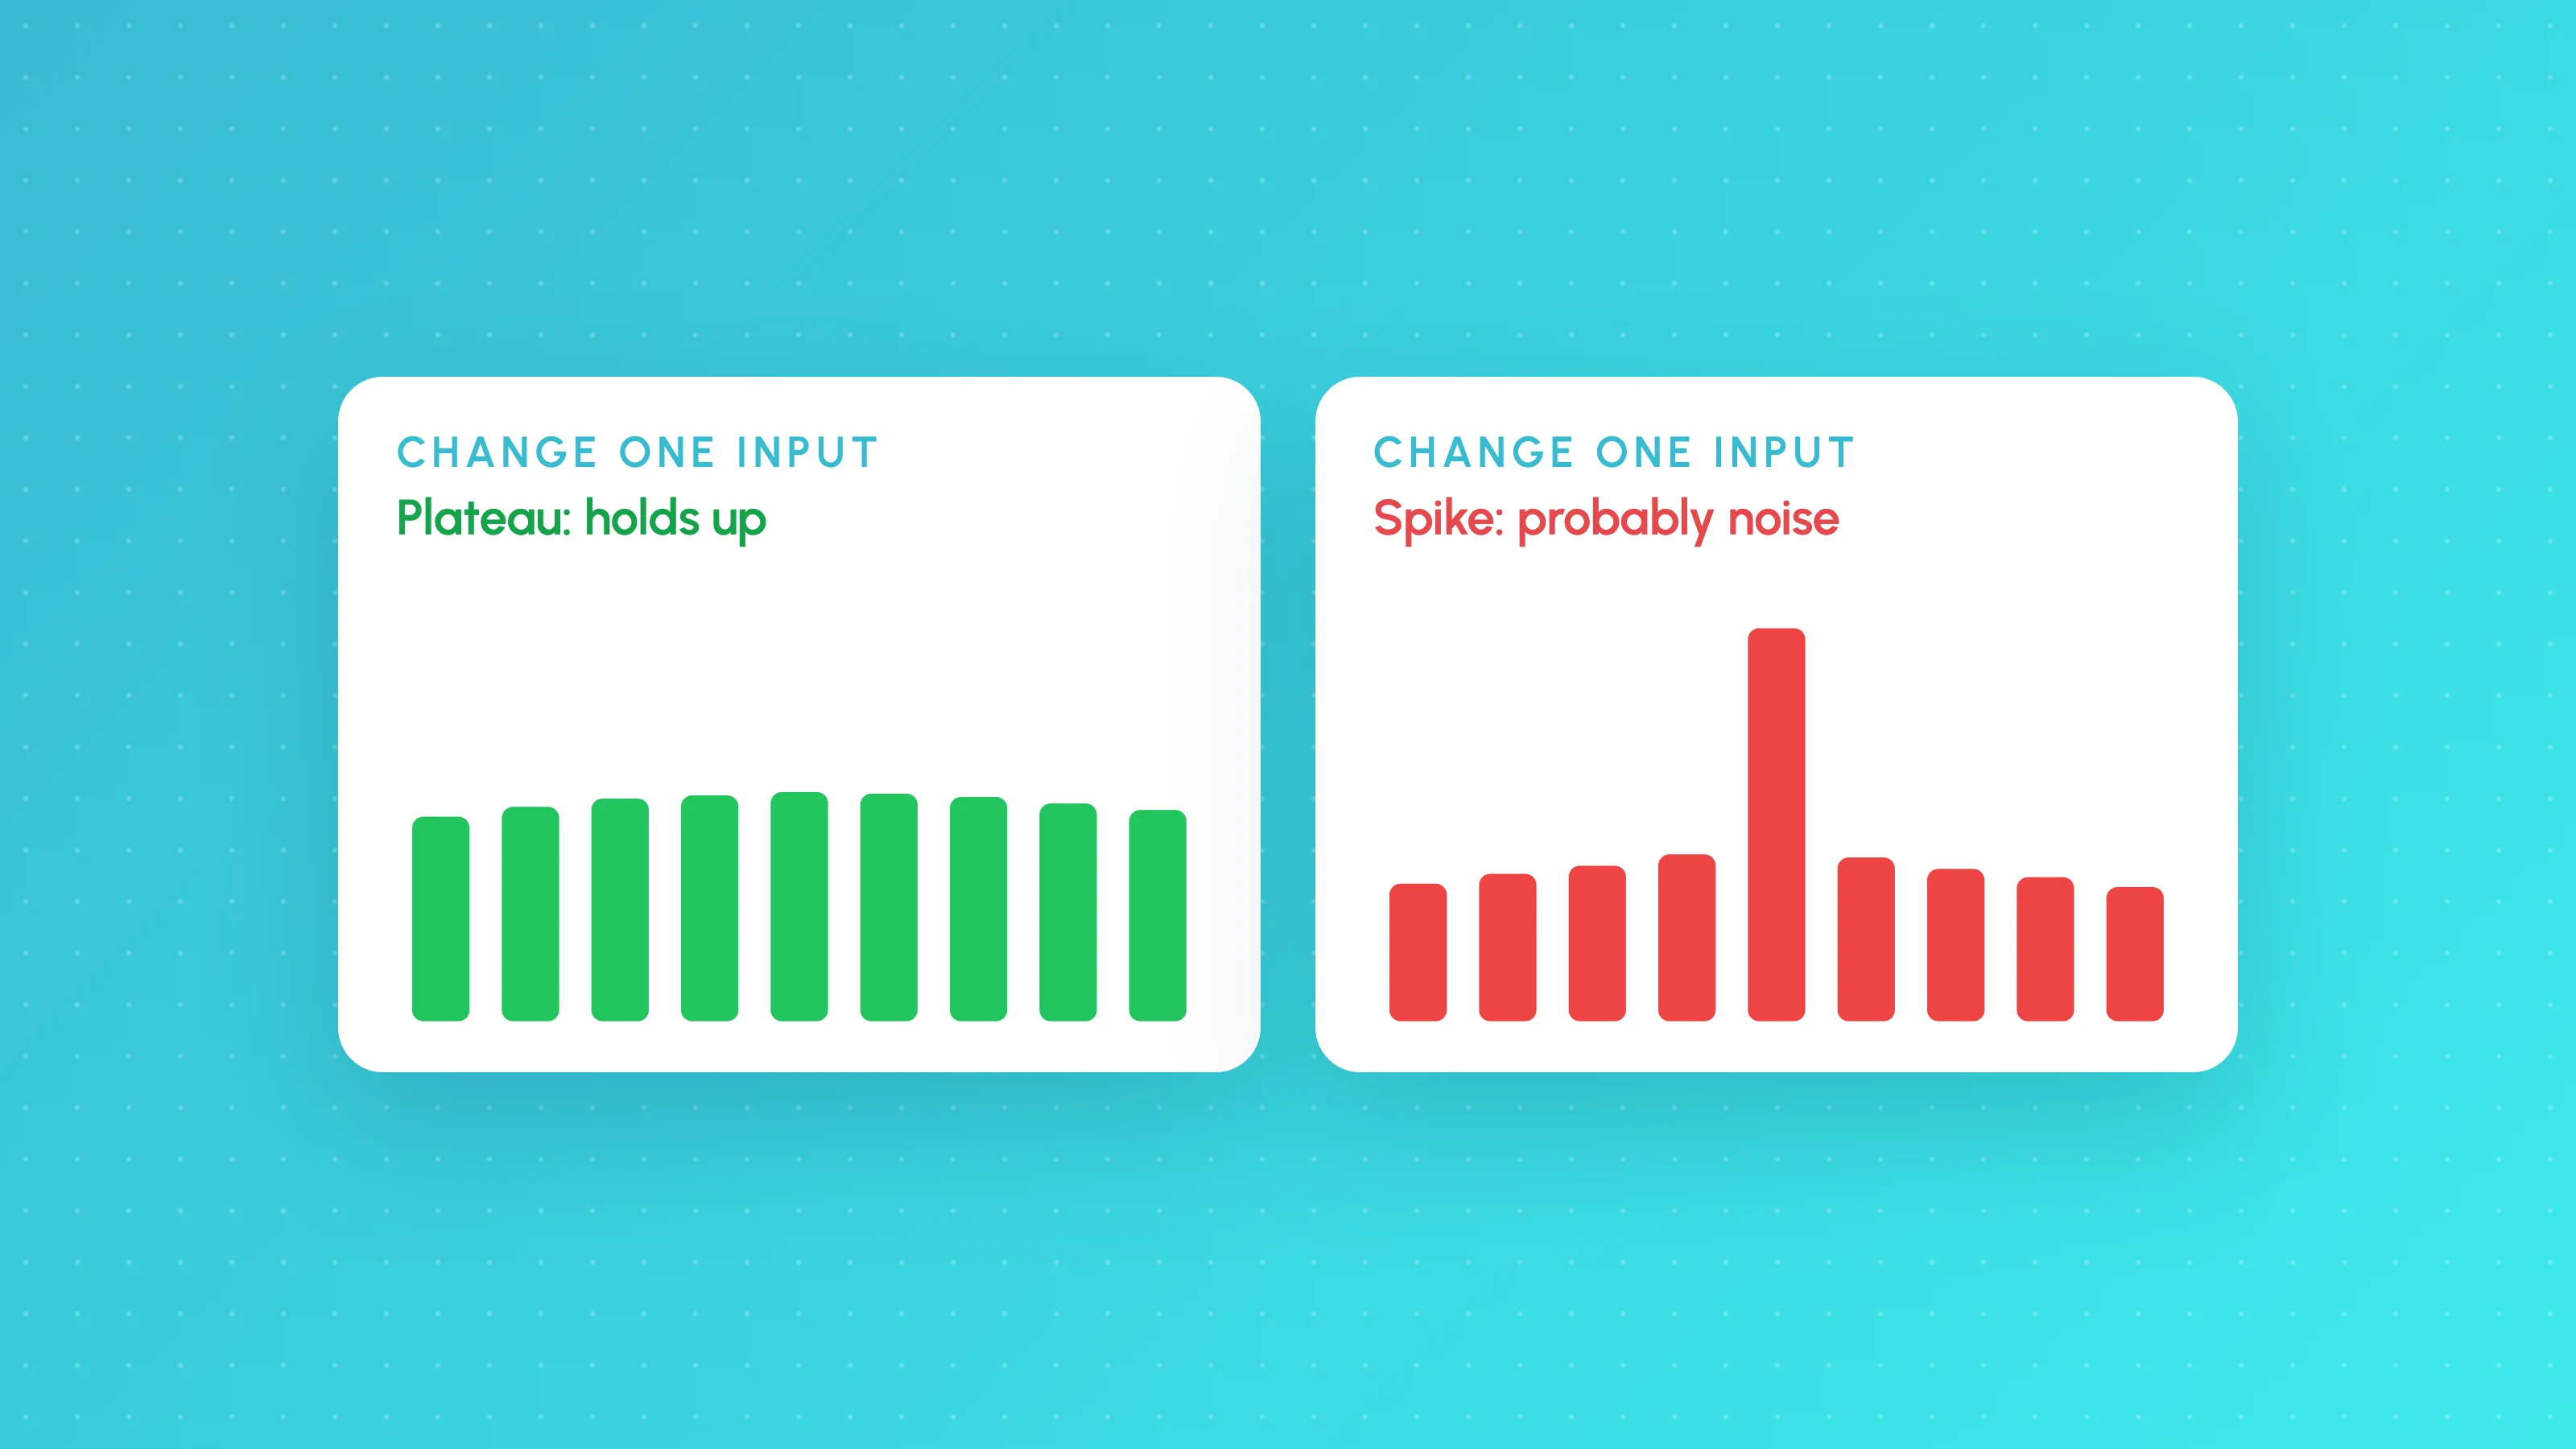
Each filter you add is another chance to overfit. Is my backtest overfit? has the checks to run before you keep one.
Doing it without a spreadsheet
The spreadsheet method works, but it's slow to repeat for every strategy version. Tessera's reports take a TradingView Strategy Tester export and break the trades down by session, weekday, time of day, volatility and symbol, with the trade count shown behind every slice, so a six-trade bucket can't pass for a finding.
Try it on your own export
Upload a List of Trades CSV to the free Entry Analysis report and see your strategy split by market condition. No card needed.
If TradingView's Strategy Tester is not enough on its own, our guide to TradingView alternatives for backtesting compares nine platforms.
Frequently asked questions
- How do I see TradingView backtest results by day of week?
- TradingView's strategy report has a Time patterns view that groups winning and losing trades by entry hour, day of week or month. For average trade, profit factor and trade count per weekday, export the List of Trades and add a column with
=WEEKDAY(entry_time,2), then summarise with COUNTIFS and AVERAGEIFS. - How do I analyse TradingView backtest results by session?
- Export the trades with the chart set to UTC or the exchange time zone, take the hour of each entry, and assign each trade to a session with an IFS formula. Then compare trade count, average trade and profit factor per session, ignoring sessions with fewer than about 30 trades.
- What time zone does the TradingView trade export use?
- The List of Trades shows times in the chart's time zone, so set the chart's time zone before you export. Getting this wrong shifts every trade into the wrong hour and session.
- How many trades do I need in each bucket?
- As a working minimum, about 30 trades per bucket before you read anything into it, and more if the difference you're looking at is small. Check the bucket's t-statistic and remember that the more buckets you compare, the more likely one looks extreme by chance.
- Should I remove a losing session from my strategy?
- Only after testing it. Check that the losing session has enough trades, loses consistently across years, has a plausible reason, and still lags on data you didn't use to find it. Then add the filter in Pine Script and re-run the backtest rather than just deleting trades.
Keep reading
 TradingView backtests
How to Export TradingView Strategy Tester Results (2026)
Export TradingView Strategy Tester results as CSV or XLSX: where the download buttons are, which plan you need, the 9,000 trade limit and what columns mean.
 TradingView backtests
How Many Trades Do You Need for a Valid Backtest?
How many trades a backtest needs: rules of thumb, the t-statistic formula with a worked example, a table by edge size, per-bucket minimums and multiple testing.
 TradingView backtests
Is My Backtest Overfit? A Practical Checklist for Traders
How to tell if a backtest is overfit: too-good metrics, thin samples, fragile inputs, useless filters, out-of-sample and walk-forward tests, plus a checklist.