
By session
London / New York
24 trades · 29% win rate · −$45

Pick an account, a date range, and a symbol. Tessera reads what the market was actually doing at every entry, shows you which conditions pay and which leak, and lets you test a fix against the trades you already took.
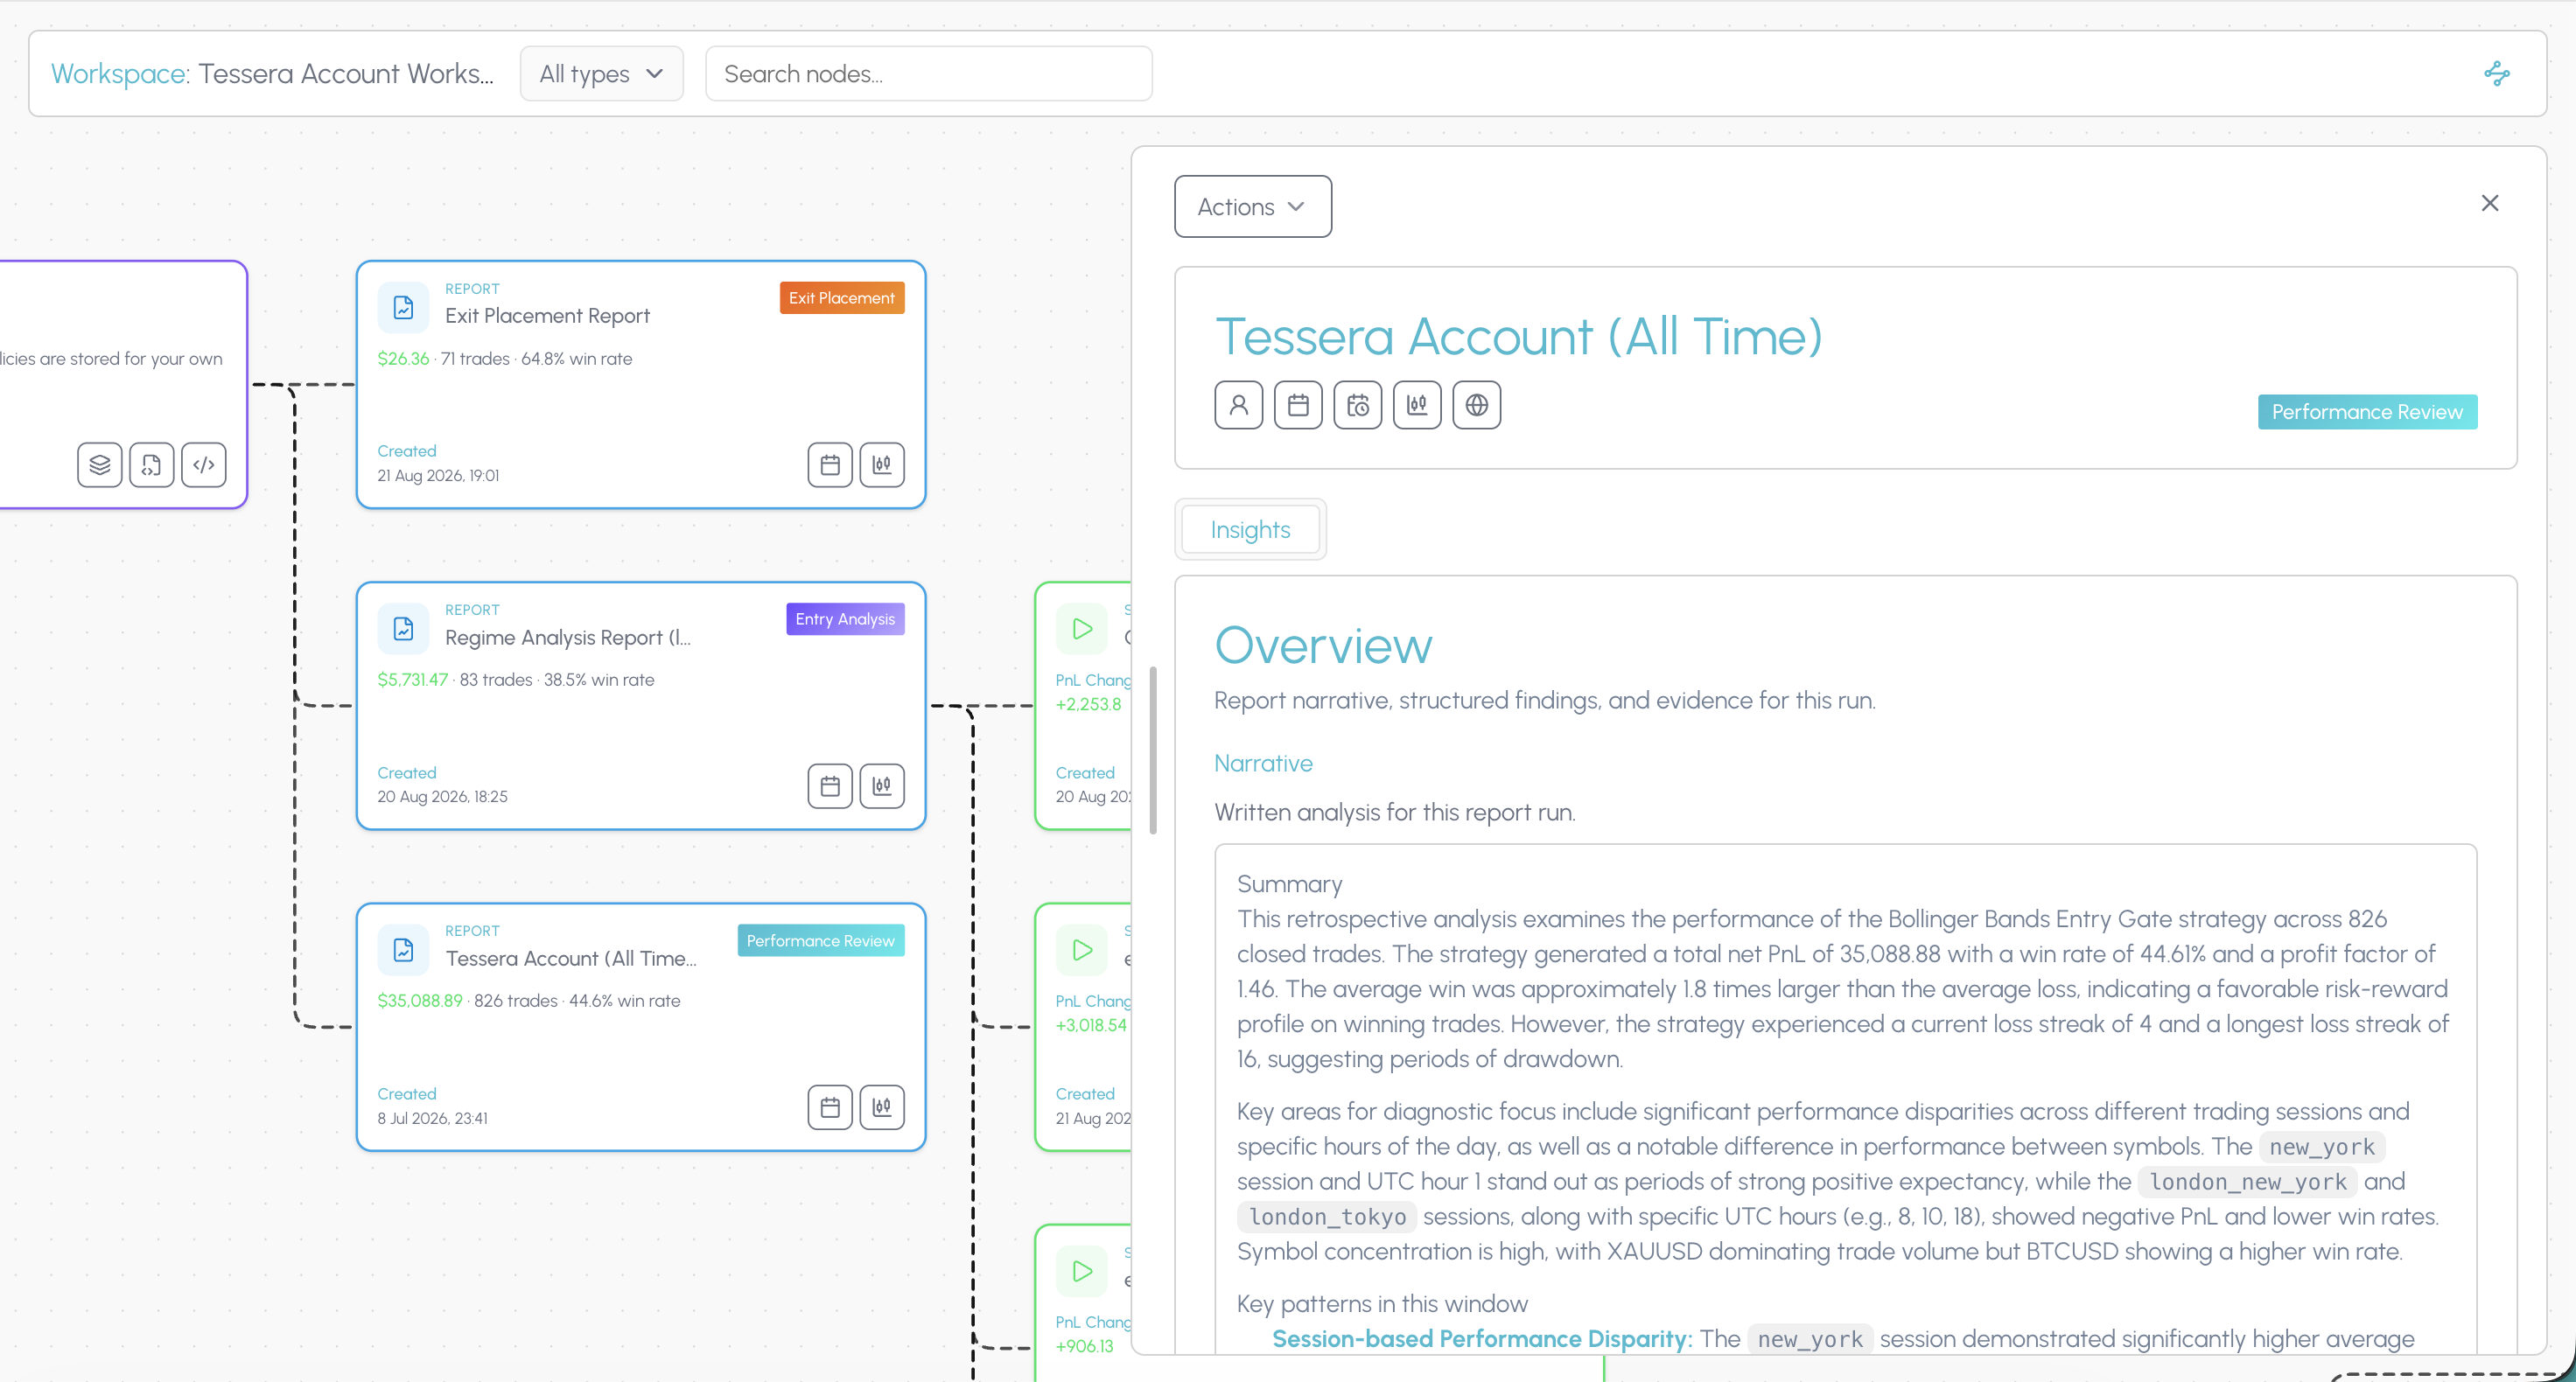
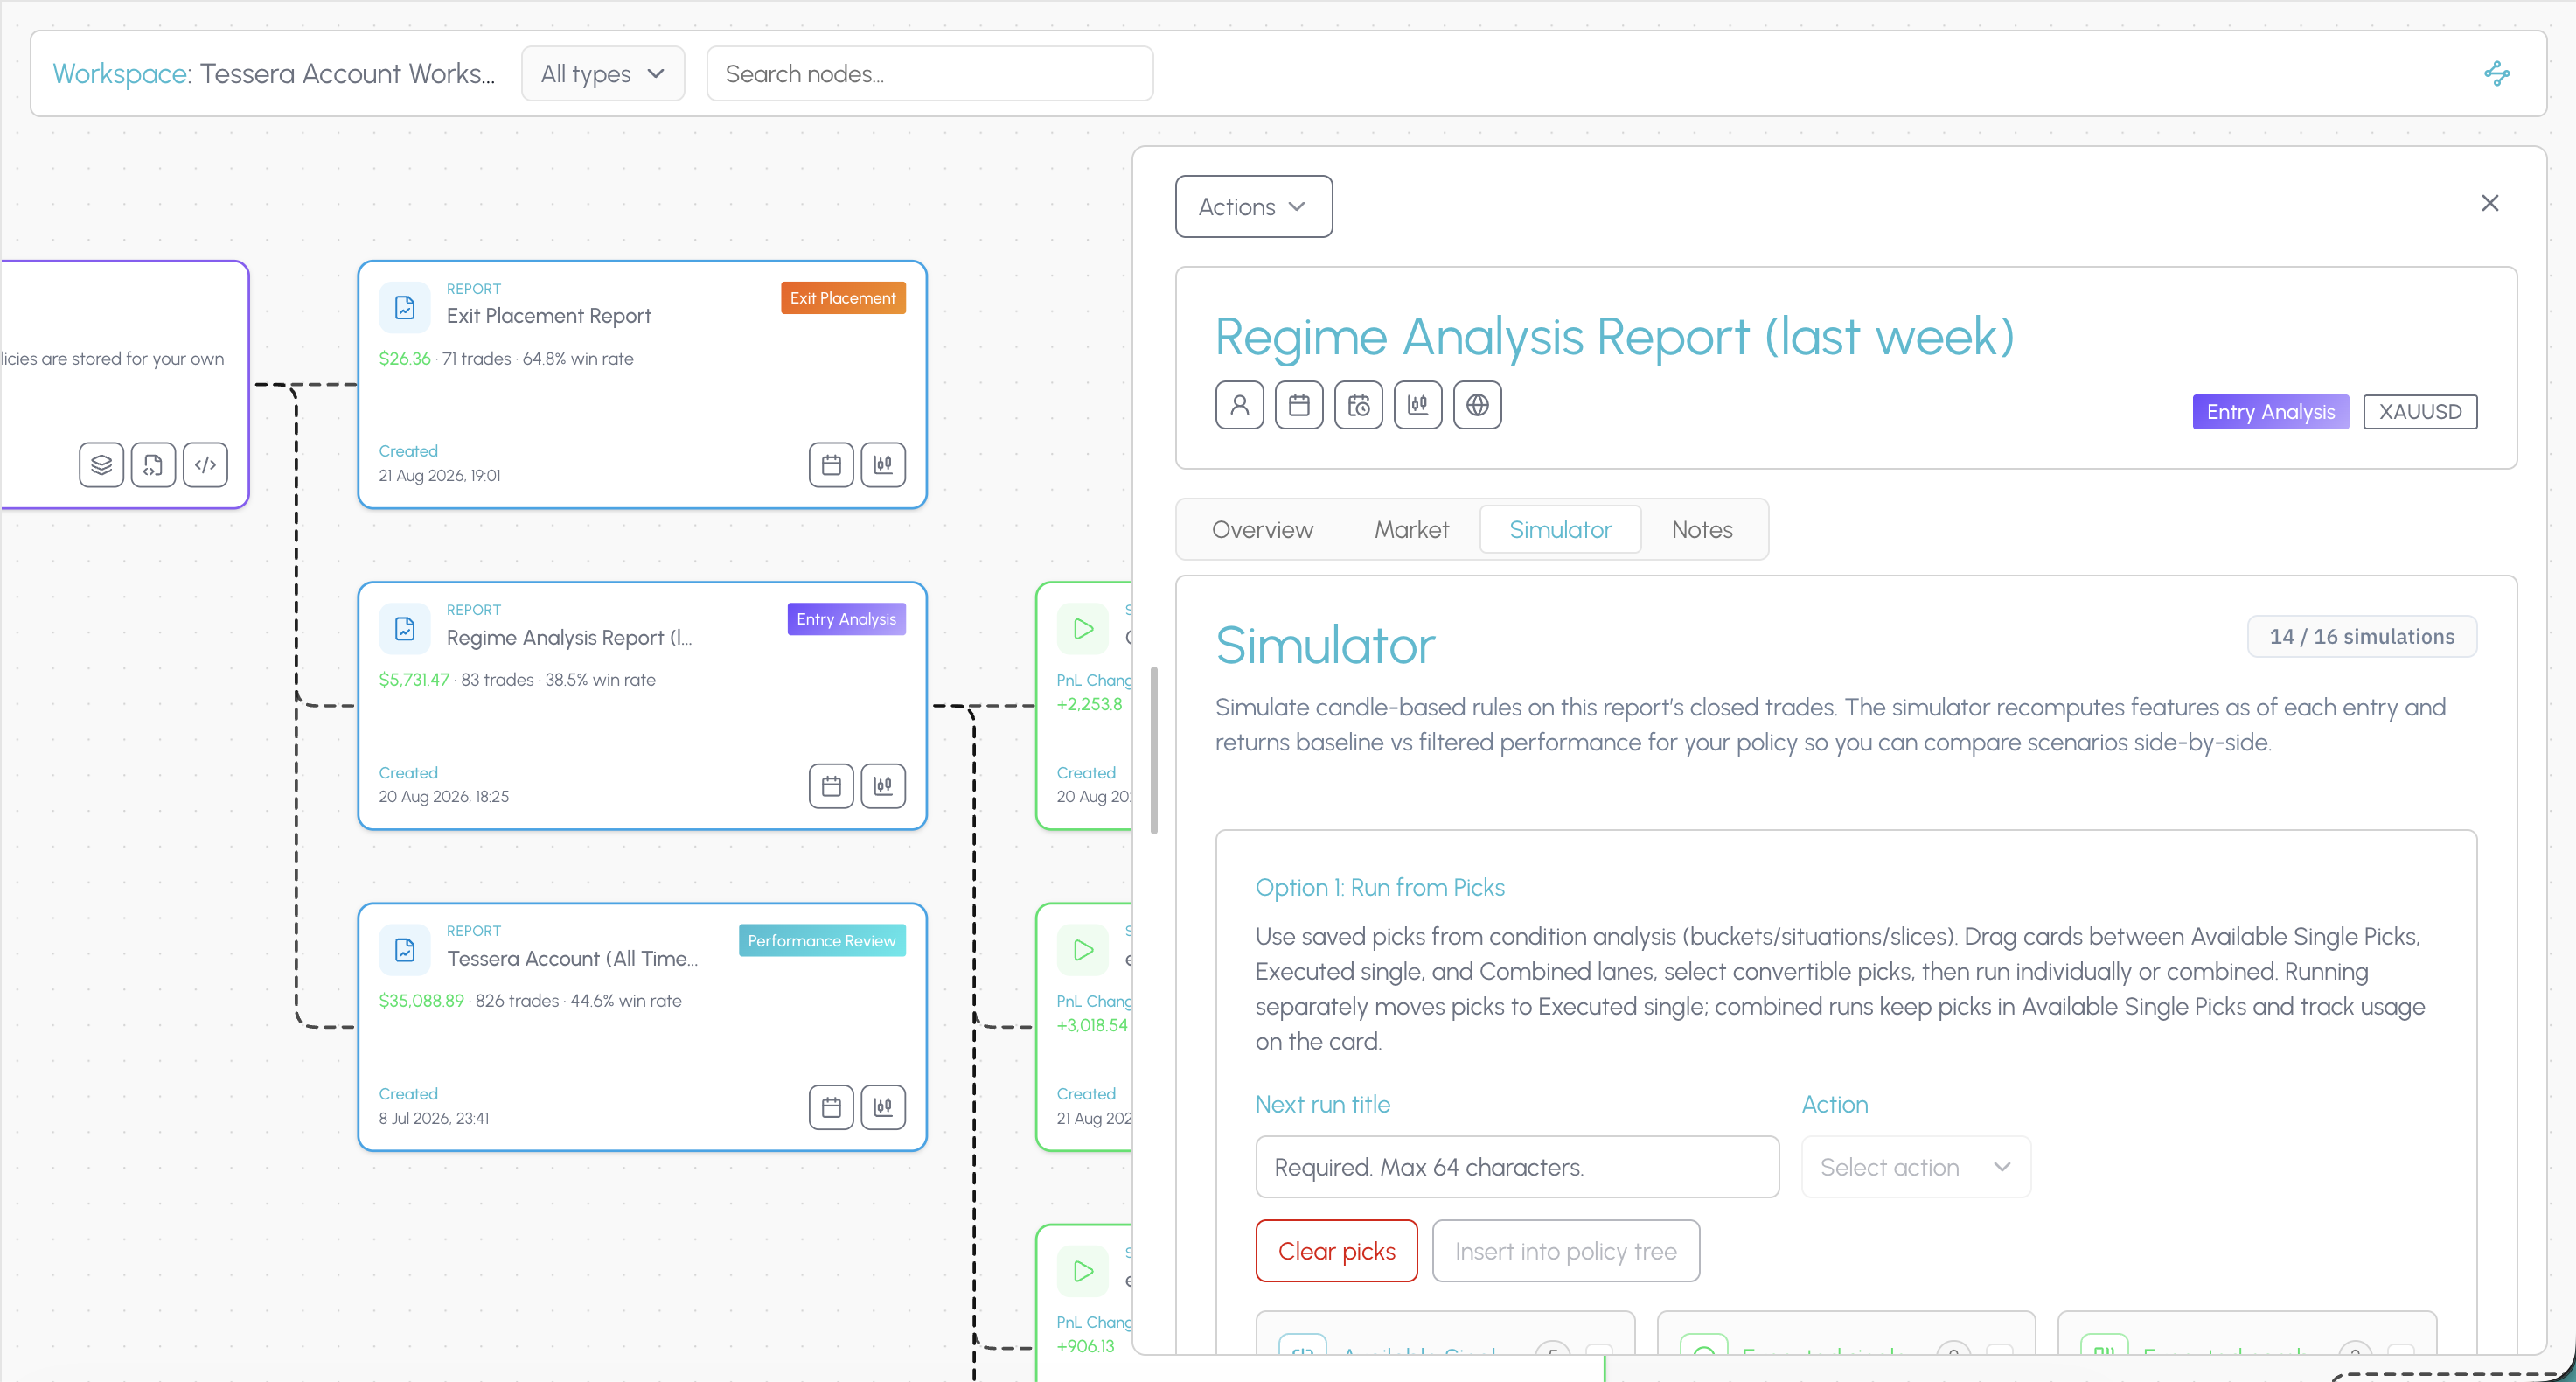
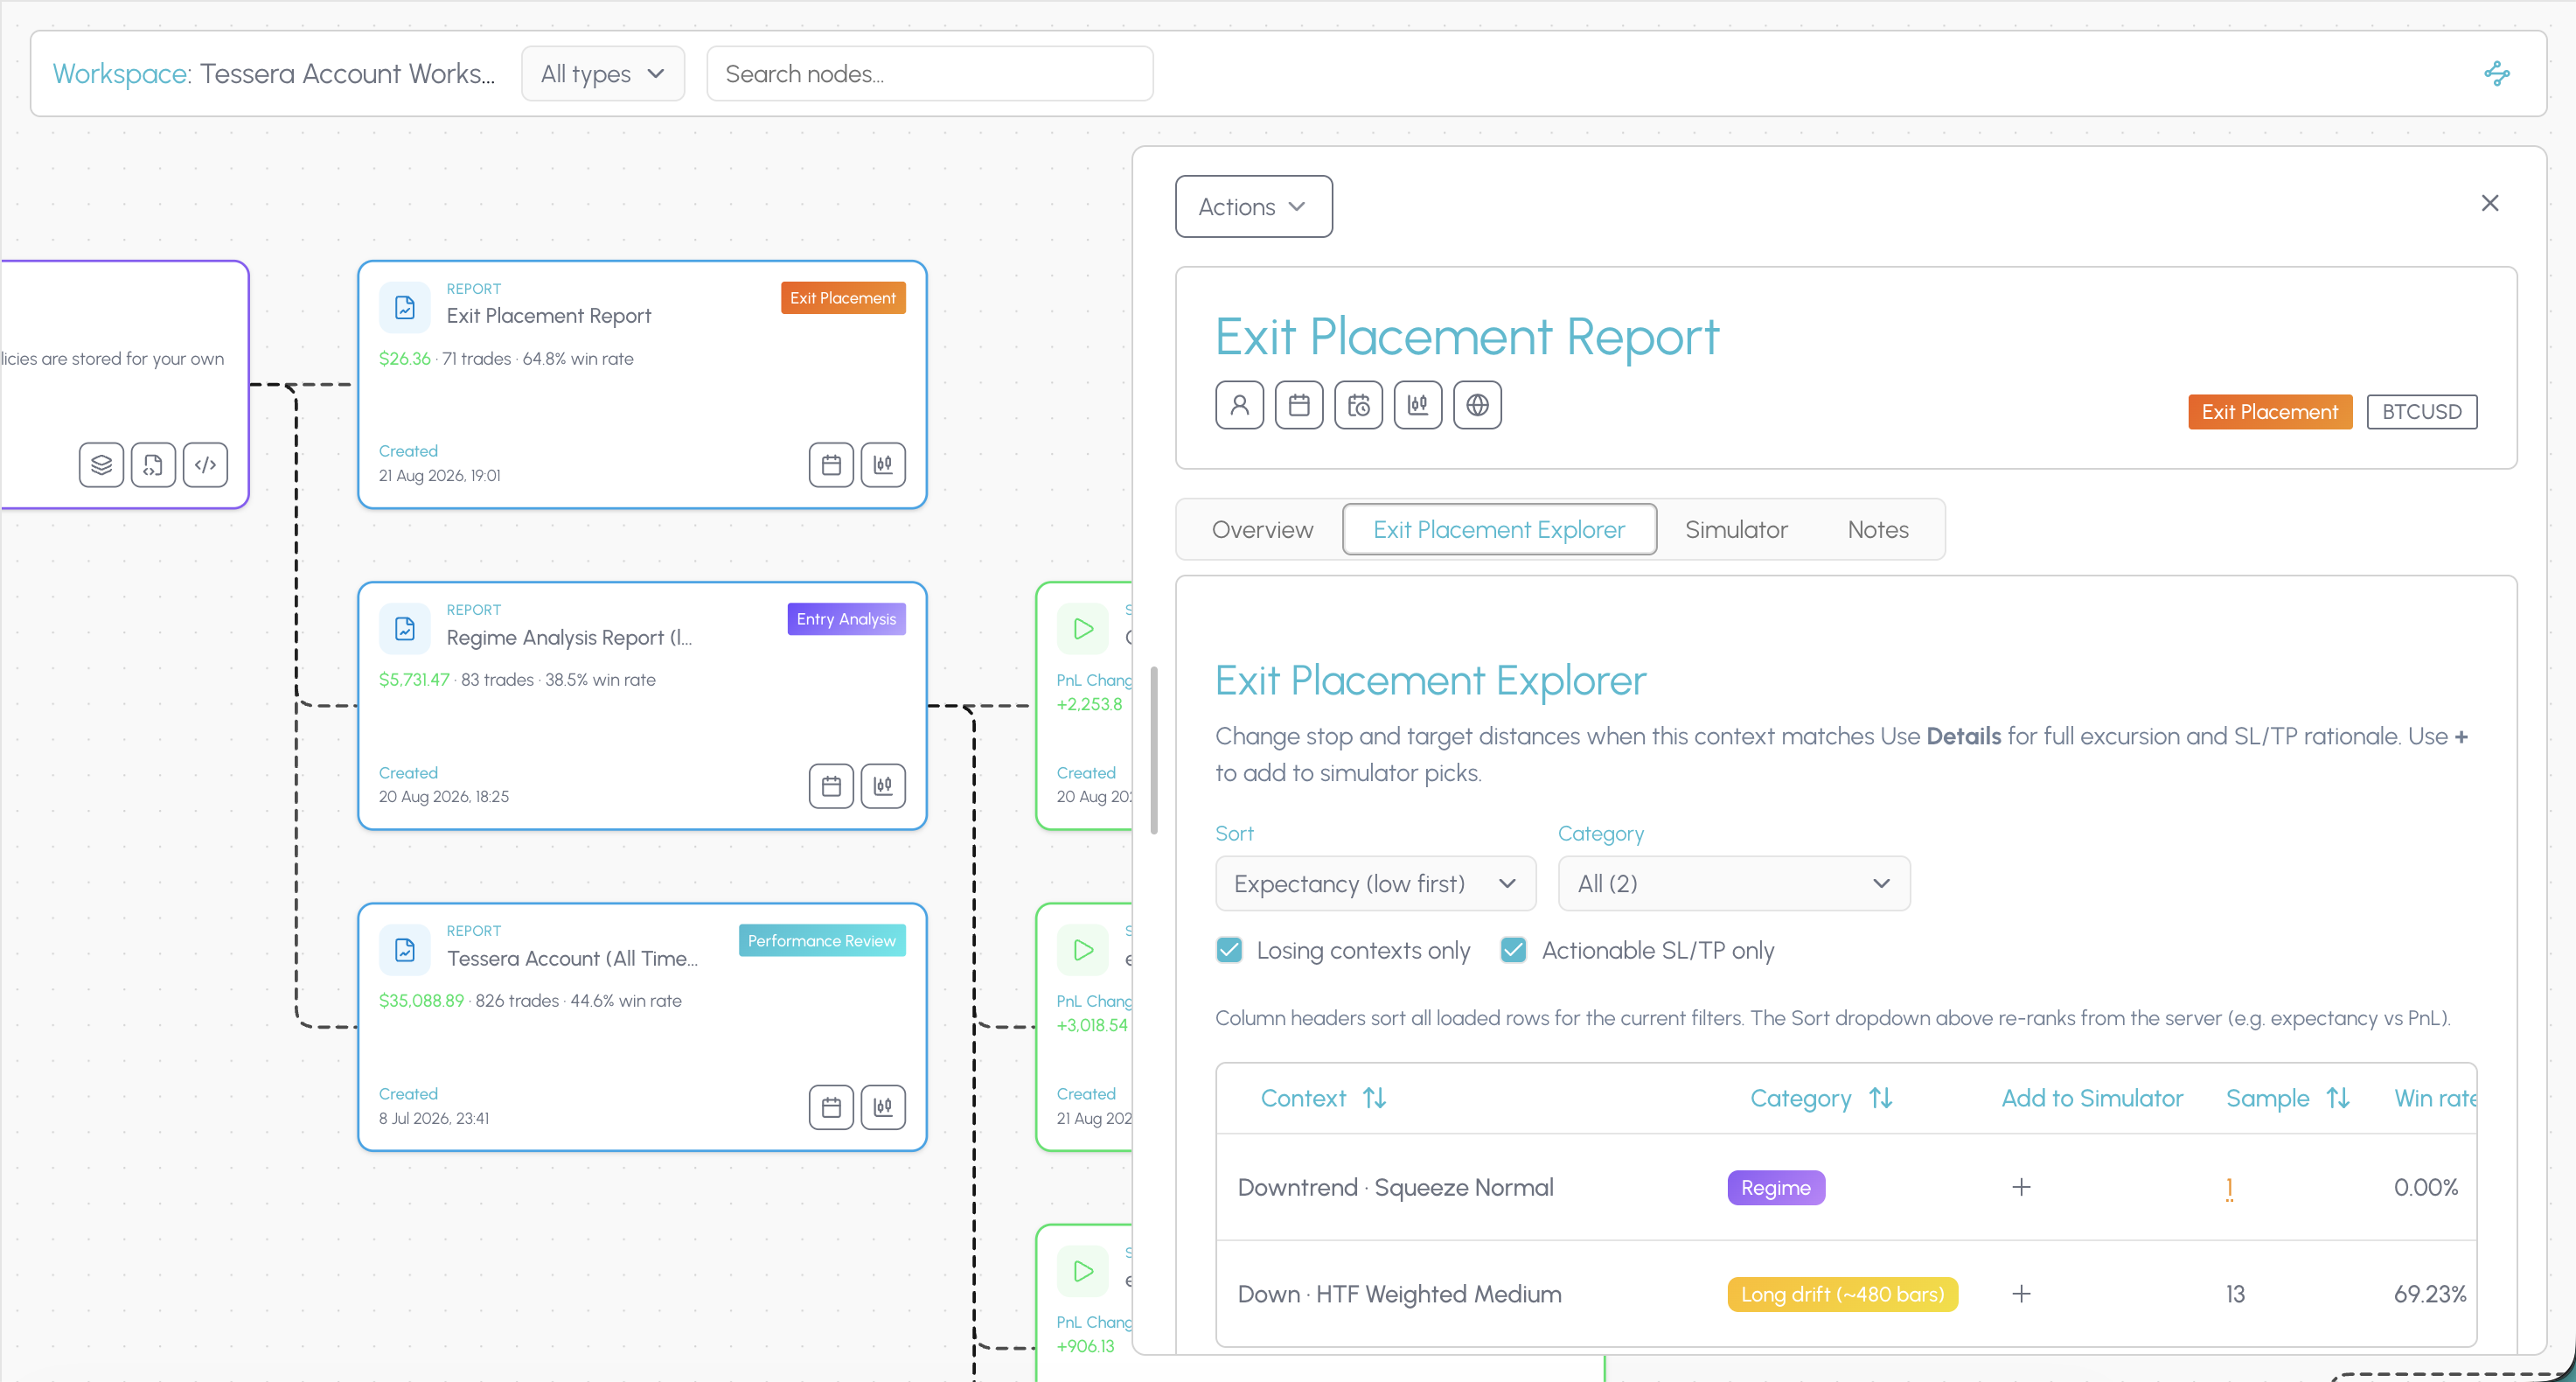
Three reports, each answering one question. Not three hundred dashboards you have to know what to look for in. How you traded, whether you should have been in, whether the stop and target belonged there. Open the report that matches the question. It stops when that question is answered.
The wide view of a period. Sessions, timing, win and loss mix, streaks, risk. Written analysis, findings with the evidence behind them, and the core stats for that window.
Runs on any account and any date range. No symbol or timeframe needed.
Performance Review
Other journals let you tag a trade "trending" and filter on it later. That tag is your memory of the trade, typed in after you closed it.
Tessera reads the price action itself. Volatility, trend, momentum, where price sat against its moving averages, how close it was to support or resistance, whether the higher timeframes agreed. All computed at the moment you entered, with no lookahead.
Reports don't stop at one filter. They stack conditions so a session, a direction, and a trade side can be read together.
Example 1
By session
London / New York
24 trades · 29% win rate · −$45
By session and market direction
Long-horizon direction up, during London / New York
15 trades · 13% win rate · −$207
The session isn't the problem. The session when the market was trending up is.
Example 2
By volatility
ATR regime very low
126 trades · 41% win rate · +$1,676
By volatility and Bollinger zone
ATR regime very low, price at lower extreme
22 trades · 23% win rate · −$180
Your best condition has a losing pocket inside it. The top-level number never shows it.
Example 3
By trade side
Short trades
62 trades · 49% win rate · +$1,140
By higher-timeframe alignment
Aligned entries
71 trades · 44% win rate · +$890
Both together
Short trades where the higher timeframes were aligned against you
18 trades · 22% win rate · −$240
Each condition looks fine on its own. The intersection is where the money goes.
A finding on its own is just information. It still has to become a filter, a test, a rule before it changes anything. Most of them die somewhere in that gap.
In Tessera a finding is an object. Send a slice that's leaking money to the simulator and see what happens if you remove it. Send one that's paying and see what happens if you keep only those. Nothing gets re-typed.
What survives becomes a policy on your strategy. Keep it as a rule to test against, or compose it into a copy of your Pine script to paste onto the chart yourself.
Report
Pullback Into Trend
+$4,820 · 186 trades · 47.3% win rate
Created
3 Aug 2026
Simulation
Remove London / New York
PnL Change
+$45
Win rate
50.0%
Trades
−24
Created
3 Aug 2026
Simulation
Remove London / NY when direction is up
PnL Change
+$207
Win rate
50.3%
Trades
−15
Created
3 Aug 2026
Policy
Veto direction-up London / New York
This policy removes trades when the session is London / New York and long-horizon direction is up.
Created
3 Aug 2026
Were my stops and targets in the right place?
Every trade leaves a trail. How far price ran your way before it turned, how far it went against you first, and which of those came first. Exit Placement reads that trail across your history and works out what stop and target distances your own trades would have supported.
Not one suggested stop for everything you trade. A different distance for each market context, ordered so the biggest leak sits at the top. Every suggestion carries the number of trades behind it and how much confidence that sample supports.
Example: XAUUSD, 1m
Down · ATR Regime Very Low
65 trades · 27.69% · −$9.97 · −$647.84 · 1:2
Stop
$5.42 from entry
Target
$10.67 from entry
Trend · Short · MA50 Below
35 trades · 28.57% · −$16.65 · −$582.86 · 1:2
Stop
$5.42 from entry
Target
$10.63 from entry
Sydney Tokyo · Down · RSI Neutral
16 trades · 6.25% · −$31.48 · −$503.70 · 1:1.5
Stop
$7.21 from entry
Target
$11.06 from entry
Some losers go against you straight away. Others go your way first, sometimes a long way, and then hand it all back. On your statement they look the same. Two red numbers.
They are not the same problem. A trade that never worked was the wrong trade. A trade that worked and then gave it back was the right trade with the wrong exit. Fixing the first means changing what you take. Fixing the second means changing when you get out.
Exit Placement tells you how much of your losing is each kind, and how far those trades ran before they turned.
Same result. Different problem.
Went against you from the start
−$184
Worked, then gave it back
−$184
Before suggesting anything, Exit Placement checks whether the change is actually supported. Whether moving to breakeven would have cut your winners short. Whether a trailing stop had room to work. Whether widening your stop is safe given how your losers really moved. Whether your targets have any headroom left in the data.
If the evidence isn't there, it says so, and it tells you which check failed.
Four checks run before any suggestion.
Would moving to breakeven have cut your winners short?
Not supported
Did a trailing stop have room to work?
Supported
Is a wider stop actually safe?
Not supported
Do your targets have room left?
Not supported
Pick an account, a date range, and a symbol. Run the report. Take the finding into the simulator.