

How to Export TradingView Strategy Tester Results (2026)
Export TradingView Strategy Tester results as CSV or XLSX: where the download buttons are, which plan you need, the 9,000 trade limit and what columns mean.
By Tessera Trades · Updated · 8 min read
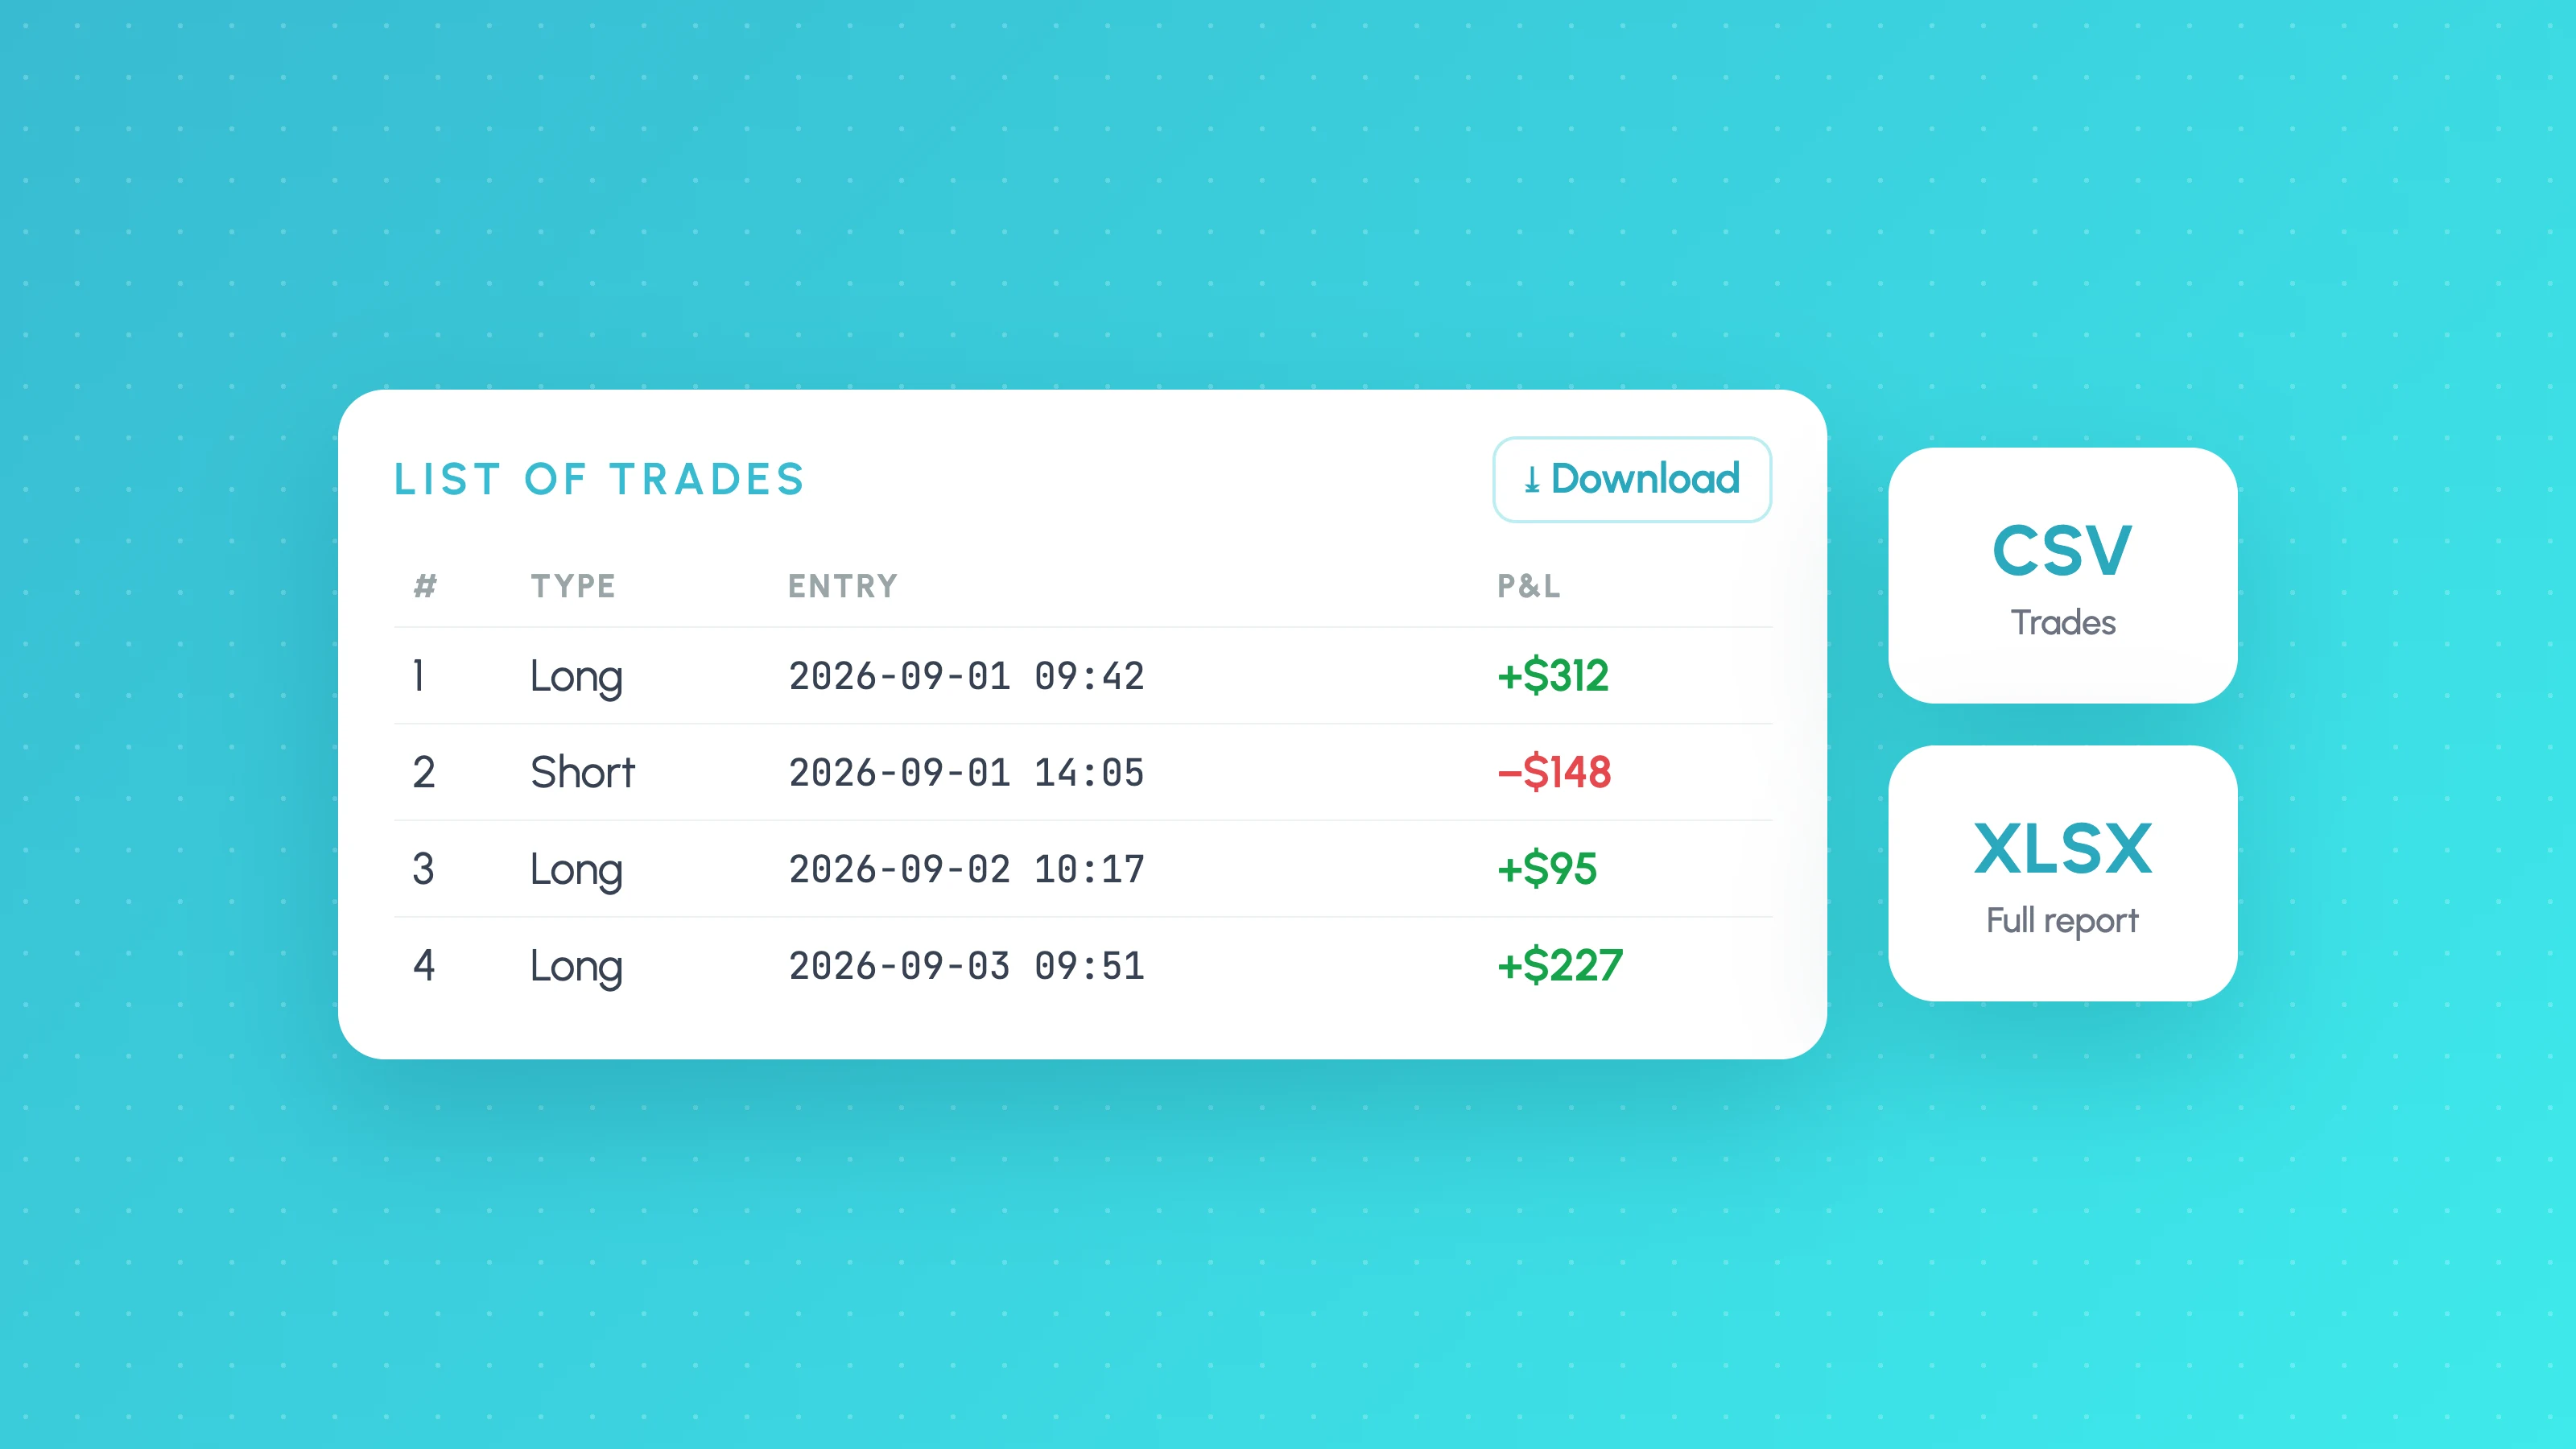
To export TradingView Strategy Tester results, open the strategy report below your chart, go to the Trades tab and click the Download icon next to Column setup: that saves the List of Trades as a CSV file. To export the whole report (metrics, trades and properties) instead, choose "Download data as XLSX" from the strategy report's menu; both exports need the Essential plan or higher as of October 2026.
Older guides disagree on the format (some say CSV, some XLSX) and on which plans can export. Both formats exist, and they do different jobs. This guide settles the details from TradingView's own documentation, explains every column in the trade list, lists the problems people hit, and covers what to do with the file once you have it.
Where the export buttons are
The Strategy Tester is now called the strategy report in TradingView's documentation. It opens in the panel below the chart whenever a strategy is on the chart, and it has two main sub-tabs: Metrics and Trades.
To export the List of Trades as CSV:
- Add your strategy to the chart and wait for the report to finish calculating.
- In the report, switch to the Trades tab.
- Above the top-right edge of the list, find the Column setup icon. The Download icon sits next to it.
- Click Download. The browser saves a CSV file.
To export the full report as XLSX:
- Open the strategy report.
- Open the report's menu (the context menu at the top of the report).
- Choose Download data as XLSX.
TradingView's Pine Script strategies documentation describes both: the Download icon "download all available data for the list as a CSV file", and the XLSX option downloads "all applicable data" from the report's sub-tabs. The XLSX file also includes the Properties tab data (initial capital, order size, commission, slippage and so on), which makes it the better file to archive alongside a strategy version.
CSV or XLSX: which one do you need?
| List of Trades CSV | Full report XLSX | |
|---|---|---|
| Where | Download icon on the Trades tab | "Download data as XLSX" in the report menu |
| Contains | One row per trade entry or exit with every available trade column | Metrics, trades and Properties tab data |
| Best for | Analysis in a spreadsheet, Python or an import tool | Keeping a full record of a backtest and its settings |
| Columns hidden in Column setup | Still included | Still included |
TradingView's older help page, How to export strategy data, says each tab exports separately and only mentions CSV. The current Pine Script documentation and the pricing page list both formats, so the safest reading as of October 2026 is: CSV for the trade list, XLSX for the whole report.
If you only want to analyse trades, use the CSV. It is simpler to parse and most import tools expect it.
Which TradingView plan can export?
TradingView's plan comparison lists "Export trades in CSV" and "Export report in XLSX" as separate features. As of October 2026 the comparison table shows:
| Feature | Basic (free) | Essential | Plus | Premium | Ultimate |
|---|---|---|---|---|---|
| Export trades in CSV | No | Yes | Yes | Yes | Yes |
| Export report in XLSX | No | Yes | Yes | Yes | Yes |
| Deep Backtesting | No | No | No | Yes | Yes |
| High detalization of historical bars (Bar Magnifier) | No | No | No | Yes | Yes |
Third-party guides from earlier years quote different plan requirements. Plans change, so check the pricing page if you are reading this much later.
The 9,000 trade limit and Deep Backtesting
With the default testing range, a strategy keeps individual data for only the latest 9,000 trades. TradingView's documentation says trimmed trades are not visible "in the strategy report interface or any downloaded XLSX or CSV files". The Metrics tab still counts them, so your summary profit factor can be based on more trades than your export contains.
If your strategy has more than 9,000 trades in the default range, choose a different testing period from the menu at the top of the report. That switches the report into Deep Backtesting mode, which keeps individual data for all trades in the range. Deep Backtesting needs Premium or Ultimate.
Two things to know about Deep Backtesting:
- It only changes the testing range of the report. Trade markers, plots and alerts on the chart still use the chart's loaded data.
- You can't click a trade in the list to scroll the chart to it while it's active.
What each column in the List of Trades means
TradingView documents these columns for the Trades tab. The CSV contains all of them, whatever you have switched off in Column setup. The exact header text in the file has changed between TradingView versions (older files say things like "Profit" and "Run-up"), so match on meaning rather than exact names if you write a script.
| Column | What it holds | Watch out for |
|---|---|---|
| Trade number | The trade's sequence number | In the CSV a trade has usually appeared as an entry row and an exit row with the same number |
| Type | Entry or exit, and long or short | Filter on this to get one row per trade |
| Date and time | When the entry or exit happened | Shown in the chart's time zone (see below) |
| Signal | The order ID or comment from strategy.entry or strategy.exit | Useful for tagging trades with conditions |
| Price | Entry or exit fill price in the quoted currency | Includes simulated slippage if you set it |
| Size | Contracts, lots, shares or units, plus the value in account currency | Changes trade to trade with percent-of-equity sizing |
| Return (net P&L) | The trade's net result, in currency and as a percentage | Net of the commission you configured |
| Favorable excursion | The largest unrealised profit during the trade (also called run-up or MFE) | Useful for target placement |
| Adverse excursion | The largest unrealised loss during the trade (also called drawdown or MAE) | Useful for stop placement |
| Cumulative PnL | The strategy's running total after the trade | Recalculate it yourself if you filter trades |
| Duration (bars) | How many bars the trade stayed open | Bars, not minutes: multiply by your timeframe |
The excursion columns are the most underused. They show how far price went for and against each trade, which is the raw material for MAE and MFE analysis.
Time zones: check before you analyse
TradingView's help centre says the List of Trades date and time is "the transaction time in the chart's time zone". Change the chart's time zone and the times in the list change with it.
Before exporting, set the chart to the time zone you want to analyse in, usually the exchange's time zone or UTC, and write it down. If you later group trades by hour or session, a one-hour offset will put trades in the wrong bucket, and daylight saving changes make it worse. After exporting, compare two or three rows in the file with the list on screen to confirm they match.
Common export problems
- The Download icon is missing. You are probably on the Basic plan. Exports need Essential or higher.
- The file has fewer trades than the Metrics tab says. The 9,000 trade limit trimmed the oldest trades. Use a custom testing range with Deep Backtesting, or shorten the range and export in parts.
- Each trade appears twice. The CSV has usually listed the entry and the exit as separate rows with the same trade number. Filter on the Type column, or combine the two rows so each trade has one entry time and one result.
- Excel shows dates as text or mixes up day and month. Import the CSV through Excel's data import (or Google Sheets' import) and set the date column's format explicitly, rather than double-clicking the file.
- Results differ from yesterday's export. Historical data can be revised and new bars extend the range. Save the XLSX with each strategy version so you can compare like with like.
- Numbers don't match after you filter trades. The Cumulative PnL column is the original running total. Recalculate it from the Return column for any subset.
What to do with the file next
The Metrics tab gives you one profit factor and one win rate for the whole history. The export is where you find out what's behind those numbers: which sessions, weekdays, hours and volatility levels make the money, and which give it back.
A good next step is to break the trades down by condition. How to analyse a TradingView backtest walks through doing it in a spreadsheet with formulas, including the minimum trade count each bucket needs before you act on it. Before you trust any slice, check it has enough trades using the method in how many trades a backtest needs.
If you'd rather not build the spreadsheet, Tessera imports the TradingView Strategy Tester CSV directly and breaks the trades down by session, weekday, time of day, volatility and symbol, with the trade count behind each slice. Rules you test there can be composed into a copy of your Pine Script to paste back into TradingView and re-backtest, which is what the strategies page covers.
Get a free breakdown of your export
Upload your List of Trades CSV to the free Entry Analysis report and see your strategy's results split by market condition. No card needed.
Strategy Tester exports load into Tessera's algo trading journal alongside live trades, kept in a separate account so backtest and real fills don't mix. See the full list of supported brokers and platforms.
Frequently asked questions
- Can I export TradingView backtest results on the free plan?
- No. As of October 2026 TradingView's plan comparison lists both "Export trades in CSV" and "Export report in XLSX" as Essential and above, so the Basic plan can't download strategy results. You can still read the Metrics and Trades tabs on screen.
- Does TradingView export the Strategy Tester to Excel?
- Yes. "Download data as XLSX" in the strategy report menu produces an Excel file with the metrics, the trade list and the Properties tab. The List of Trades CSV also opens in Excel, but import it through Excel's data import so the date column is read correctly.
- Why does my exported list have fewer trades than the strategy report?
- With the default testing range TradingView keeps individual data for only the latest 9,000 trades, and trimmed trades are missing from both CSV and XLSX downloads. Choosing a custom testing range turns on Deep Backtesting (Premium and Ultimate), which keeps every trade in the range.
- What time zone are exported TradingView trades in?
- TradingView shows List of Trades times in the chart's time zone. Set the chart to the time zone you want before exporting, and check a few rows in the file against the on-screen list, especially if you plan to group trades by hour or session.
- Can I export only the columns I've chosen in Column setup?
- No. TradingView's documentation says the CSV contains all available columns regardless of which ones are displayed. Delete the columns you don't need after downloading.
Keep reading
 TradingView backtests
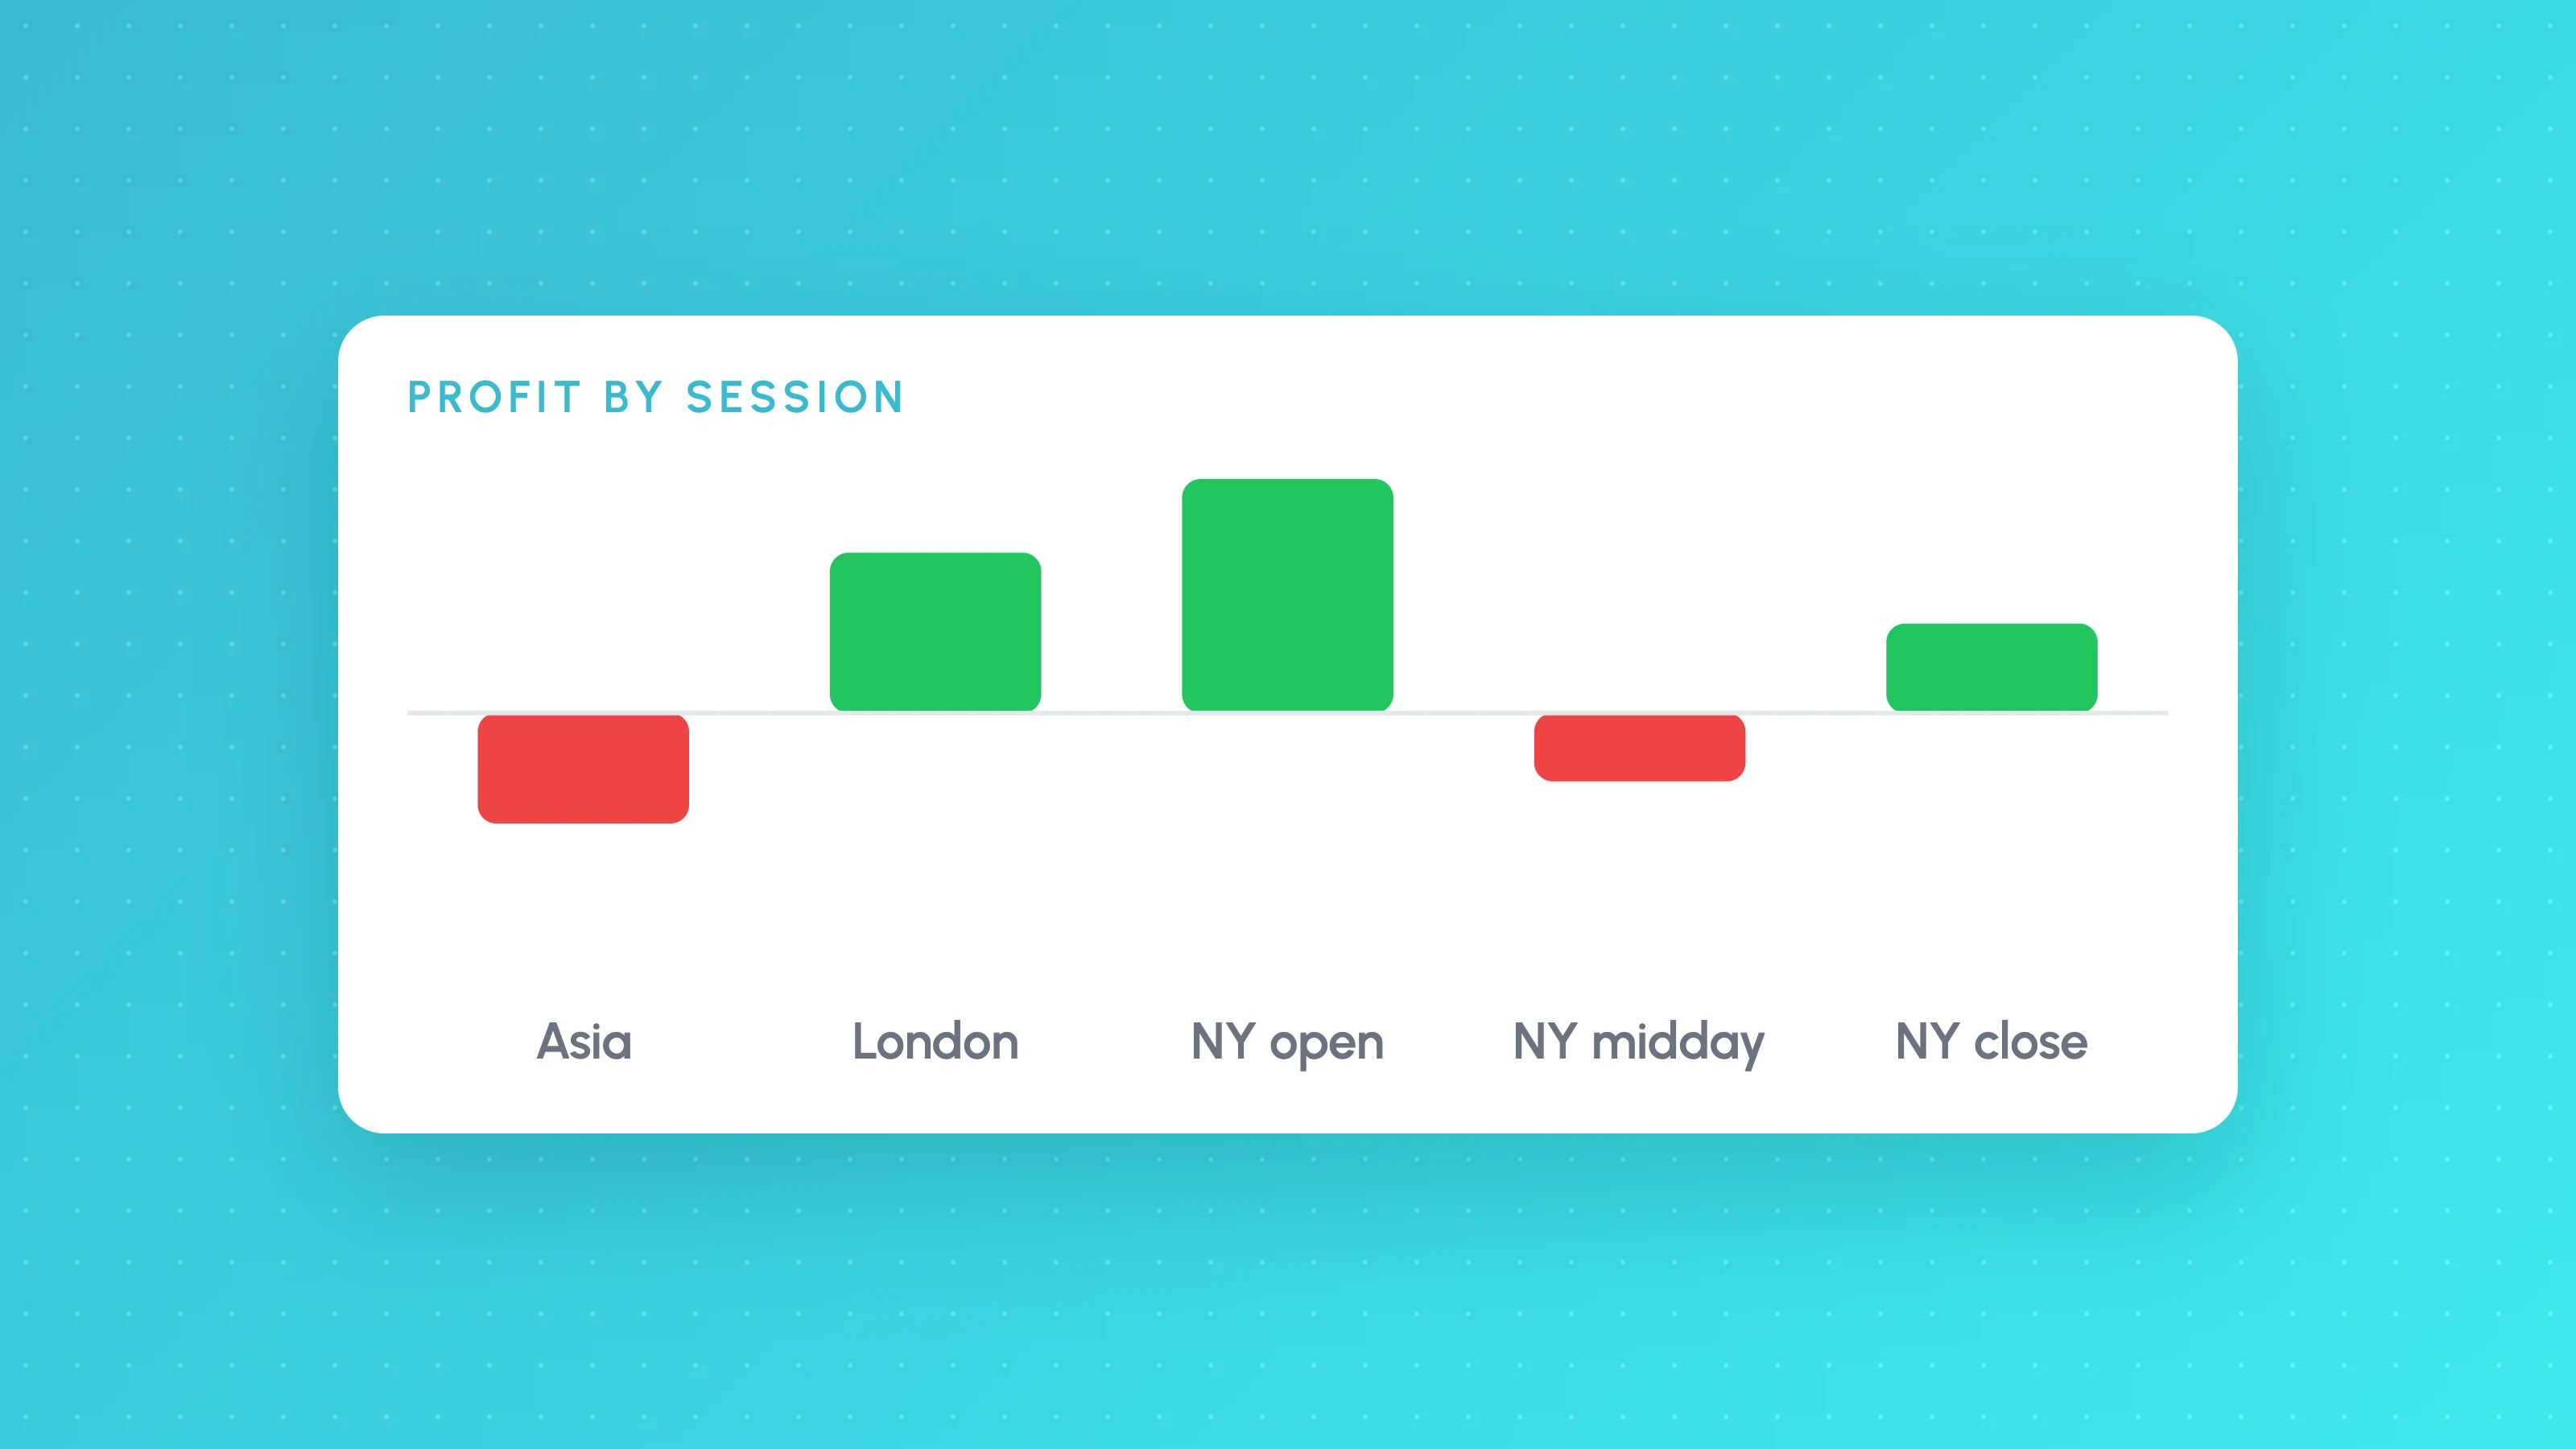
How to Analyse a TradingView Backtest by Session, Weekday and Hour
Analyse a TradingView backtest beyond the summary: split trades by session, weekday, hour, volatility and direction, check sample sizes, then test the rule.
 TradingView backtests
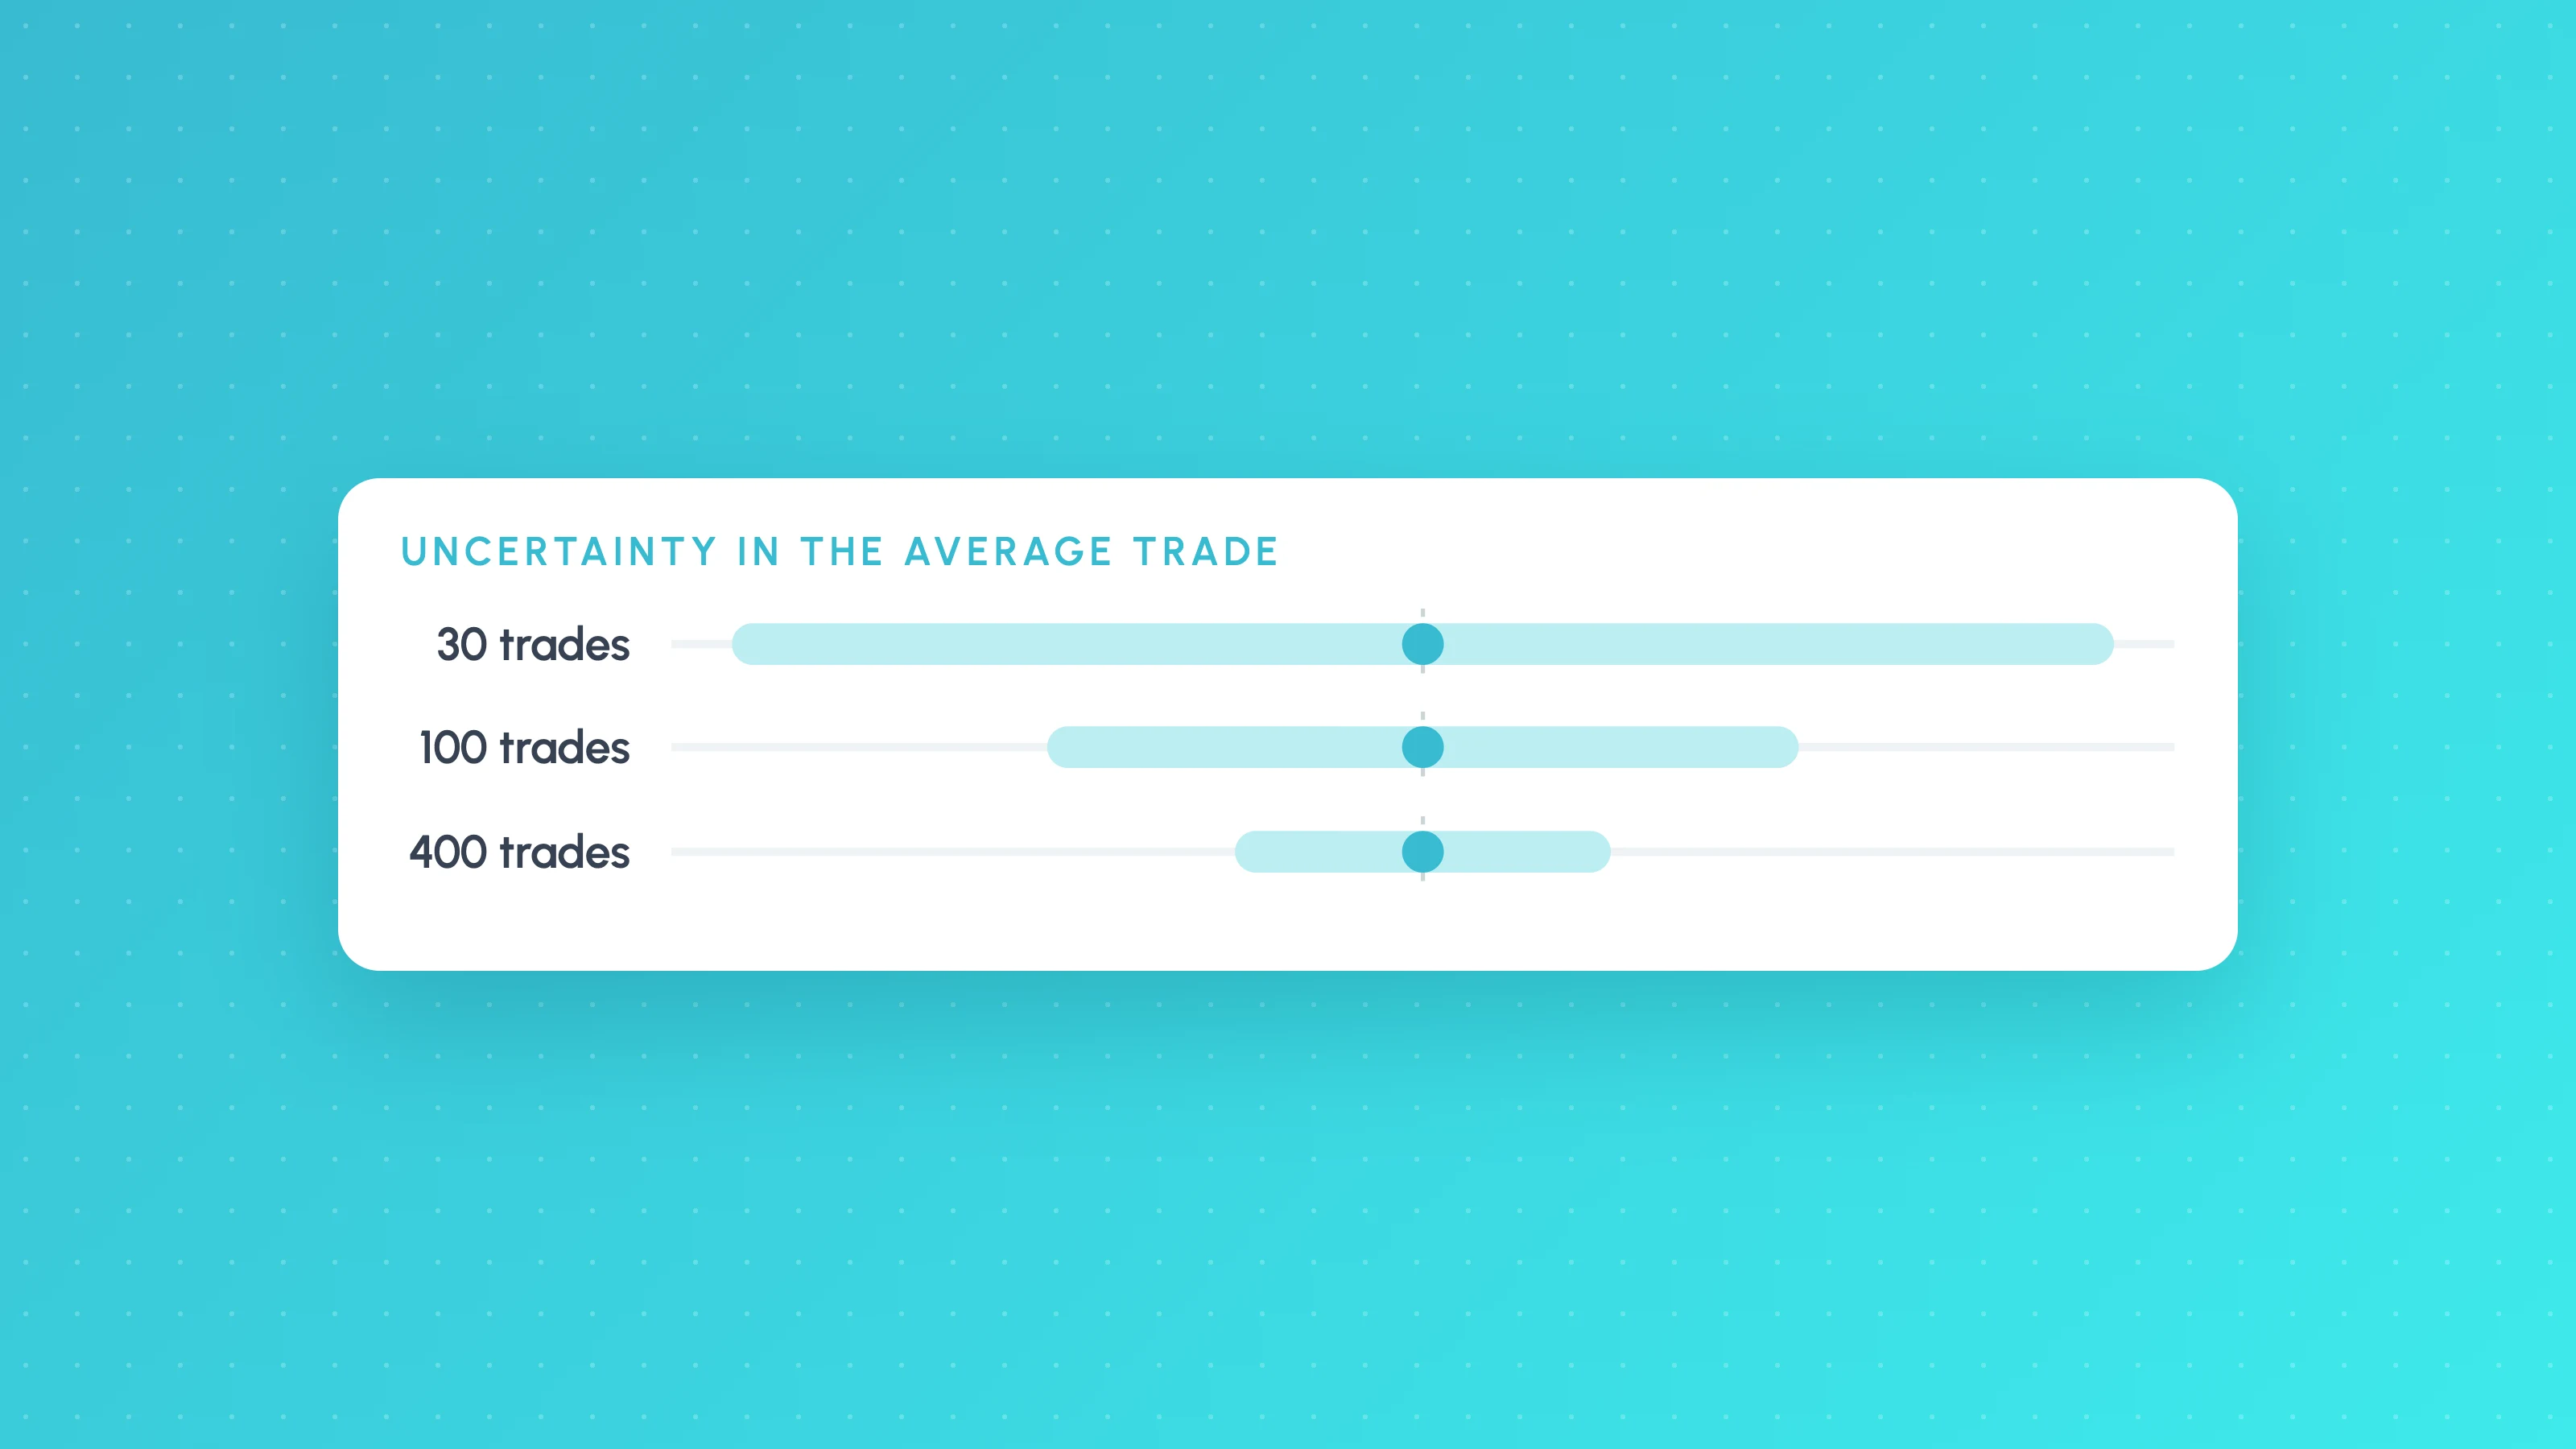
How Many Trades Do You Need for a Valid Backtest?
How many trades a backtest needs: rules of thumb, the t-statistic formula with a worked example, a table by edge size, per-bucket minimums and multiple testing.
 TradingView backtests
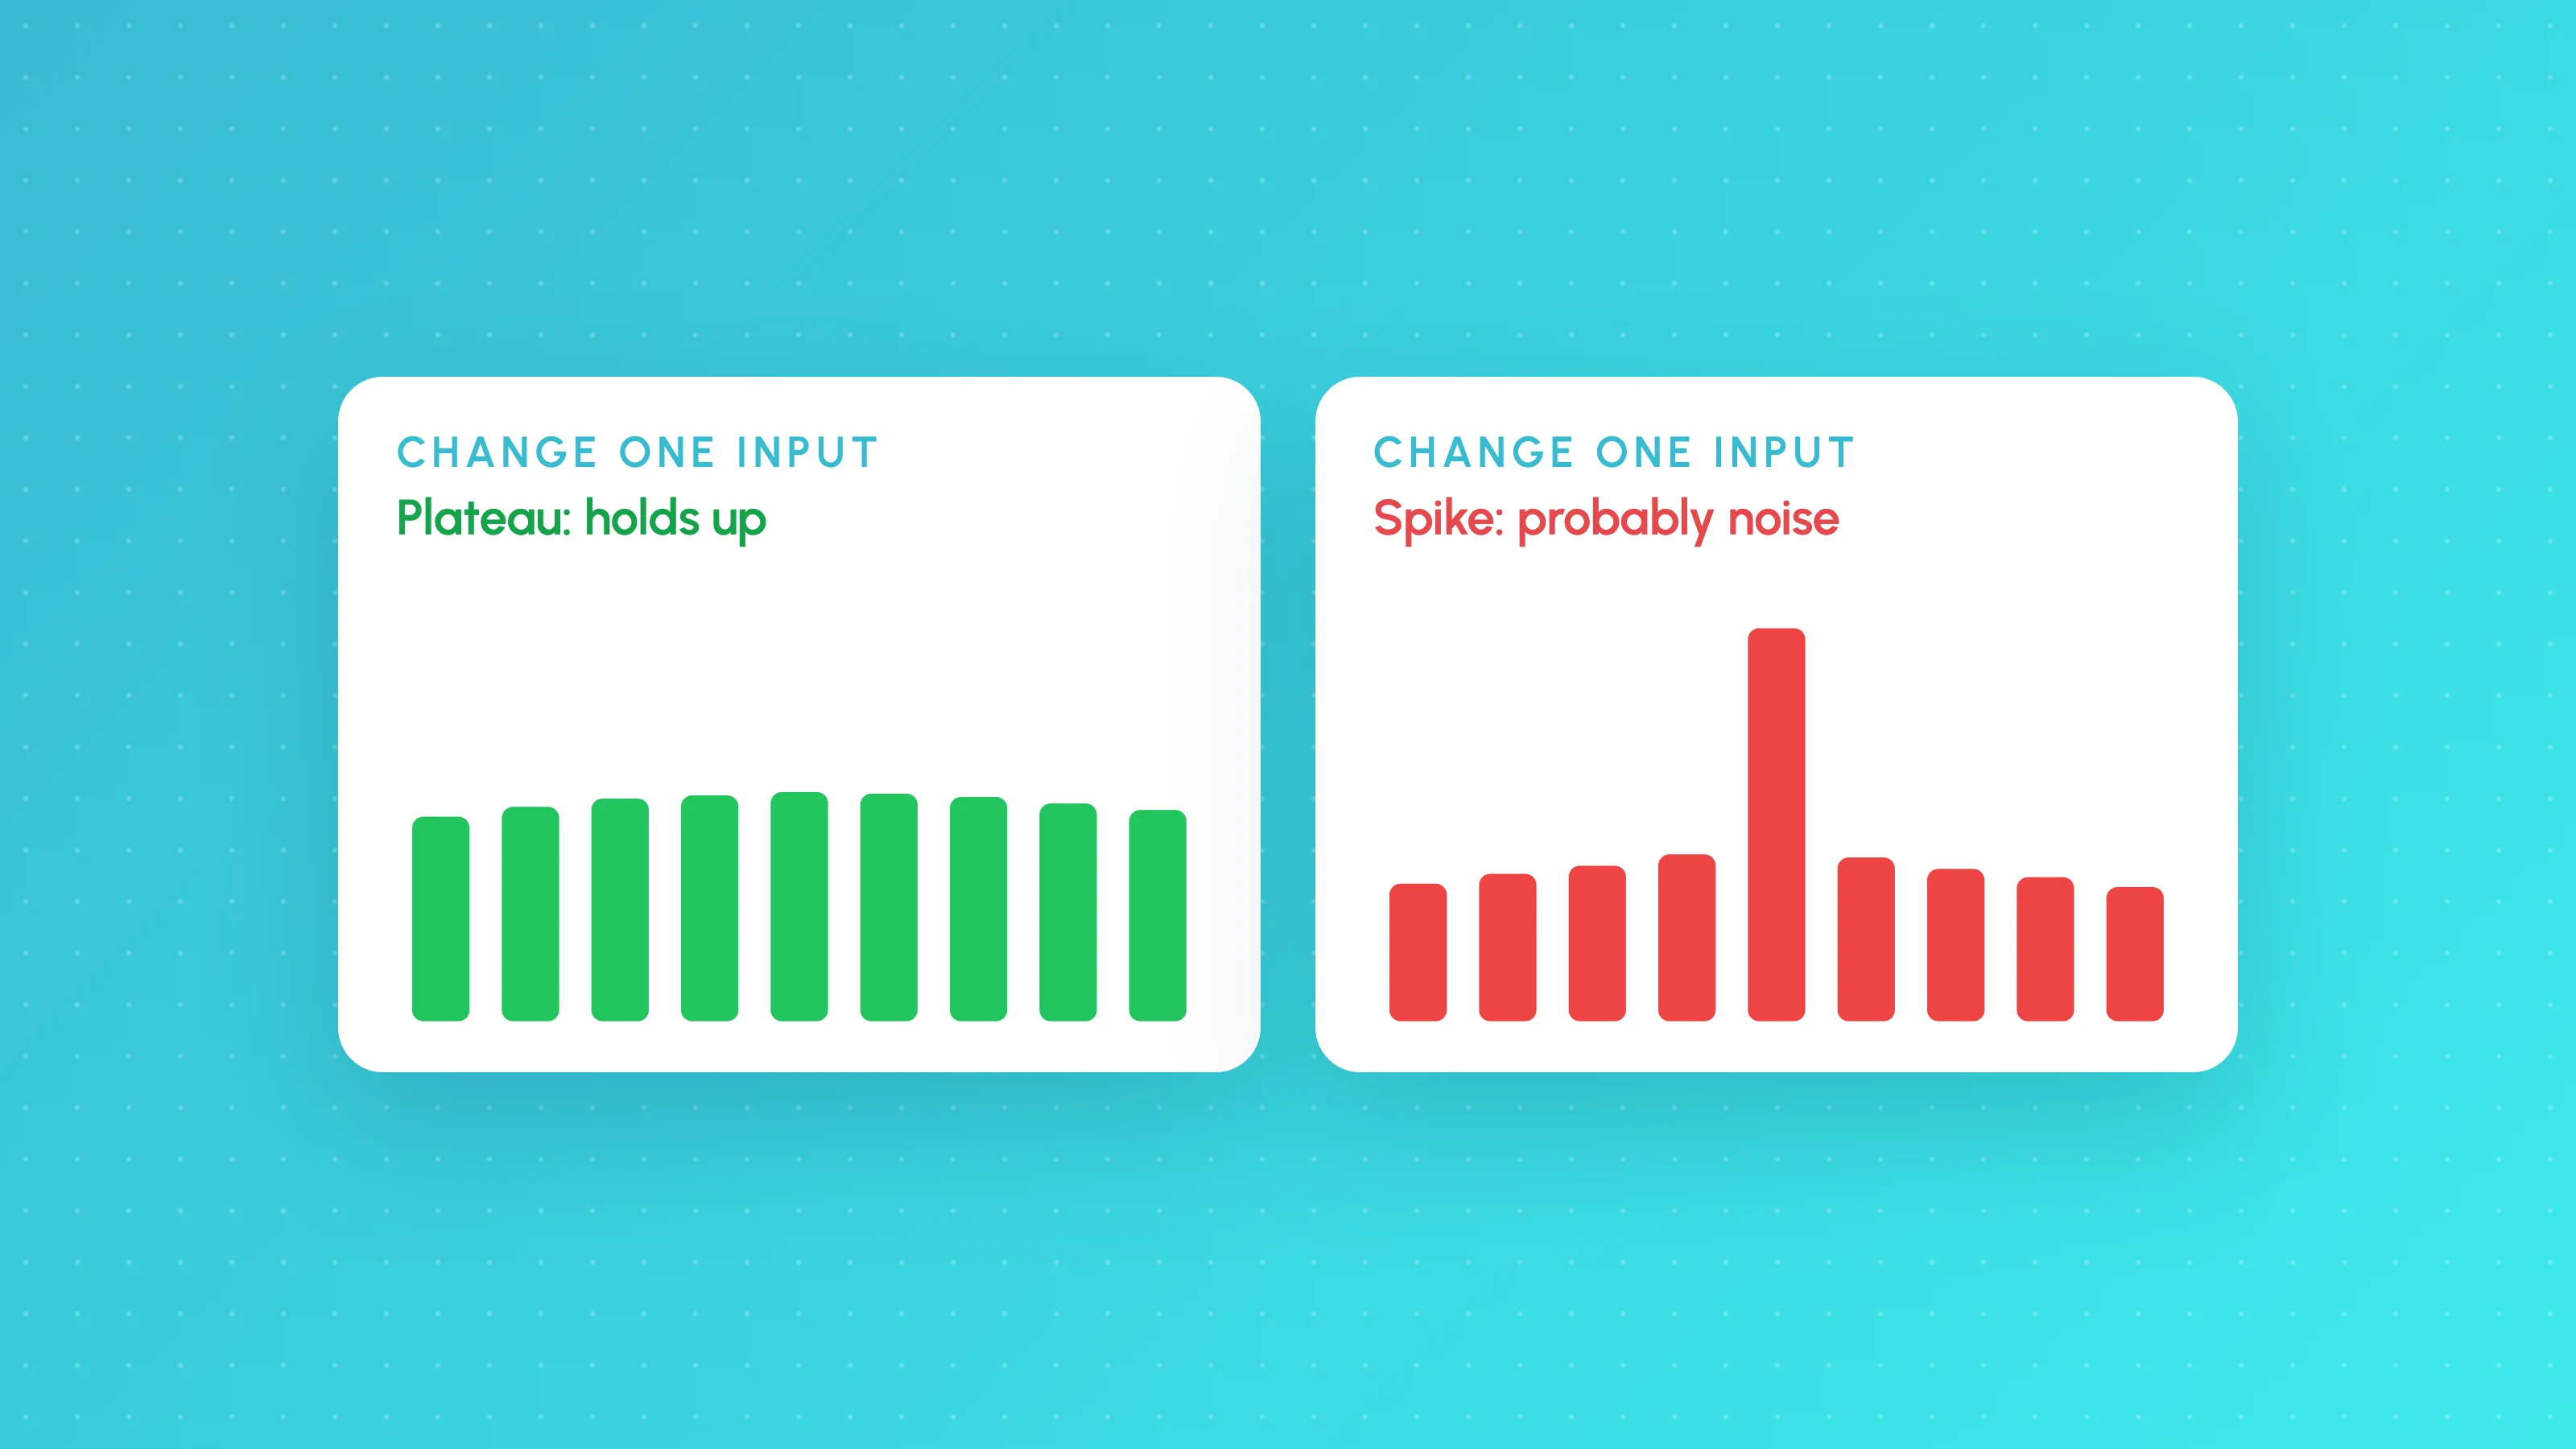
Is My Backtest Overfit? A Practical Checklist for Traders
How to tell if a backtest is overfit: too-good metrics, thin samples, fragile inputs, useless filters, out-of-sample and walk-forward tests, plus a checklist.