

MAE and MFE Analysis: Set Stops and Targets From Your Own Trades
How to calculate MAE and MFE for each trade, read the scatter plots, set stops from winners' MAE and targets from MFE, then test the change on real candles.
By Tessera Trades · Updated · 7 min read
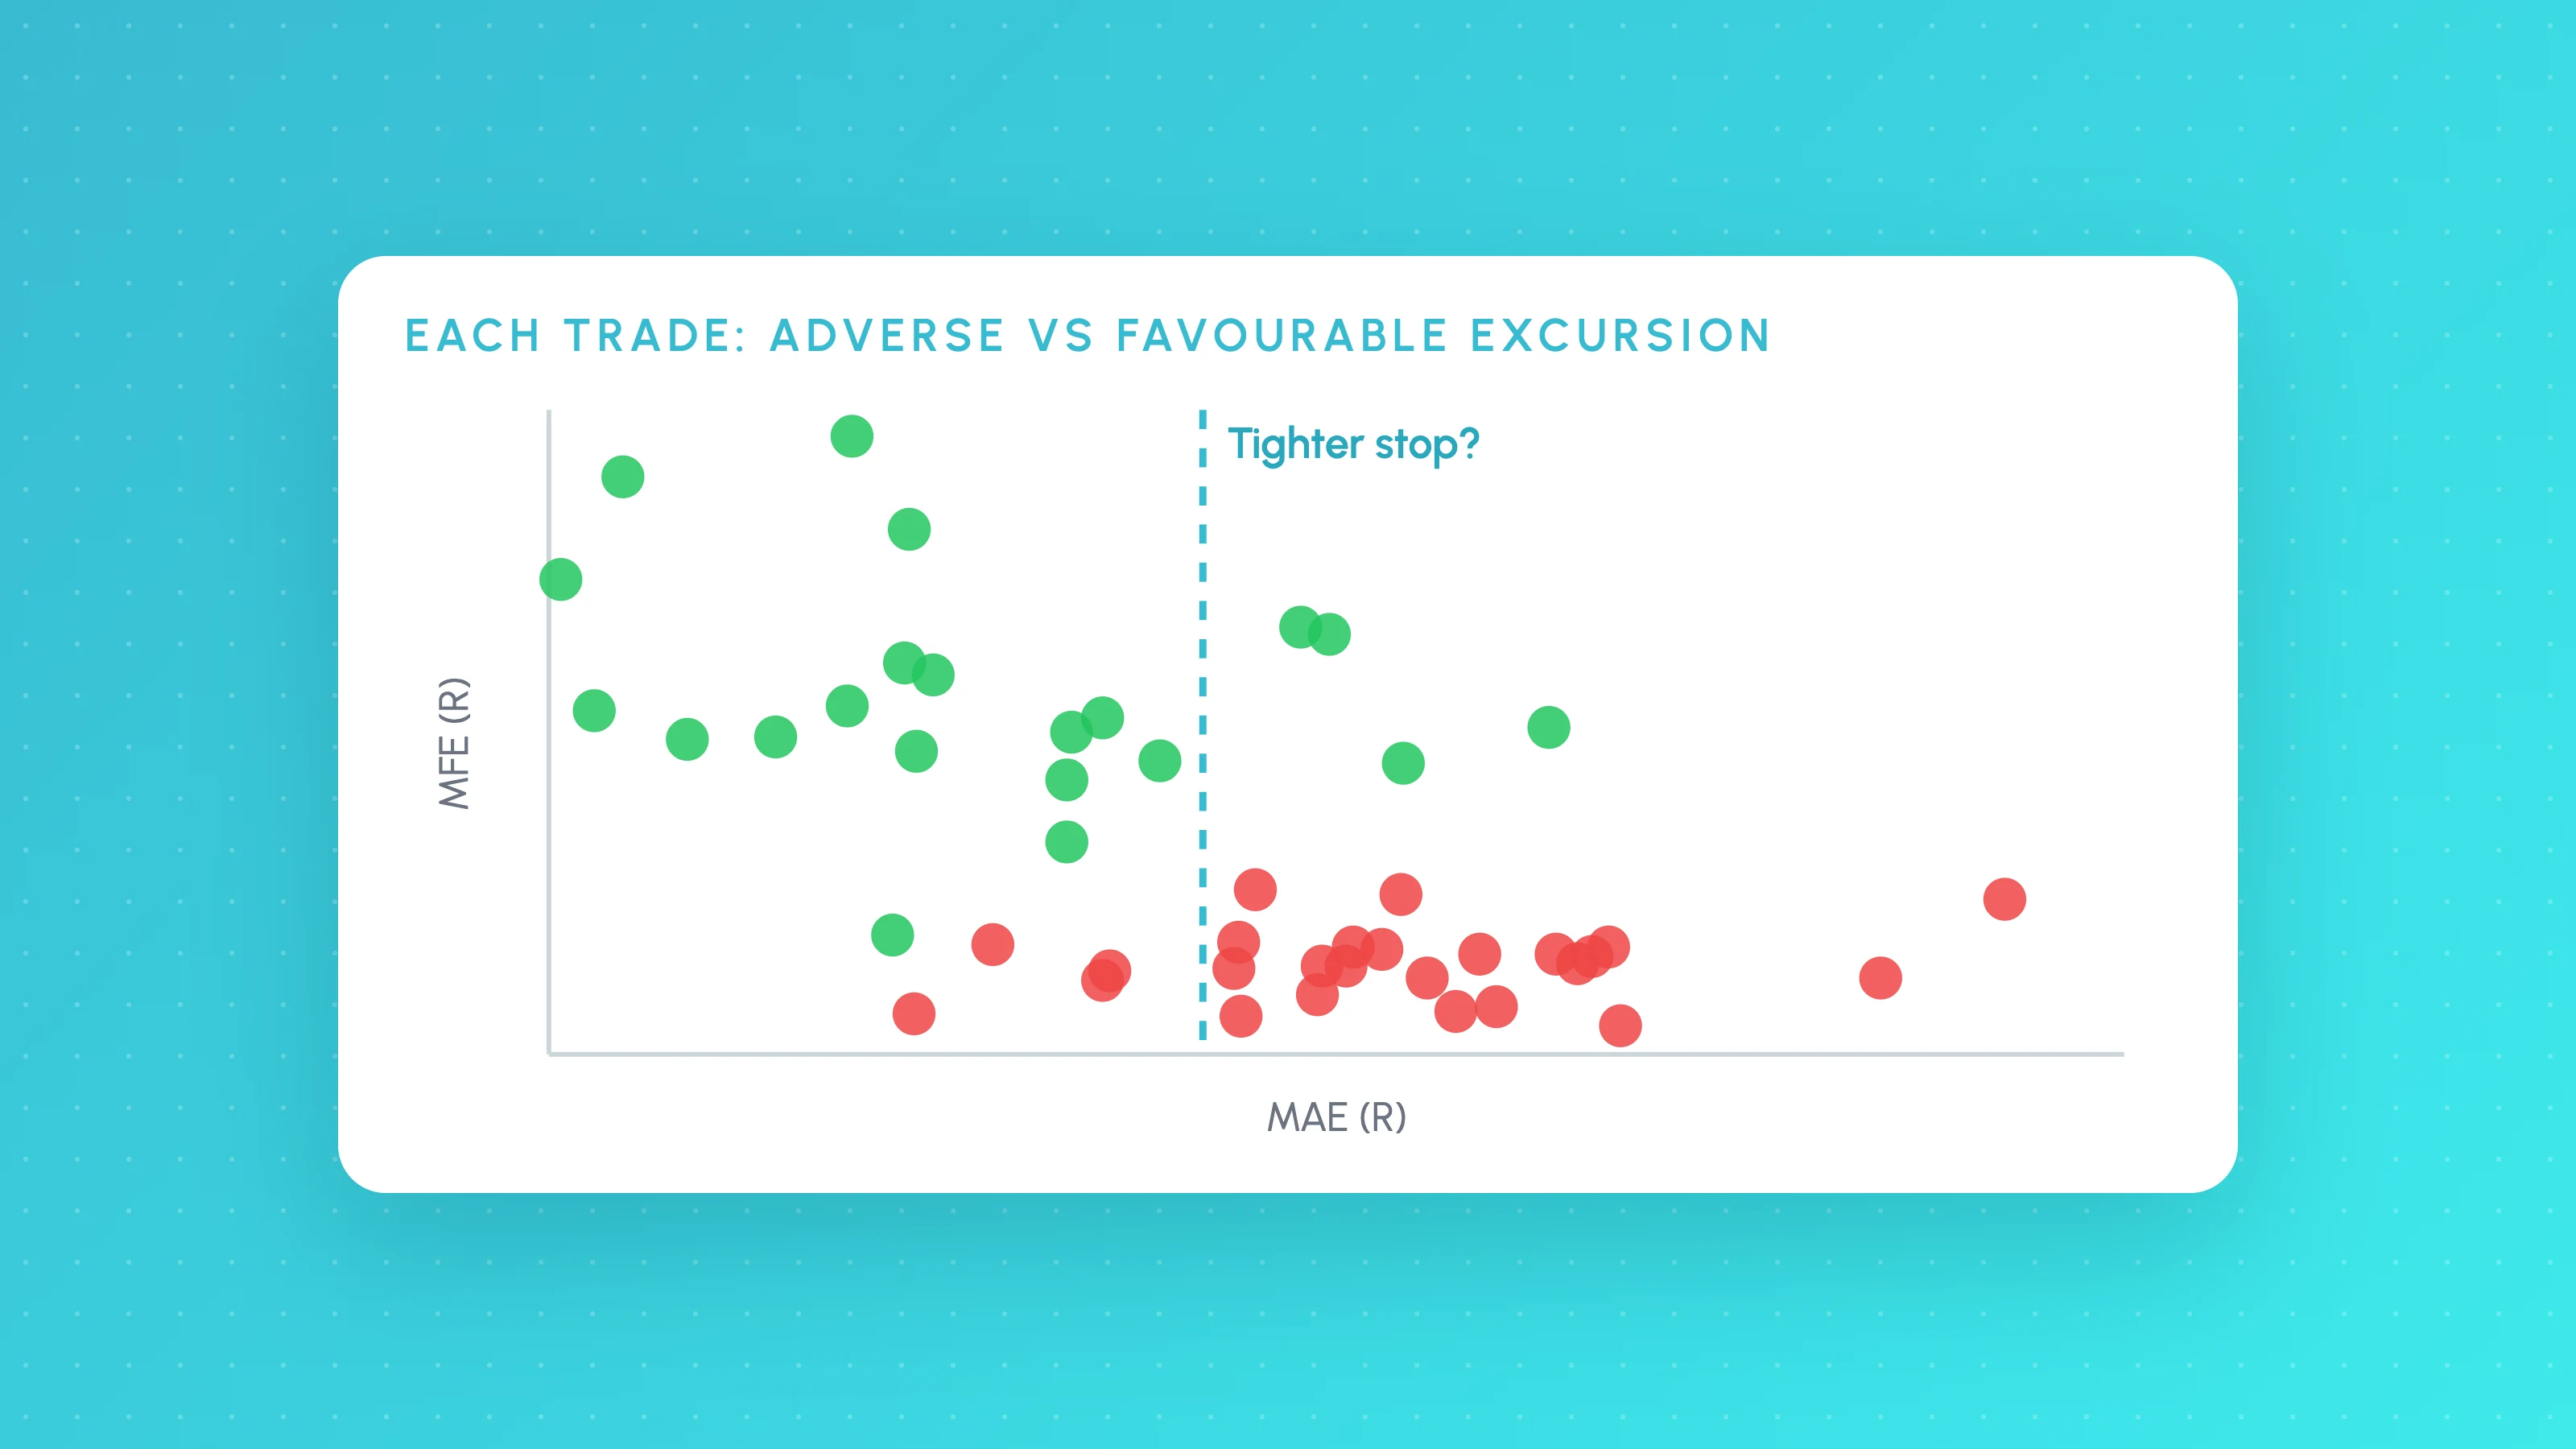
MAE and MFE analysis measures how far price moved against each trade (maximum adverse excursion) and in its favour (maximum favourable excursion) while the trade was open. Comparing those distances across many trades shows where a stop would have cut losers without stopping out winners, and how much profit trades typically offered before they closed.
Most traders set stops and targets from a rule of thumb, a fixed number of points or a round risk-reward ratio. MAE and MFE let you set them from evidence: the actual paths of your strategy's own trades. This guide covers the definitions, how to calculate both from price data, how to read the charts, and how to test a new stop before you change your strategy.
What MAE and MFE mean
- Maximum adverse excursion (MAE): the largest move against the position between entry and exit. For a long, entry price minus the lowest price while the trade was open. For a short, the highest price minus entry.
- Maximum favourable excursion (MFE): the largest move in the trade's favour. For a long, the highest price minus entry. For a short, entry minus the lowest price.
The idea of studying MAE systematically is usually credited to John Sweeney, whose book "Maximum Adverse Excursion: Analyzing Price Fluctuations for Trading Management" was published by Wiley in 1997. His core observation still drives the method: in many strategies, winning trades rarely move far against you first, so the adverse excursion of winners tells you where a stop stops being useful.
Excursions can be measured in price, points, ticks, percent or R (multiples of the initial risk). R and ATR multiples are the most useful when you compare trades across different symbols or volatility levels.
Where to find MAE and MFE in TradingView
TradingView's Strategy Tester already calculates them. As of October 2026, TradingView's help centre names the List of Trades columns Favorable excursion and Adverse excursion. Older versions of the report, and many guides, call them Run-up and Drawdown. They are the MFE and MAE of each trade, shown in currency and as a percentage of the entry price.
Export the List of Trades and you have both values for every trade, ready for a spreadsheet.
How to calculate MAE and MFE from OHLC data
If your platform doesn't report them, you can calculate them from candles. For each trade, take every bar from the entry bar to the exit bar:
- Find the lowest low and the highest high across those bars.
- For a long, MAE is entry price minus the lowest low, and MFE is the highest high minus entry price.
- For a short, MAE is the highest high minus entry price, and MFE is entry price minus the lowest low.
- Divide by the initial risk (entry to stop distance) to express both in R.
In Excel or Google Sheets, with bar times in column A, highs in B and lows in C on one sheet, and each trade's entry and exit times on another, MINIFS and MAXIFS do the lookup:
Lowest low:   =MINIFS(Bars!C:C, Bars!A:A, ">="&EntryTime, Bars!A:A, "<="&ExitTime)
Highest high: =MAXIFS(Bars!B:B, Bars!A:A, ">="&EntryTime, Bars!A:A, "<="&ExitTime)
Replace EntryTime and ExitTime with the cells holding each trade's times.
Pitfalls that distort MAE and MFE
- The entry and exit bars. If you entered halfway through a bar, the bar's low may have happened before your fill. The same applies after the exit. Including the full entry and exit bars overstates both excursions, sometimes a lot on higher timeframes.
- Order of the high and low. Within one bar you can't tell whether the high or the low came first. A bar that touched both your stop and your target is ambiguous. Lower-timeframe data, or tick data, resolves most of these cases.
- Stops cap MAE. A trade stopped out at 1R can never show an MAE much beyond 1R, so losers' MAE mostly reflects your current stop, not how far price would have gone. The winners are the informative group.
- Sample size. Percentiles from 40 trades are unstable. As a rough guide, aim for 100 or more trades, and at least 30 in any group you set a separate rule for.
- Mixed conditions. Excursions in a quiet session and a volatile one belong to different distributions. Normalise by ATR or split by condition before setting one rule for both.
Reading the MAE scatter plot
The classic chart puts MAE on the horizontal axis and each trade's final result on the vertical axis, with winners and losers in different colours. What you're looking for:
- Winners clustered at small MAE. If most winners never went more than, say, 0.4R against you, a stop at 1R is giving losers room that winners rarely needed.
- A gap or thinning point. Many strategies show a point beyond which almost no winners exist. That is the natural stop distance for the strategy.
- Losers spread to the stop. Losers that run all the way to the stop after passing the winners' cluster were, in hindsight, not going to recover.
Setting a stop from the MAE of winners
A common starting point is to place the stop just beyond a high percentile of winners' MAE, often the 80th to 95th percentile. In a spreadsheet, with winners' MAE in R in column F:
=PERCENTILE.INC(F2:F200, 0.9)If that returns 0.45R, 90% of winners never went more than 0.45R against you. A stop slightly beyond it would have kept those winners.
That is only half of the trade-off. A tighter stop does three things at once:
- It turns the winners beyond the new stop into losses, so you lose their whole profit, not just the extra drawdown.
- It shrinks the losses on losers that would have run to the old stop.
- It changes position size, if you size by risk, which changes every result in R.
Which effect wins depends on your trades, and the scatter plot can't tell you the net. The only reliable answer is to replay the trades with the new stop.
Setting targets from MFE
MFE answers a different question: how much profit did trades offer before they closed? Useful views:
- MFE distribution of all trades. If the median trade reaches 1.2R of favourable excursion, a fixed 3R target will rarely be hit, and a 1R target would have been hit by more than half of trades.
- MFE vs final result. Trades that reached +1R and then closed at a loss suggest a breakeven or trailing rule might help. The gap between MFE and the final profit is the profit given back.
- MFE of losers. If many losers went well into profit first, the exit, not the entry, is the problem.
Targets set from MFE percentiles carry the same trade-off as stops: a closer target is hit more often but cuts off the trades that would have run. Weigh it with expectancy, not win rate.
Testing a new stop or target on the same trades
Once the analysis suggests a change, test it before you edit the strategy. Take the trades the strategy already took, keep the same entries, and replay each trade on real candles with the new stop, target, breakeven or trailing rule. Compare the replayed results with the originals side by side: profit factor, expectancy, drawdown and the number of trades that changed outcome.
Tessera's Exit Placement report shows how far price ran for and against each imported trade, with suggested stop and target distances by market context and the sample size behind each one. The simulator then replays your trades on real candles with a different stop, target, breakeven, trailing or time-based exit, so you can compare runs before changing any code. It works on the trades you already have; it doesn't generate new trades or model tick-by-tick fills, so treat its results as a filter for ideas, then confirm the winning version in a full backtest.
If you want to see the excursions for your own strategy first, the free Entry Analysis report works from a TradingView strategy tester export or a trade history file.
To try this without a spreadsheet, paste your trades into the free MAE and MFE calculator for a scatter of each trade and a suggested stop distance from your winners' MAE. Tessera's statistics dashboard keeps the same figures for every strategy you import.
Frequently asked questions
- What is the difference between MAE and MFE?
- MAE is the furthest a trade moved against you while it was open. MFE is the furthest it moved in your favour. Together they describe the path of a trade, not just its final result.
- How do you use MAE to set a stop loss?
- Look at the MAE of your winning trades and find the distance that most of them stayed within, often the 80th to 95th percentile. A stop just beyond that keeps most winners. Then replay all trades with that stop to check the net effect, because some winners will now be stopped out.
- Does TradingView show MAE and MFE?
- Yes. The Strategy Tester's List of Trades includes Favorable excursion and Adverse excursion columns, which older versions labelled Run-up and Drawdown. They are each trade's MFE and MAE, and they are included when you export the list.
- How many trades do I need for MAE analysis?
- As a rough guide, at least 100 trades in total and at least 30 winners in any group you set a separate stop for. Percentiles from smaller samples move a lot when a few trades are added.
- Who invented maximum adverse excursion?
- The method is usually credited to John Sweeney, who described it in "Maximum Adverse Excursion: Analyzing Price Fluctuations for Trading Management", published by Wiley in 1997.
Keep reading
 Trading metrics
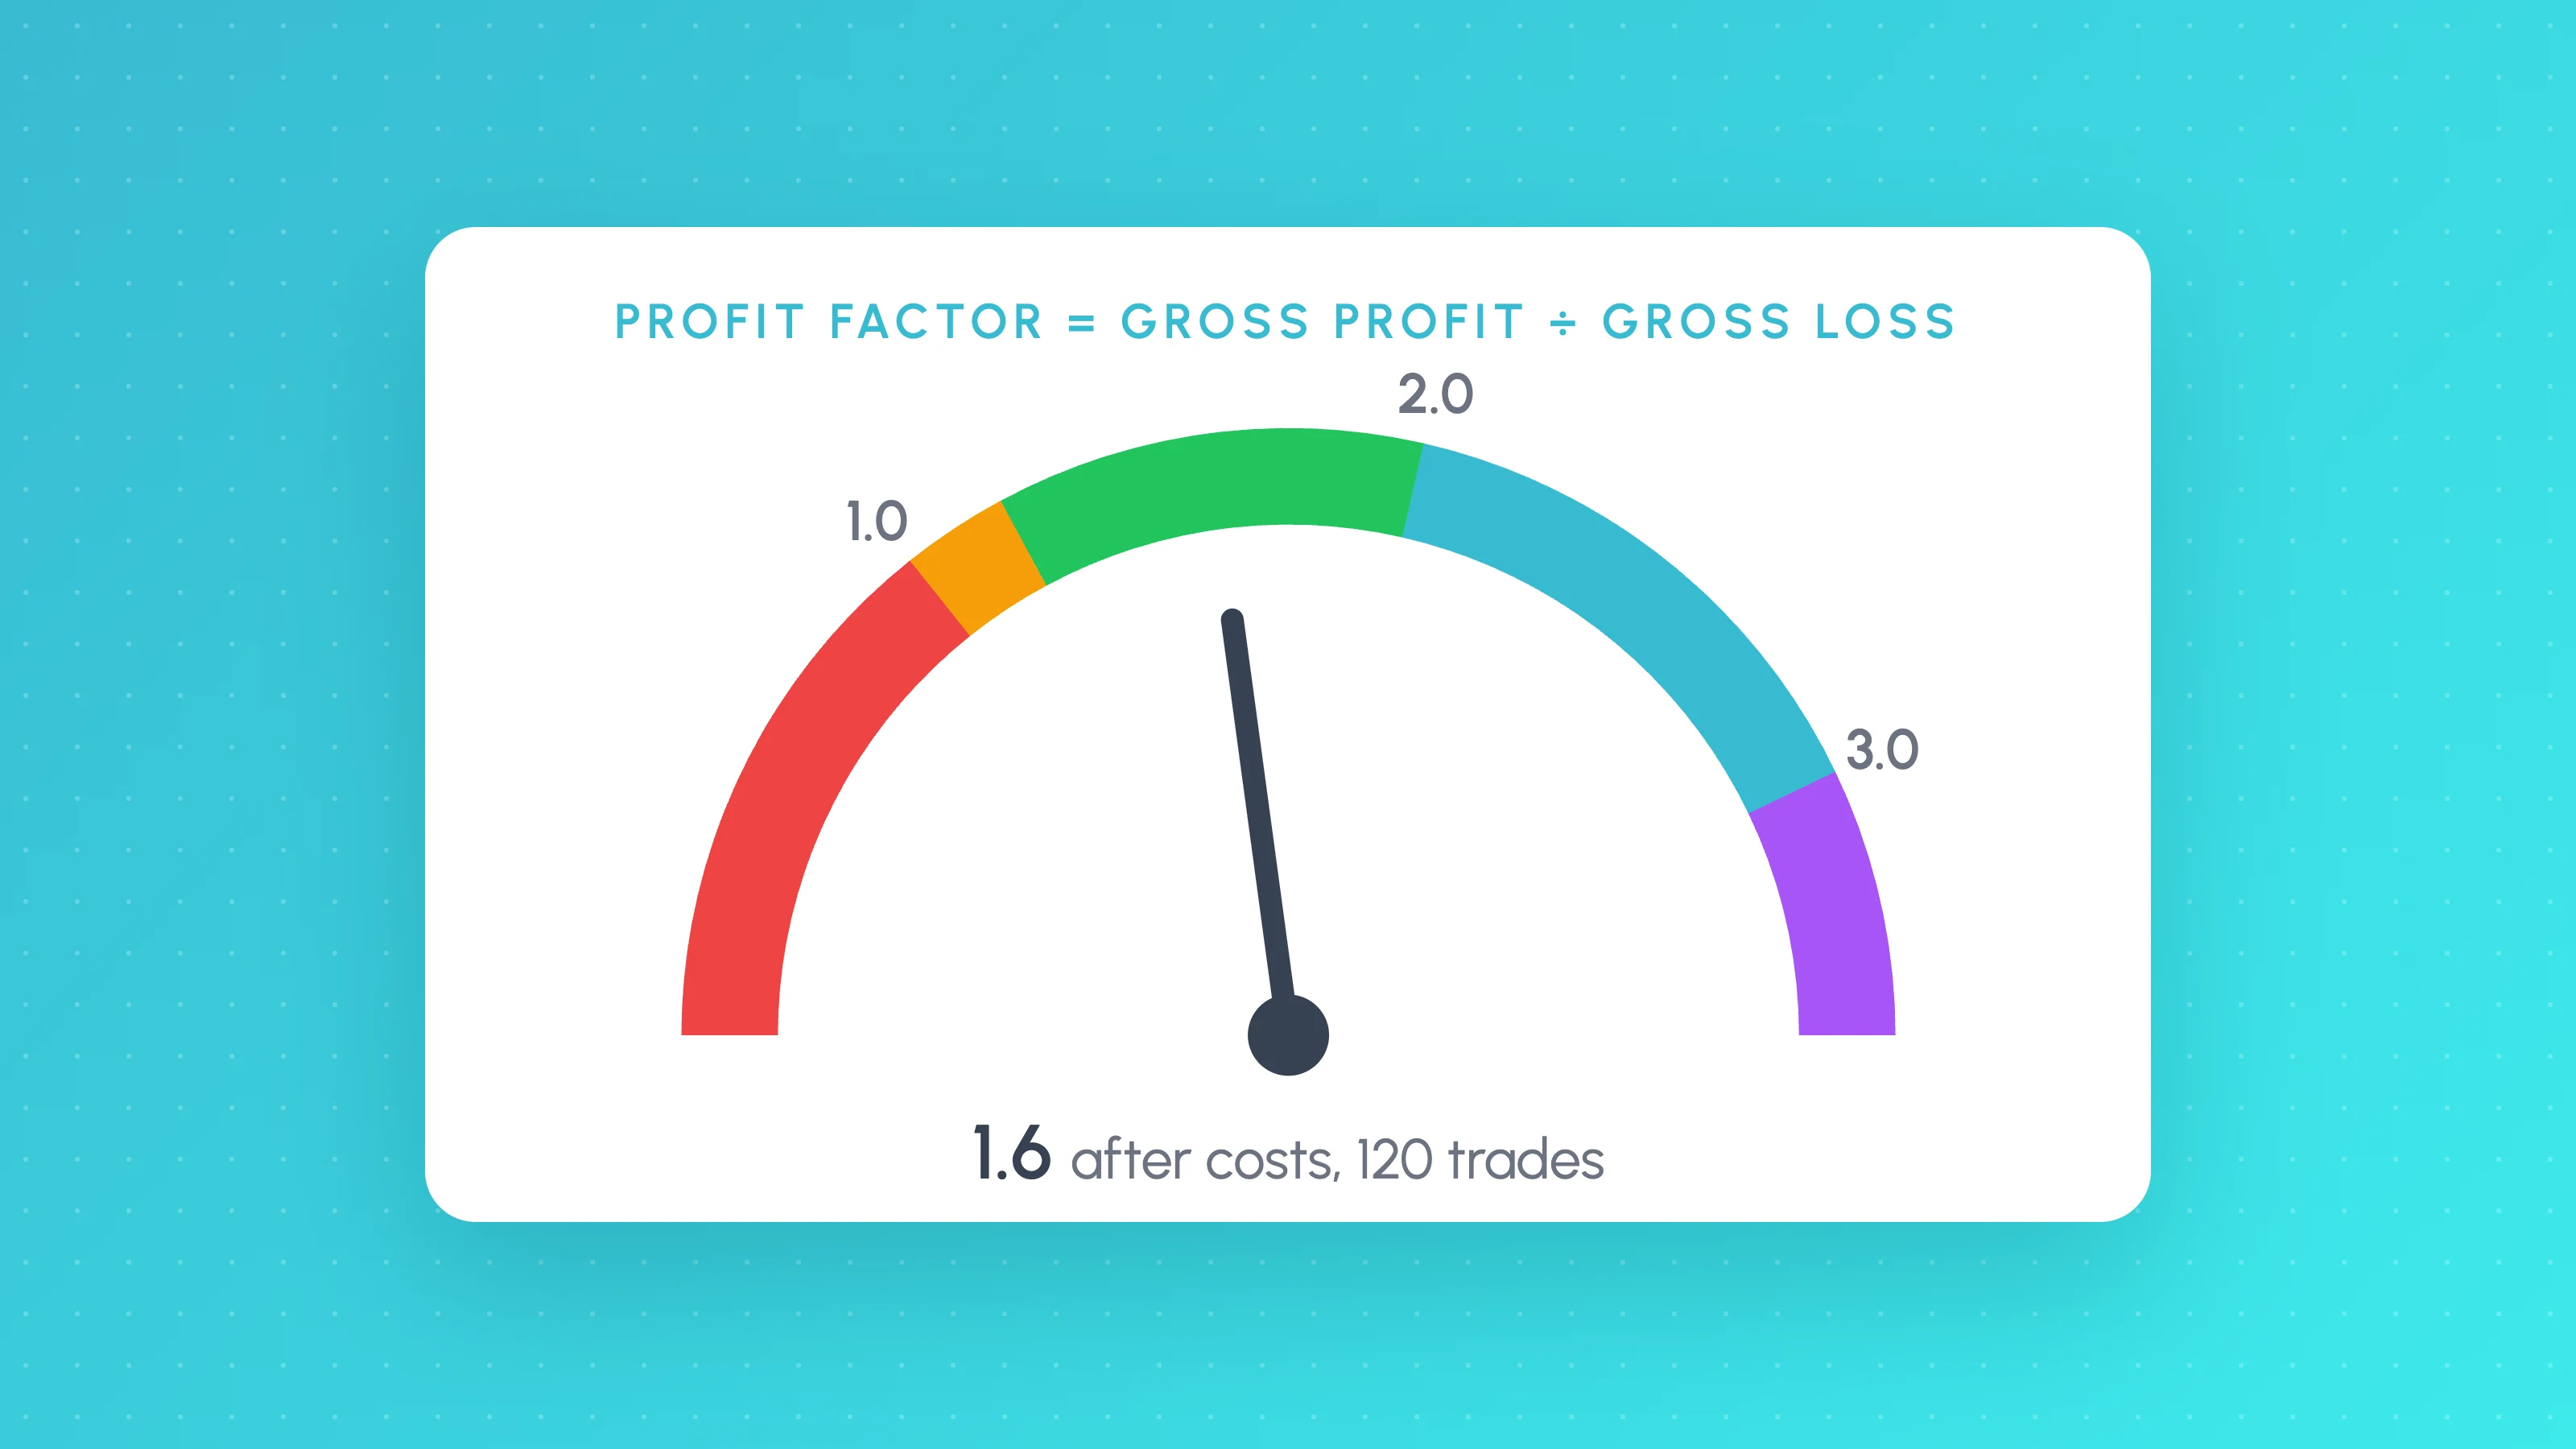
What Is a Good Profit Factor? Formula, Ranges and Red Flags
A good profit factor is usually 1.3 to 2.0 after costs on 100+ trades. See the formula, a worked example, a spreadsheet calculator and why above 3 is a warning.
 Trading metrics
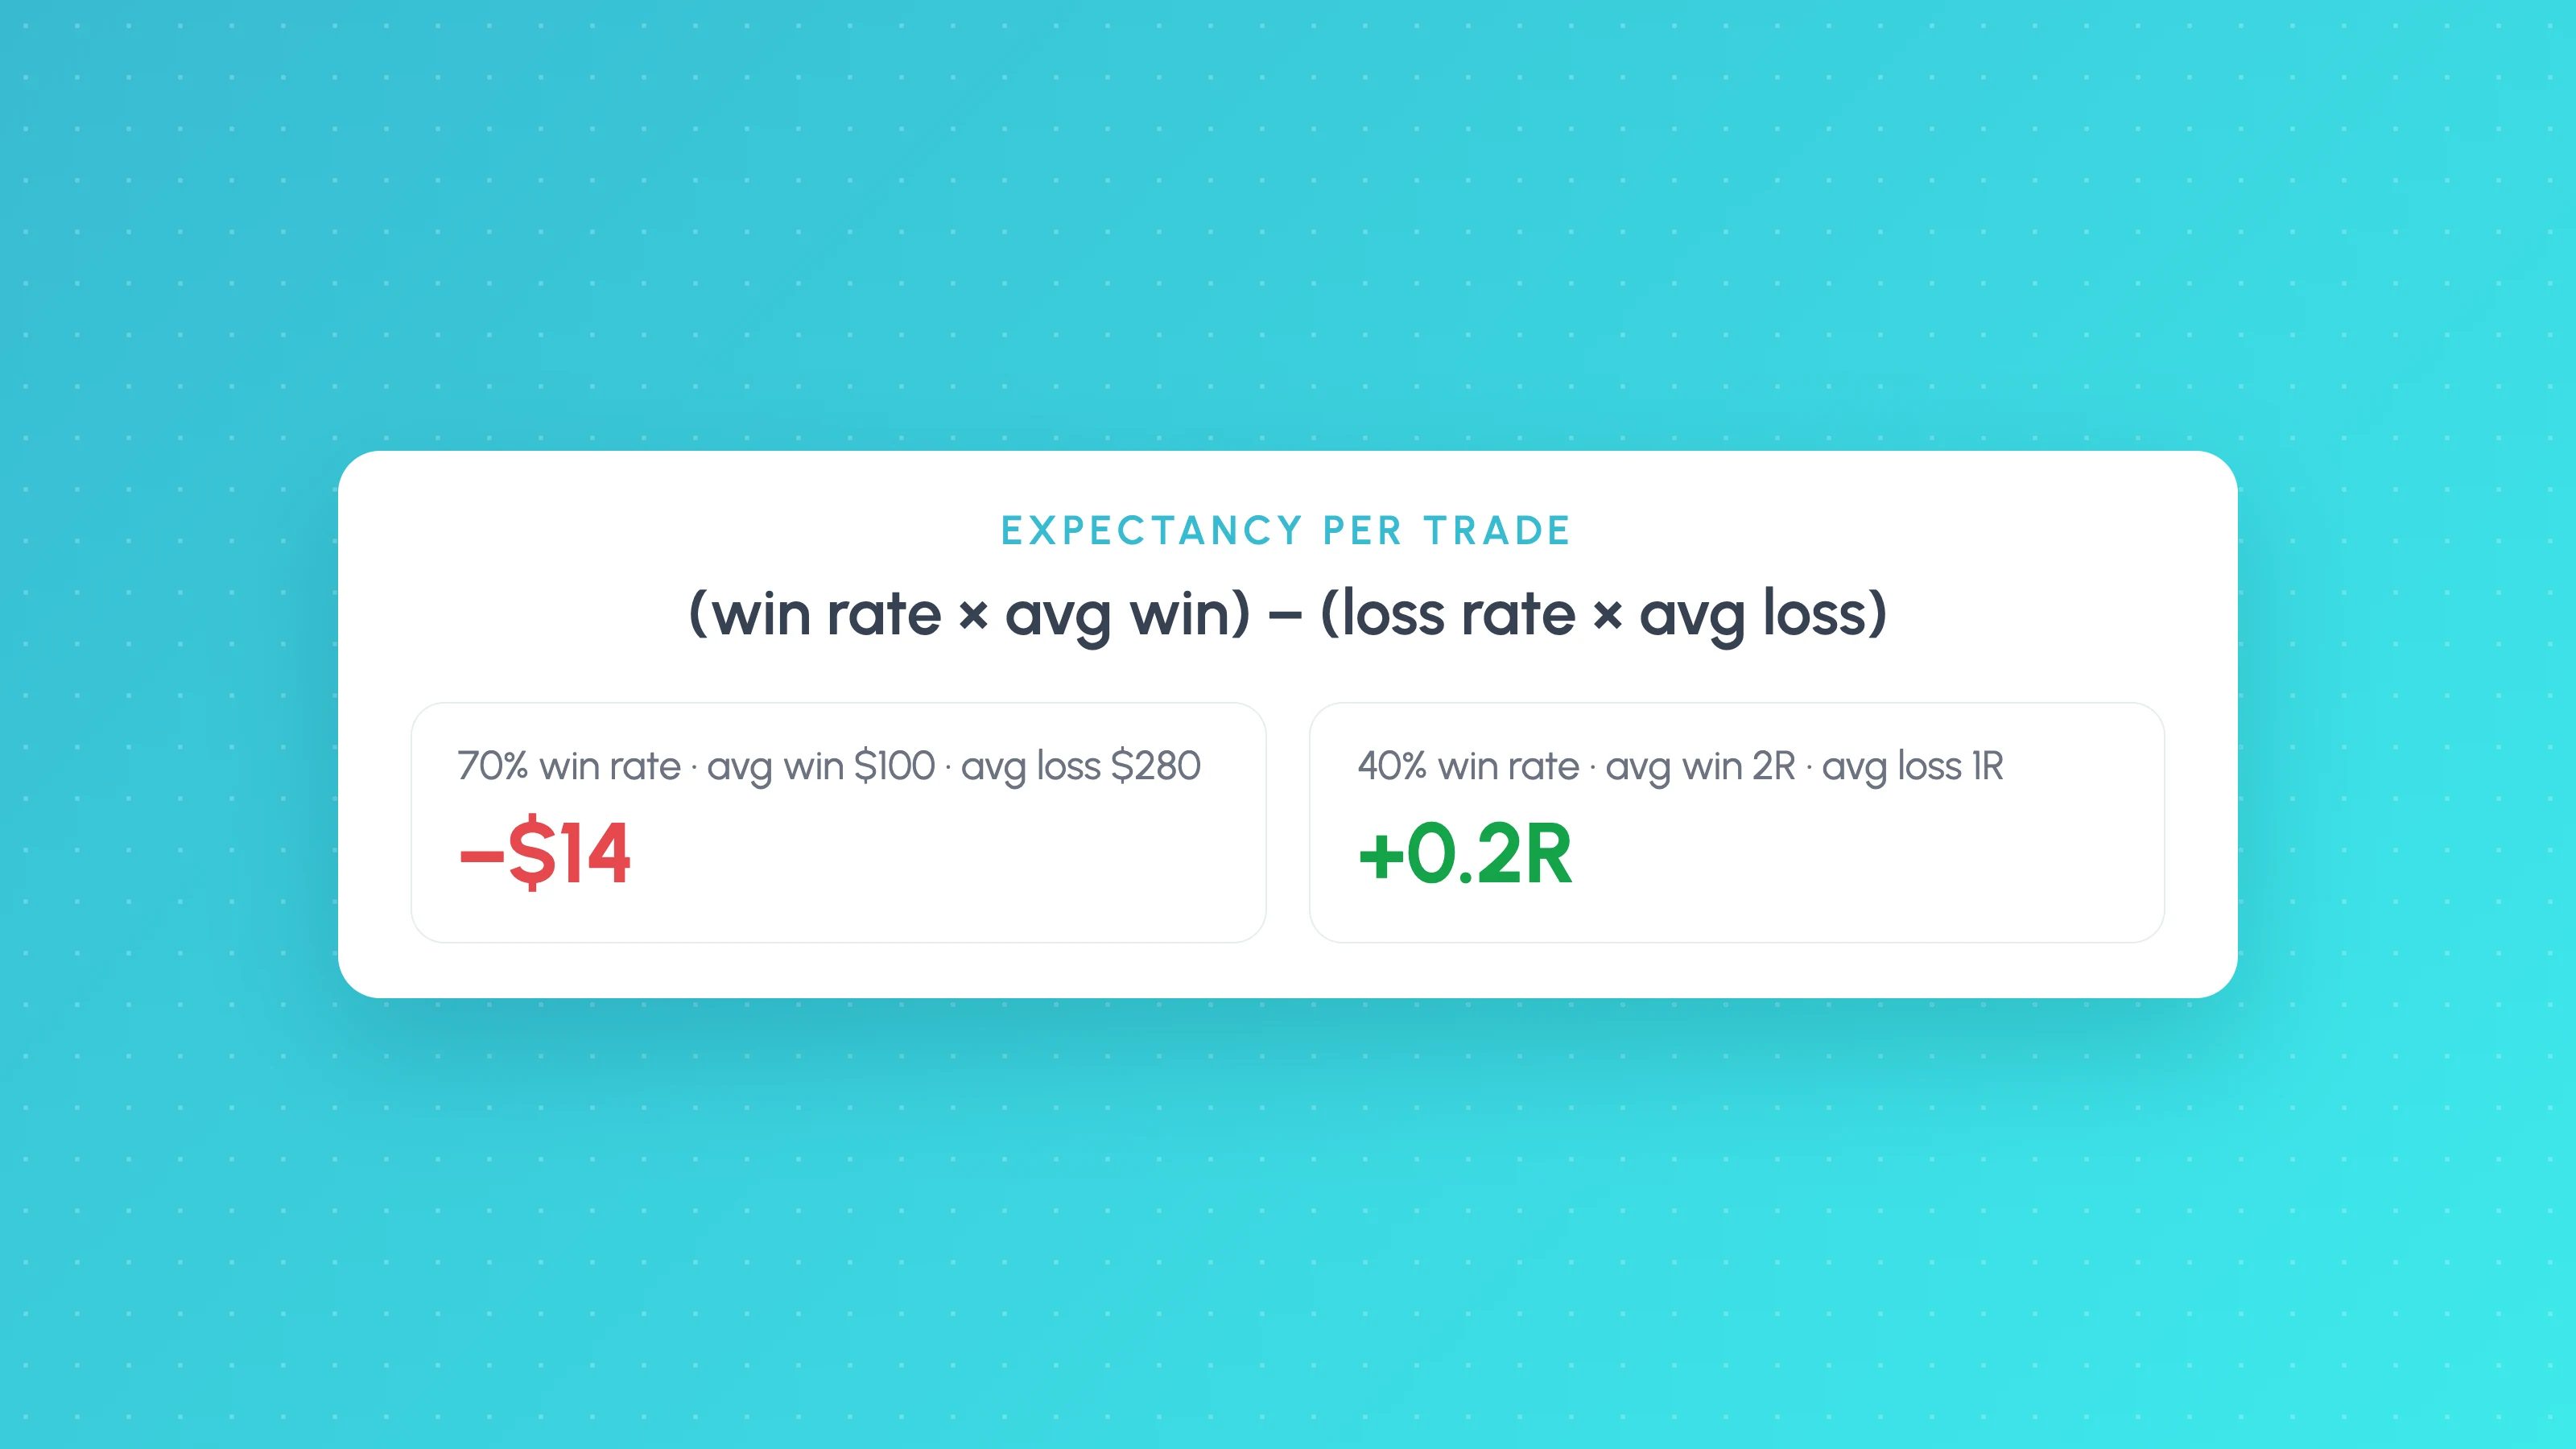
Trading Expectancy Formula: In Currency and R, With Examples
Expectancy = win rate x average win minus loss rate x average loss. Worked examples in currency and R, why 70% win rates lose, and spreadsheet formulas.
 TradingView backtests
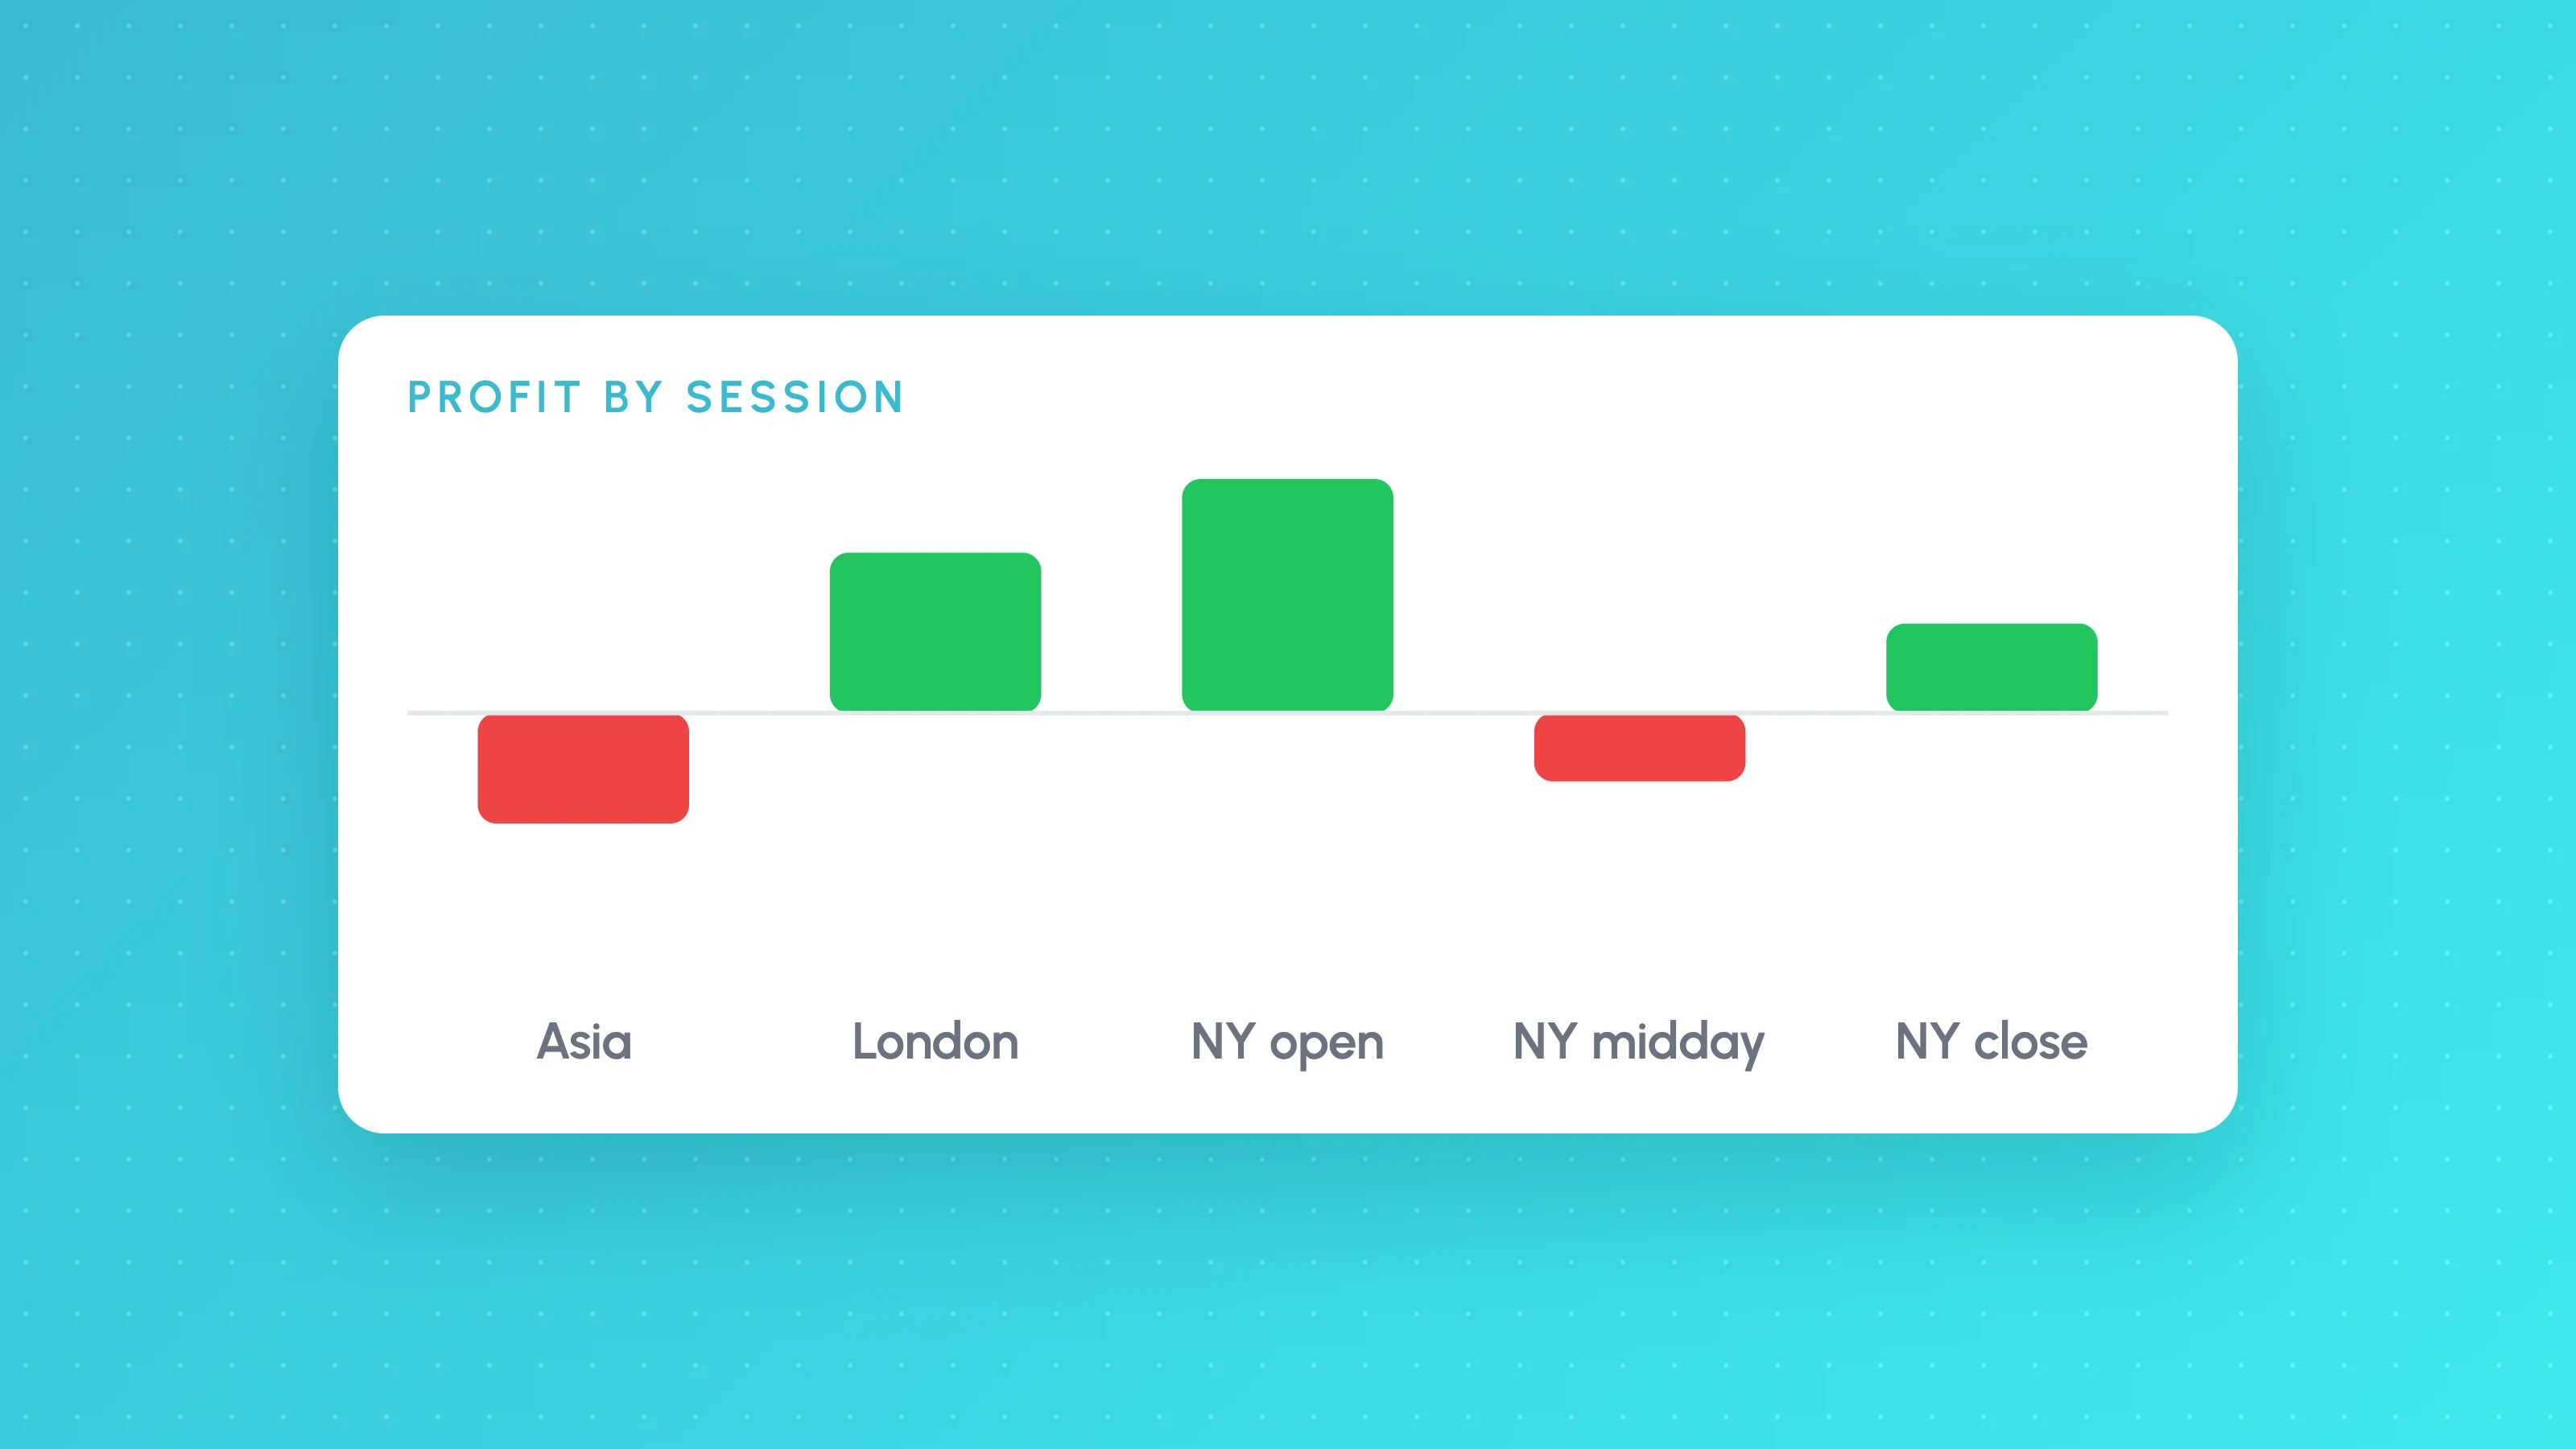
How to Analyse a TradingView Backtest by Session, Weekday and Hour
Analyse a TradingView backtest beyond the summary: split trades by session, weekday, hour, volatility and direction, check sample sizes, then test the rule.