
MAE and MFE Calculator
Maximum adverse excursion (MAE) is how far a trade went against you before it closed; maximum favourable excursion (MFE) is how far it went your way. Paste your trades to get both for every trade, a scatter plot of MAE against the result, and stop distances taken from your winners' MAE.
Trades
15
10 winners, 5 losers
Median MFE, all trades
0.00470
Typical best point reached
Avg giveback, winners
0.00074
MFE minus final result
Losers that were up first
0
MFE at least as big as the final loss
Stop distances from winners' MAE
A starting point, not an answer: a stop just beyond these levels would have kept that share of winners, but it also turns the winners beyond it into losses. Replay the trades with the new stop before using it.
| Percentile | Winners' MAE | Winners beyond | Losers beyond |
|---|---|---|---|
| 80th | 0.00116 | 2 | 5 |
| 90th | 0.00144 | 1 | 5 |
| 95th | 0.00162 | 1 | 5 |
Based on 10 winners. Percentiles from fewer than about 30 are unstable.
MAE against result
Hover or tap a dot for its values
MAE (distance against the trade) →
MAE and MFE per trade
| Line | MAE | MFE | Result |
|---|---|---|---|
| 2 long | 0.00090 | 0.00520 | 0.00400 |
| 3 long | 0.00260 | 0.00060 | −0.00240 |
| 4 short | 0.00060 | 0.00480 | 0.00400 |
| 5 long | 0.00110 | 0.00510 | 0.00450 |
| 6 short | 0.00280 | 0.00160 | −0.00260 |
| 7 long | 0.00060 | 0.00540 | 0.00480 |
| 8 short | 0.00080 | 0.00490 | 0.00420 |
| 9 long | 0.00280 | 0.00170 | −0.00260 |
| 10 long | 0.00180 | 0.00520 | 0.00410 |
| 11 short | 0.00030 | 0.00430 | 0.00380 |
| 12 long | 0.00280 | 0.00040 | −0.00260 |
| 13 short | 0.00140 | 0.00470 | 0.00410 |
| 14 long | 0.00070 | 0.00480 | 0.00440 |
| 15 short | 0.00280 | 0.00090 | −0.00260 |
| 16 long | 0.00060 | 0.00460 | 0.00370 |
How MAE and MFE are calculated
Long:  MAE = Entry − Lowest low      MFE = Highest high − Entry
Short: MAE = Highest high − Entry    MFE = Entry − Lowest low
Result (long) = Exit − Entry         Result (short) = Entry − Exit
The high and low are the extremes while the trade was open. Results are in price units, so for a mix of symbols convert to R (divide by each trade's initial risk) and use the "MAE, MFE, result" input instead.
Suggested stop distances
The calculator sorts your winners' MAE and reports the 80th, 90th and 95th percentiles (linear interpolation, like Excel's PERCENTILE.INC). If the 90th percentile is 0.45R, 90% of winners never went more than 0.45R against you. It also counts how many winners and losers went beyond each level.
That is only half of the trade-off. A tighter stop:
- turns the winners beyond it into losses, losing their whole profit;
- shrinks the losses on losers that would have run to the old stop;
- changes position size if you size by risk, which changes every result in R.
The scatter plot can't give you the net effect. Replaying the trades with the new stop can.
Pitfalls
- Entry and exit bars. Using the full high and low of the entry bar can overstate MAE if the extreme happened before your fill.
- Stops cap losers' MAE.A trade stopped at 1R can't show much more than 1R of MAE, so winners are the informative group.
- Mixed conditions. Quiet and volatile sessions have different excursions; split them before setting one rule for both.
The full method, including where to find MAE and MFE in TradingView, is in our MAE and MFE analysis guide.
 FAQs
Questions about the mae and mfe calculator
Guides behind the maths
 Trading metrics
7 min read
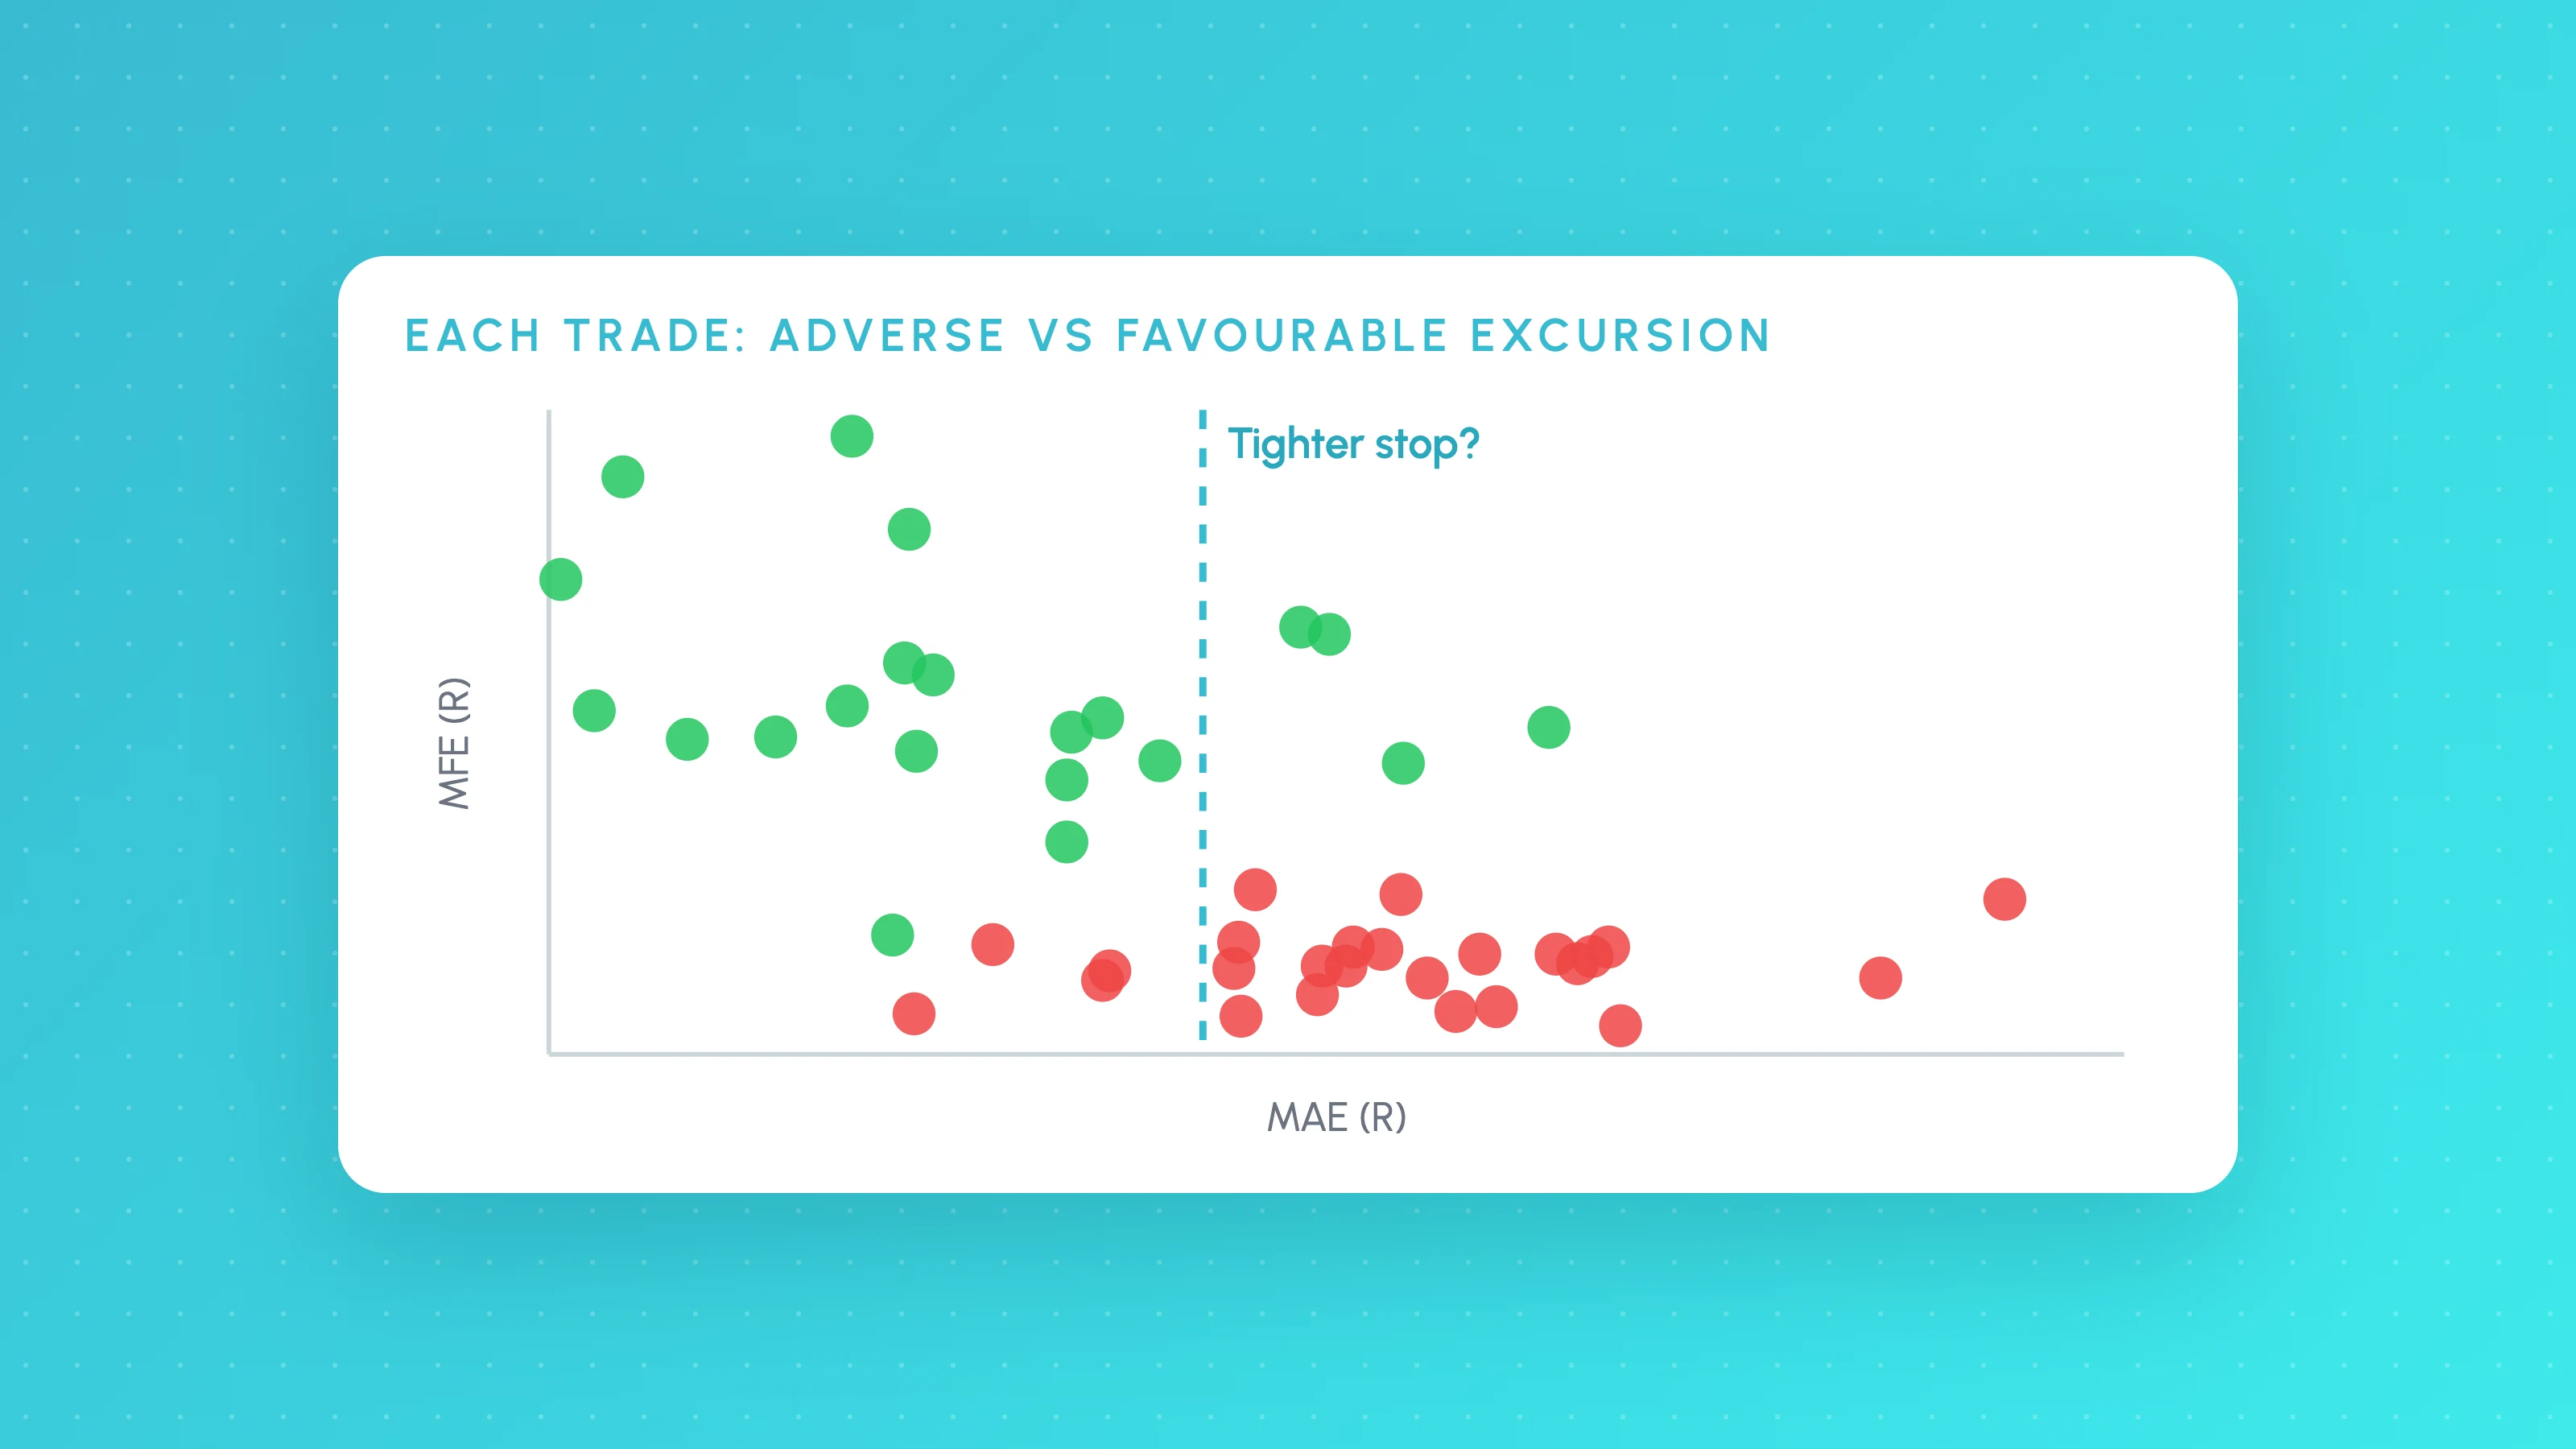
MAE and MFE Analysis: Set Stops and Targets From Your Own Trades
How to calculate MAE and MFE for each trade, read the scatter plots, set stops from winners' MAE and targets from MFE, then test the change on real candles.
 Trading metrics
11 min read
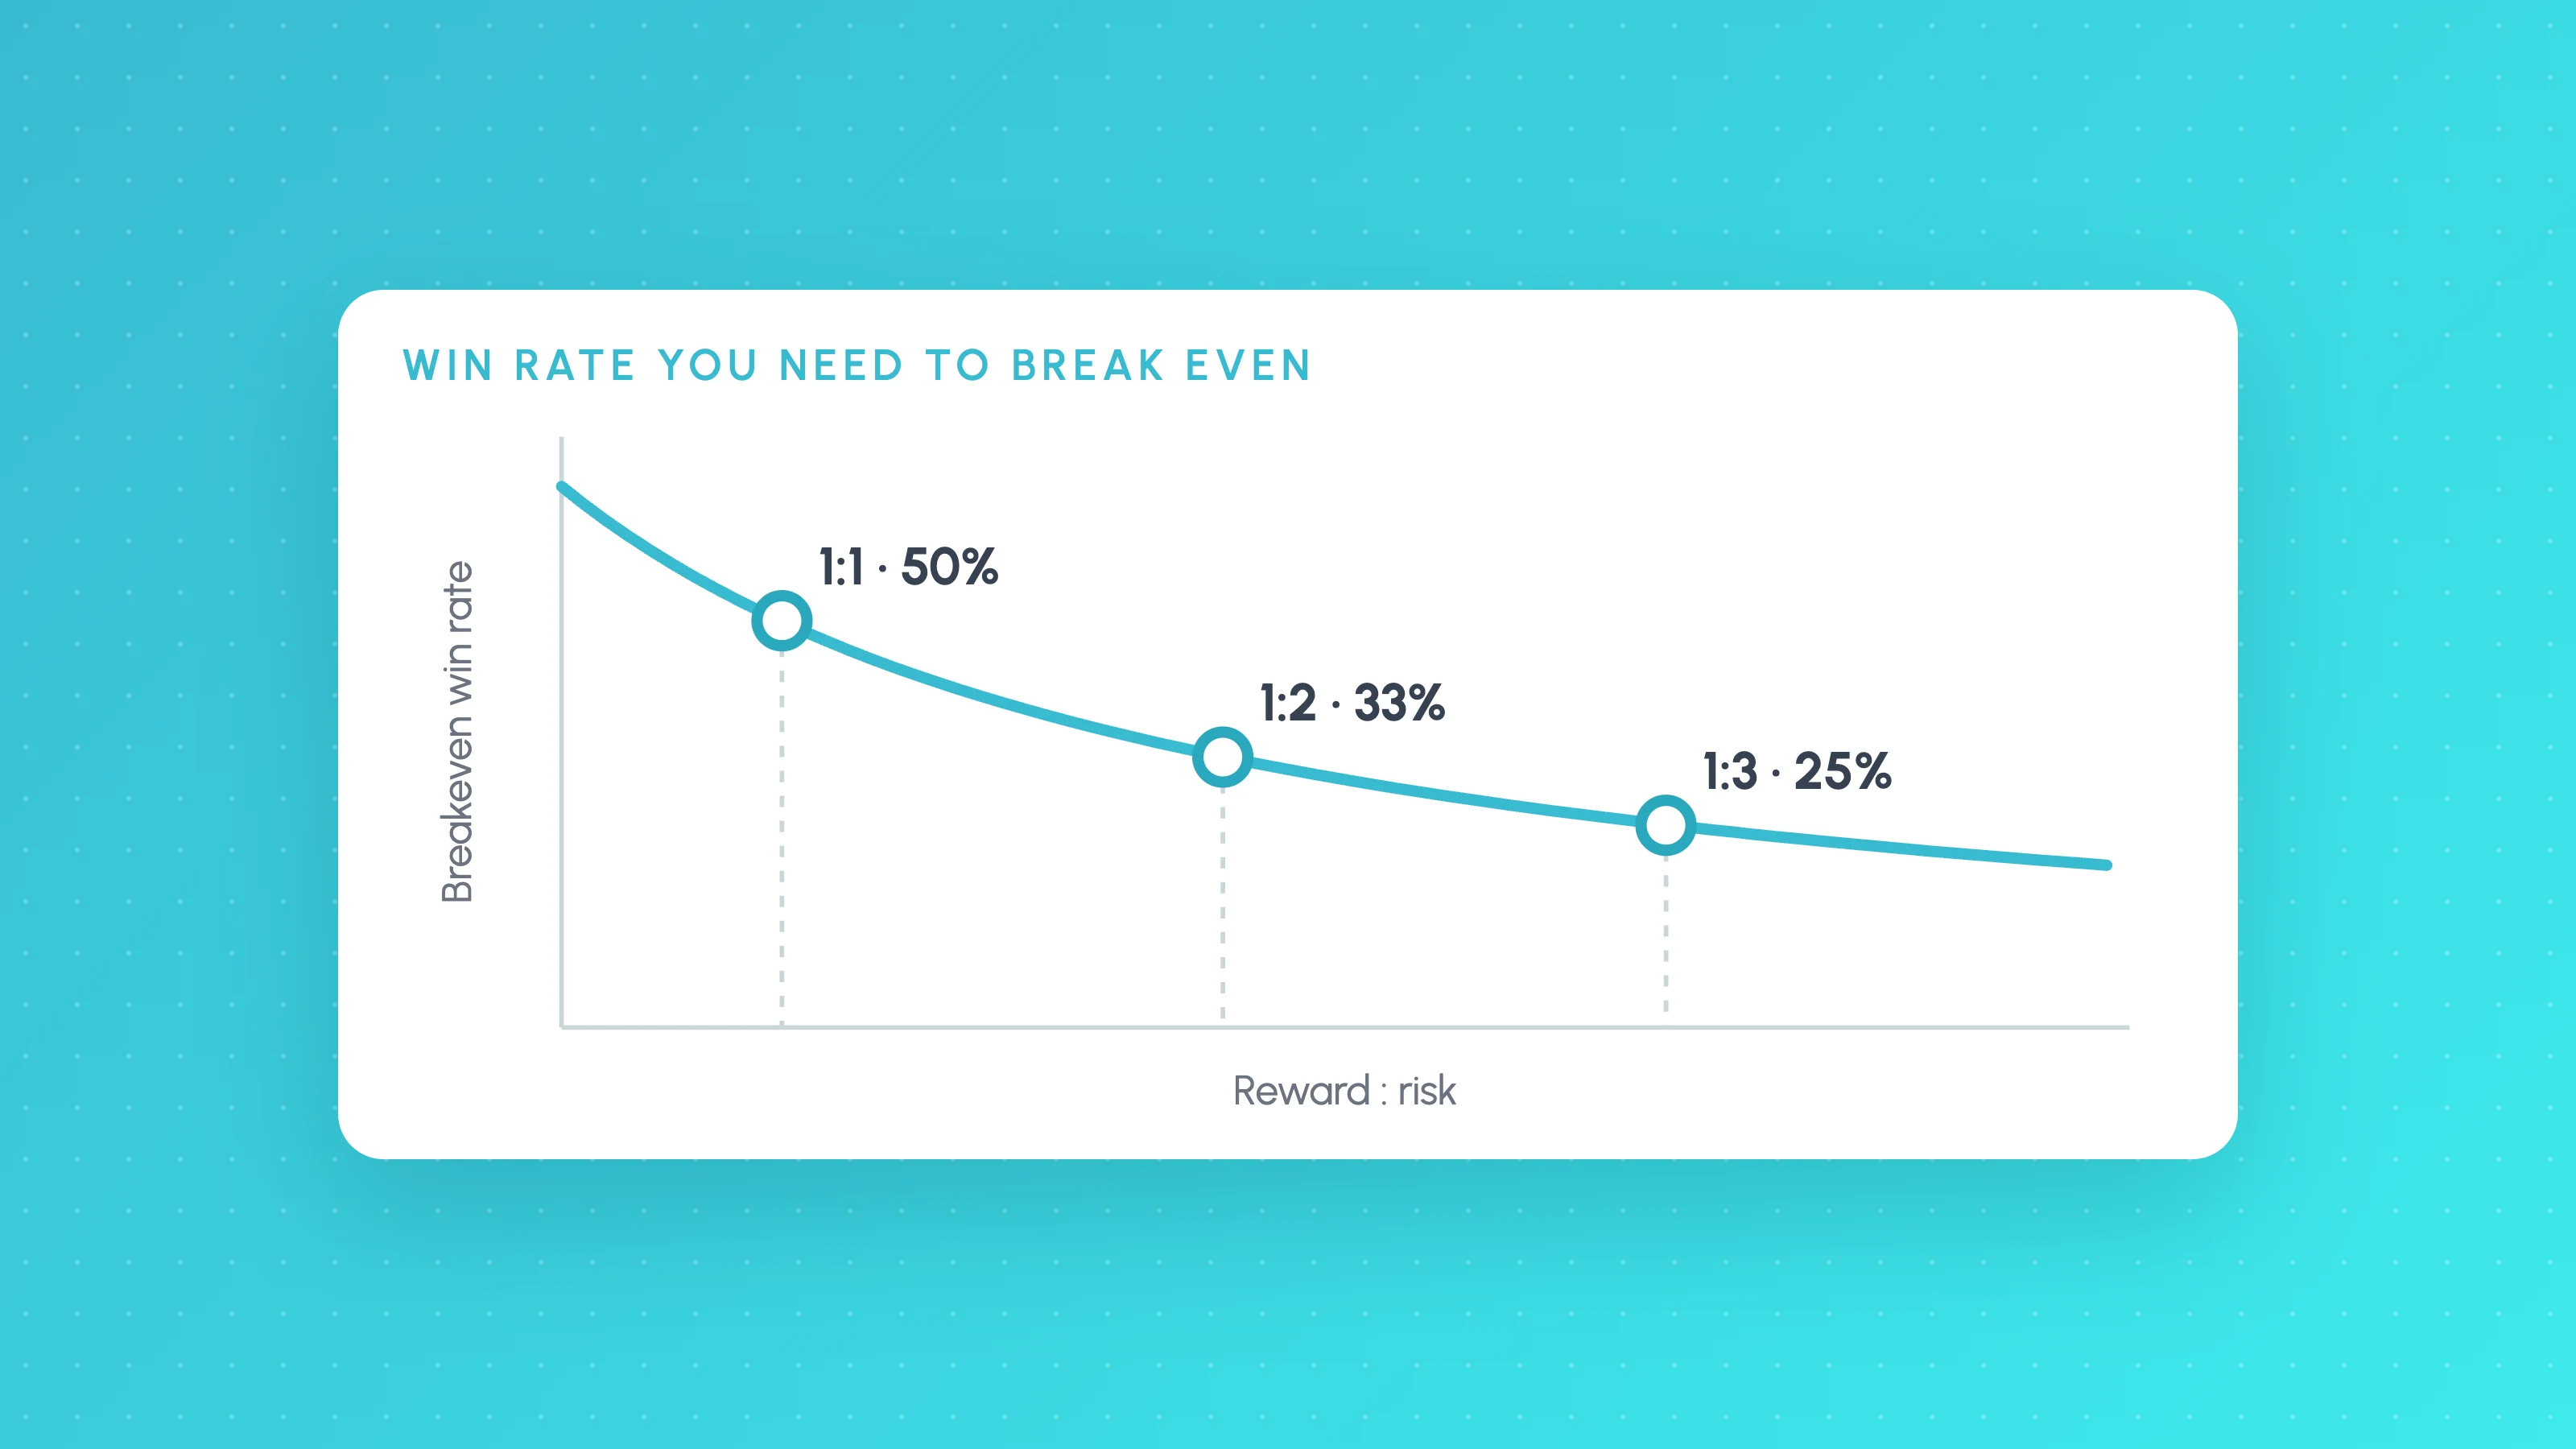
Win Rate vs Risk:Reward: The Breakeven Table for Algo Strategies
Win rate vs risk reward: breakeven win rate = 1 / (1 + R), so 1:2 needs 33.3% before costs. Table from 0.5R to 5R, with costs and spreadsheet formulas.
 Trading metrics
8 min read
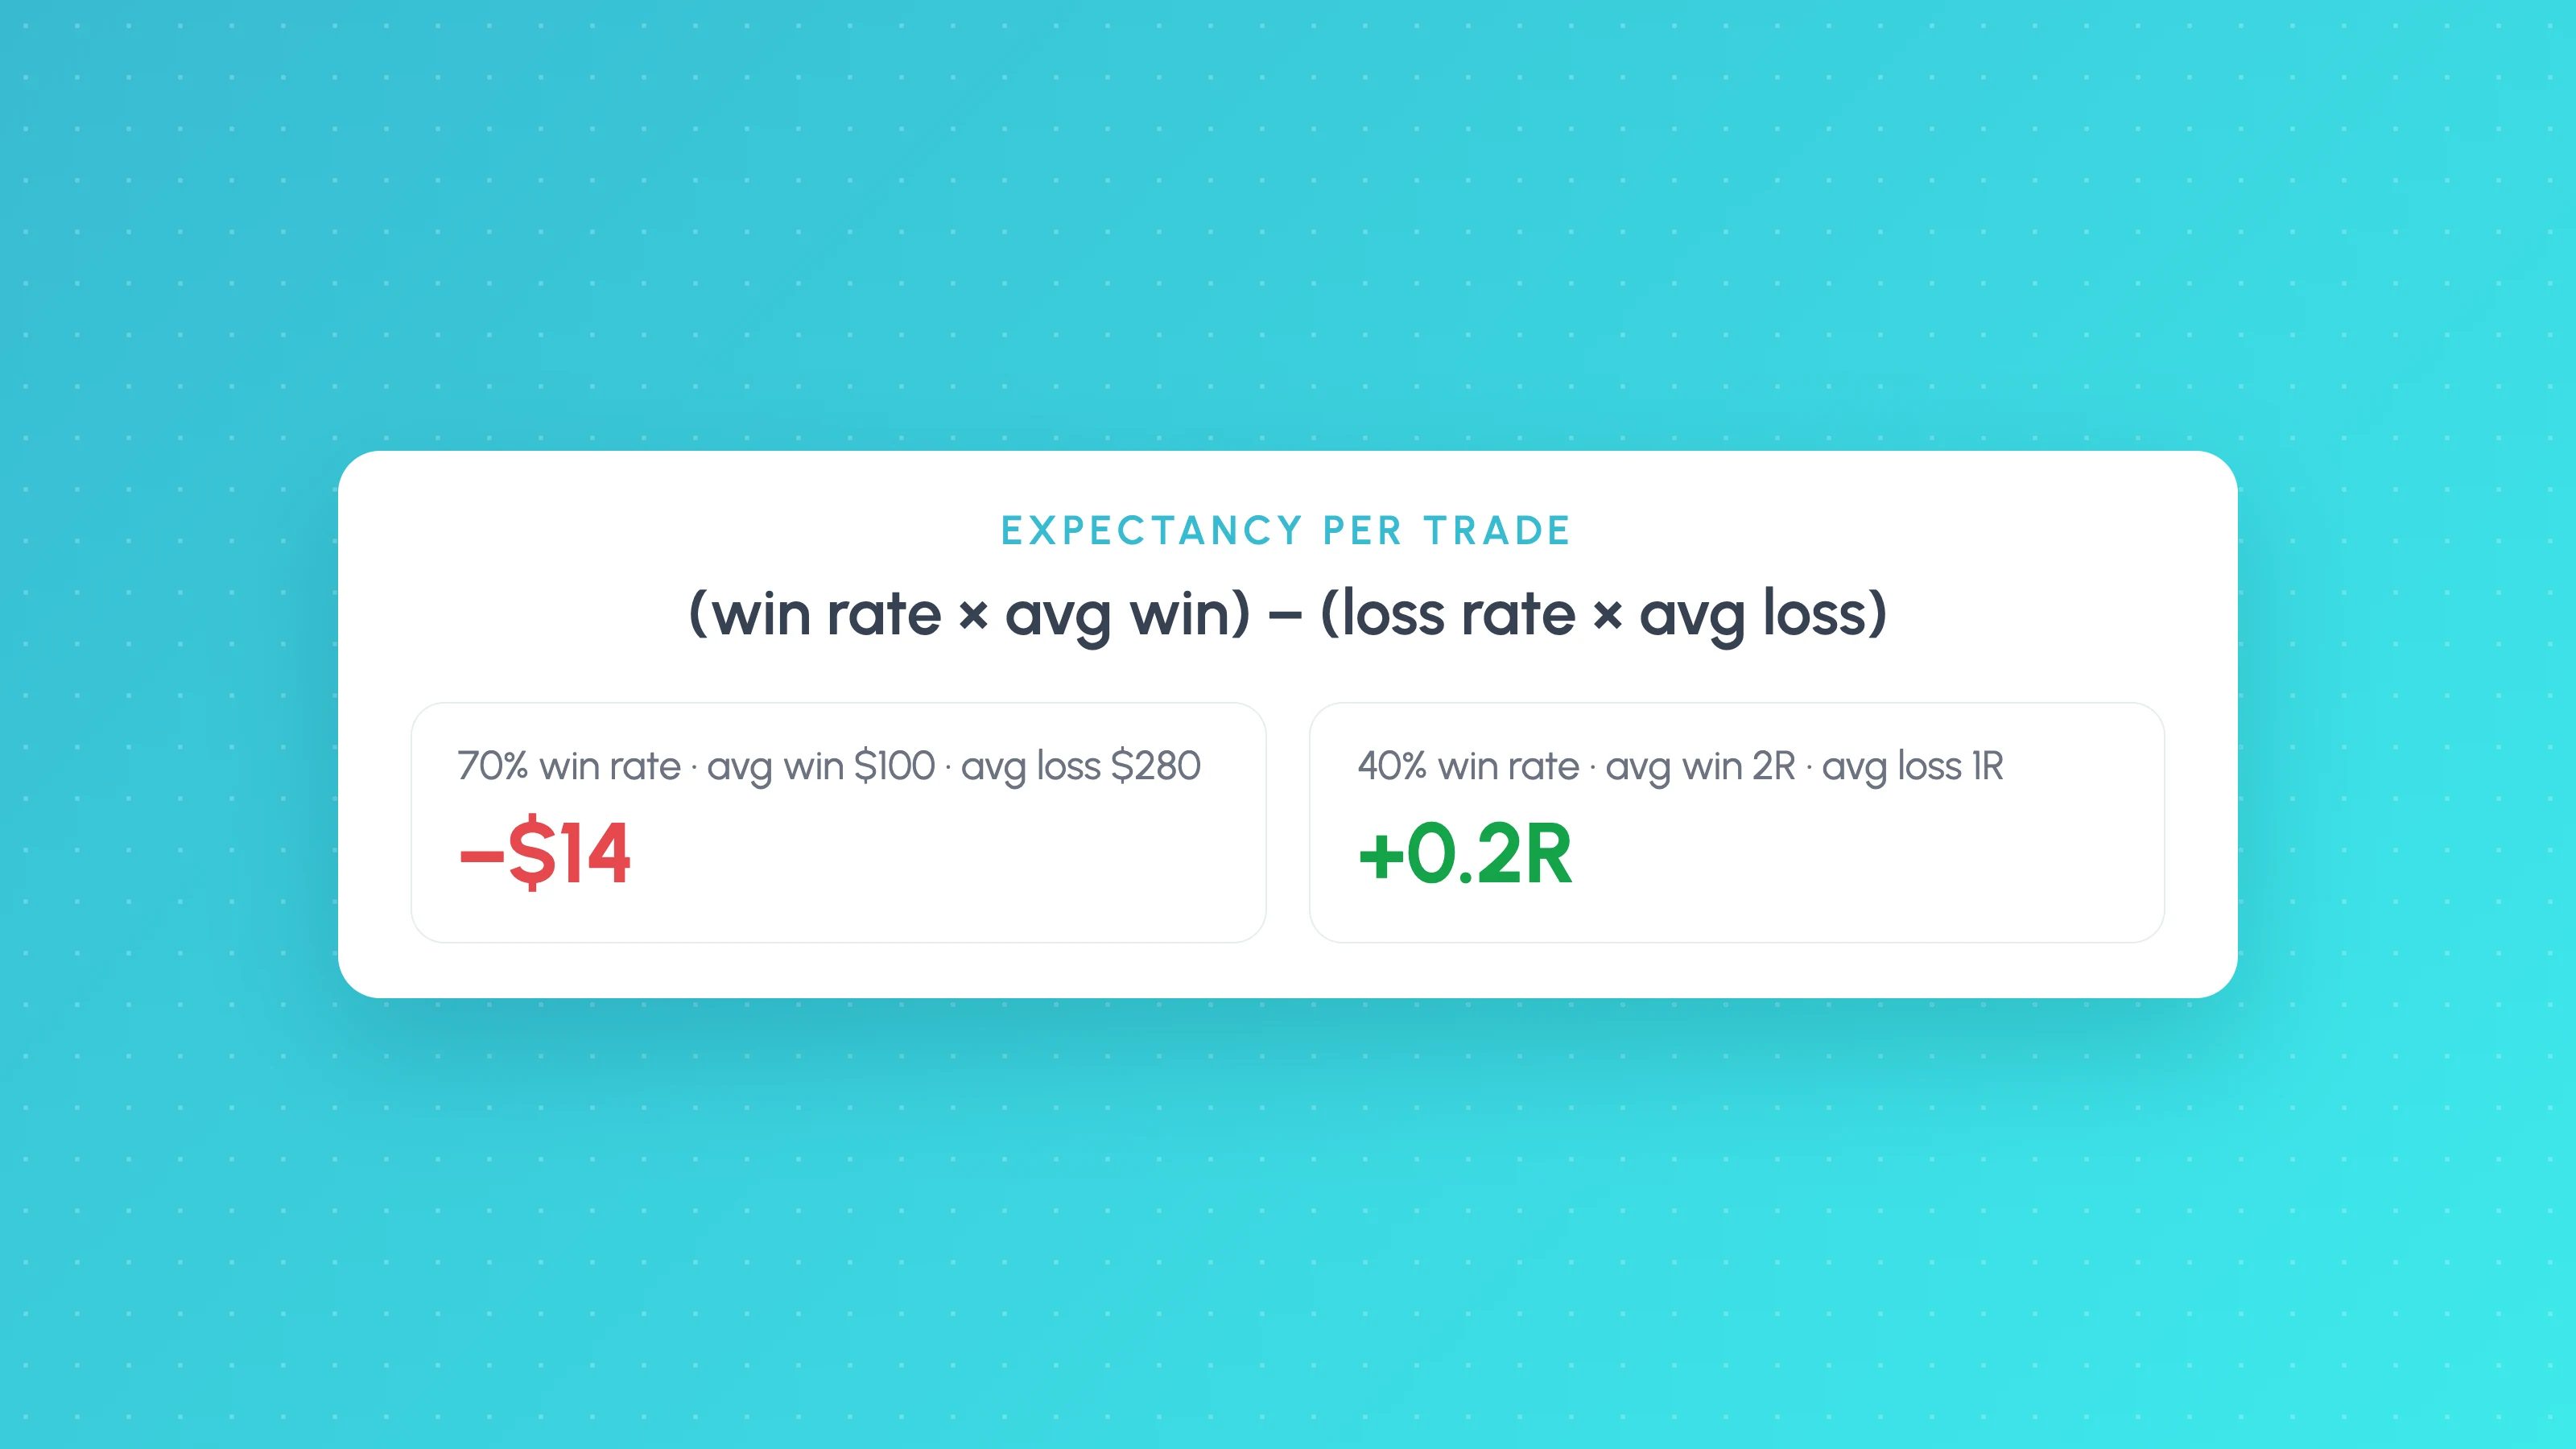
Trading Expectancy Formula: In Currency and R, With Examples
Expectancy = win rate x average win minus loss rate x average loss. Worked examples in currency and R, why 70% win rates lose, and spreadsheet formulas.