
Risk of Ruin Calculator
How likely is a strategy to suffer a drawdown you can't recover from? Enter your win rate, payoff ratio and risk per trade, choose a ruin level such as a 50% drawdown, and this risk of ruin calculator estimates the chance by simulating thousands of accounts.
How risk of ruin is calculated here
Closed-form risk of ruin formulas exist, but most assume a fixed amount at risk or wins and losses of equal size. This calculator uses a Monte Carlo simulation instead, which handles any payoff ratio and compounding position size:
- Each simulated account starts at the same balance.
- Every trade risks your percentage of the current balance. It wins with probability equal to your win rate and gains payoff × the amount risked; otherwise it loses the amount risked.
- The account is ruined if it falls by your ruin level, measured either from the starting balance or from its highest balance so far (a peak-to-trough drawdown).
- After the number of trades you set, the share of ruined accounts is the risk of ruin.
Edge per trade (R) = Win rate × Payoff − Loss rate
Risk of ruin       = Ruined accounts / All simulated accounts
Example
A 45% win rate with a payoff ratio of 1.5 has an edge of 0.45 × 1.5 − 0.55 = +0.125R per trade. At 2% risk the simulated chance of a 50% drawdown from the starting balance is small; at 5% risk the same strategy reaches it far more often. Run the calculator with those inputs to see the numbers, and the comparison table to see how quickly they rise.
Limits of the method
- Trades are independent draws. Real strategies have streaky regimes, which make deep drawdowns more likely.
- Every win is the same size and every loss is exactly 1R. Slippage beyond the stop or outsized winners change the picture; to use your real trade results, try the Monte Carlo simulator.
- The answer depends on how many trades you look ahead: given enough trades, any account can hit a deep enough drawdown.
How win rate and payoff trade off against each other is covered in our guide to win rate vs risk:reward.
 FAQs
Questions about the risk of ruin calculator
Guides behind the maths
 Trading metrics
11 min read
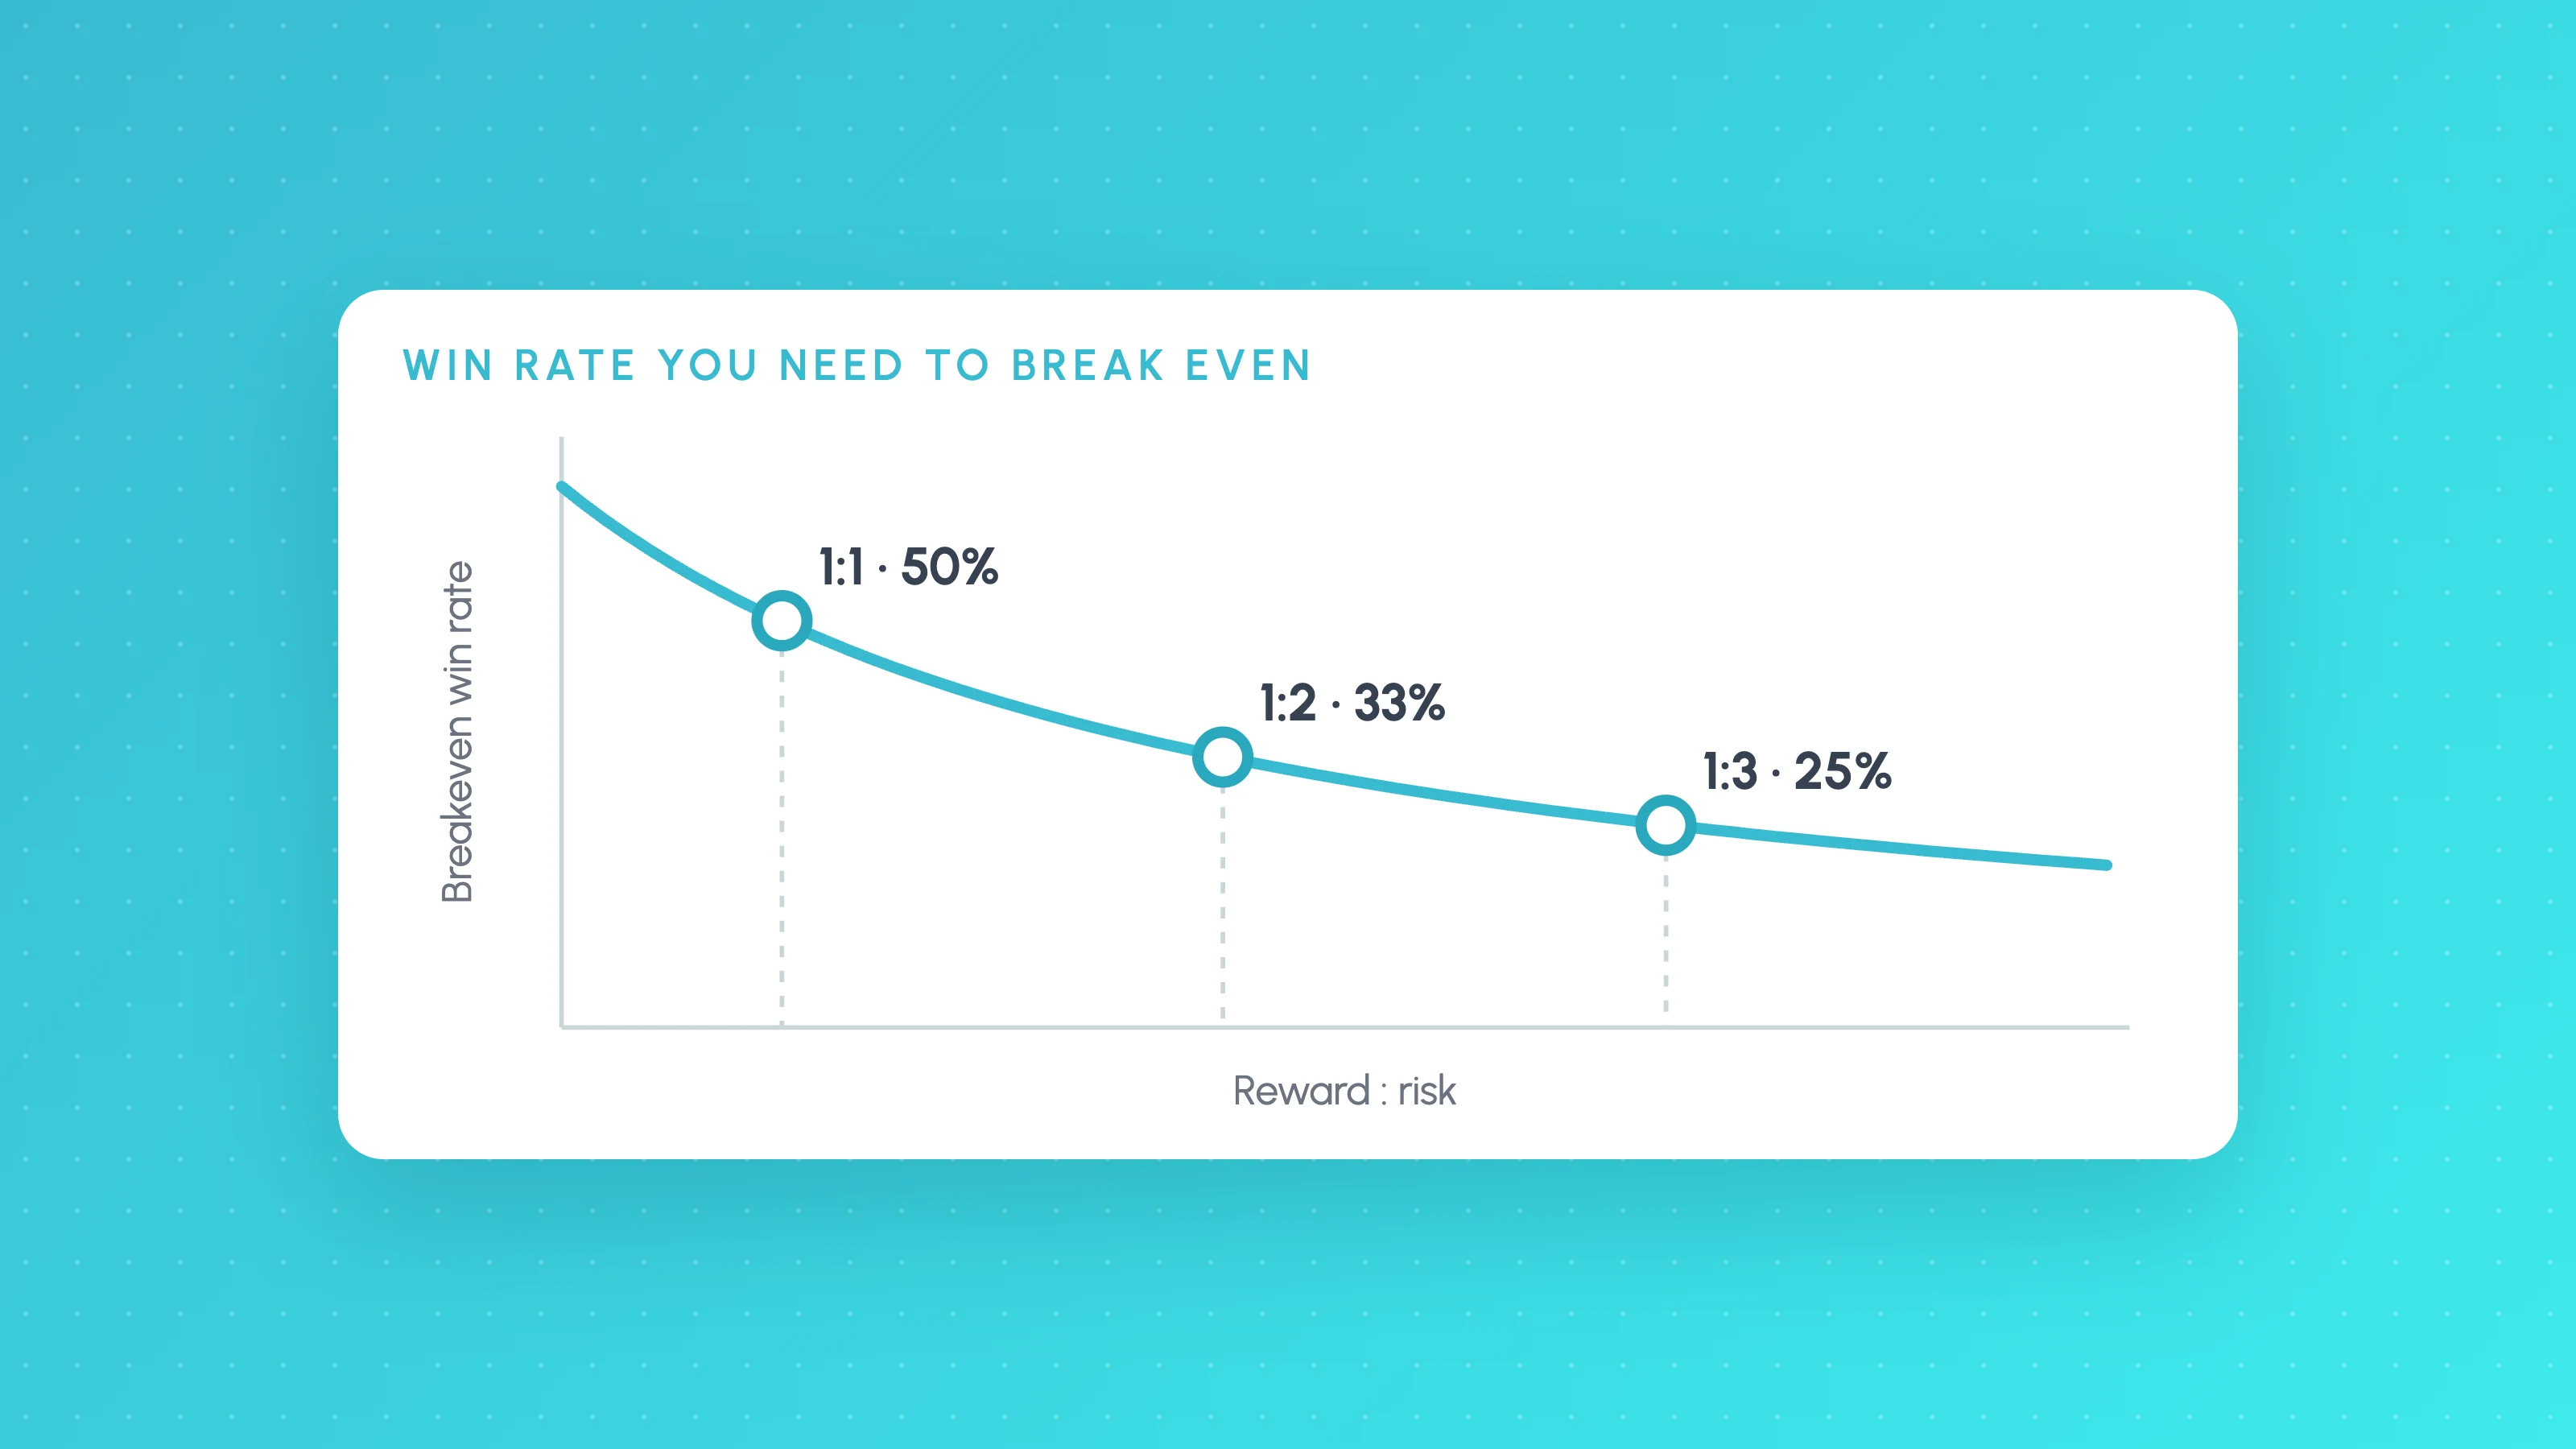
Win Rate vs Risk:Reward: The Breakeven Table for Algo Strategies
Win rate vs risk reward: breakeven win rate = 1 / (1 + R), so 1:2 needs 33.3% before costs. Table from 0.5R to 5R, with costs and spreadsheet formulas.
 Trading metrics
8 min read
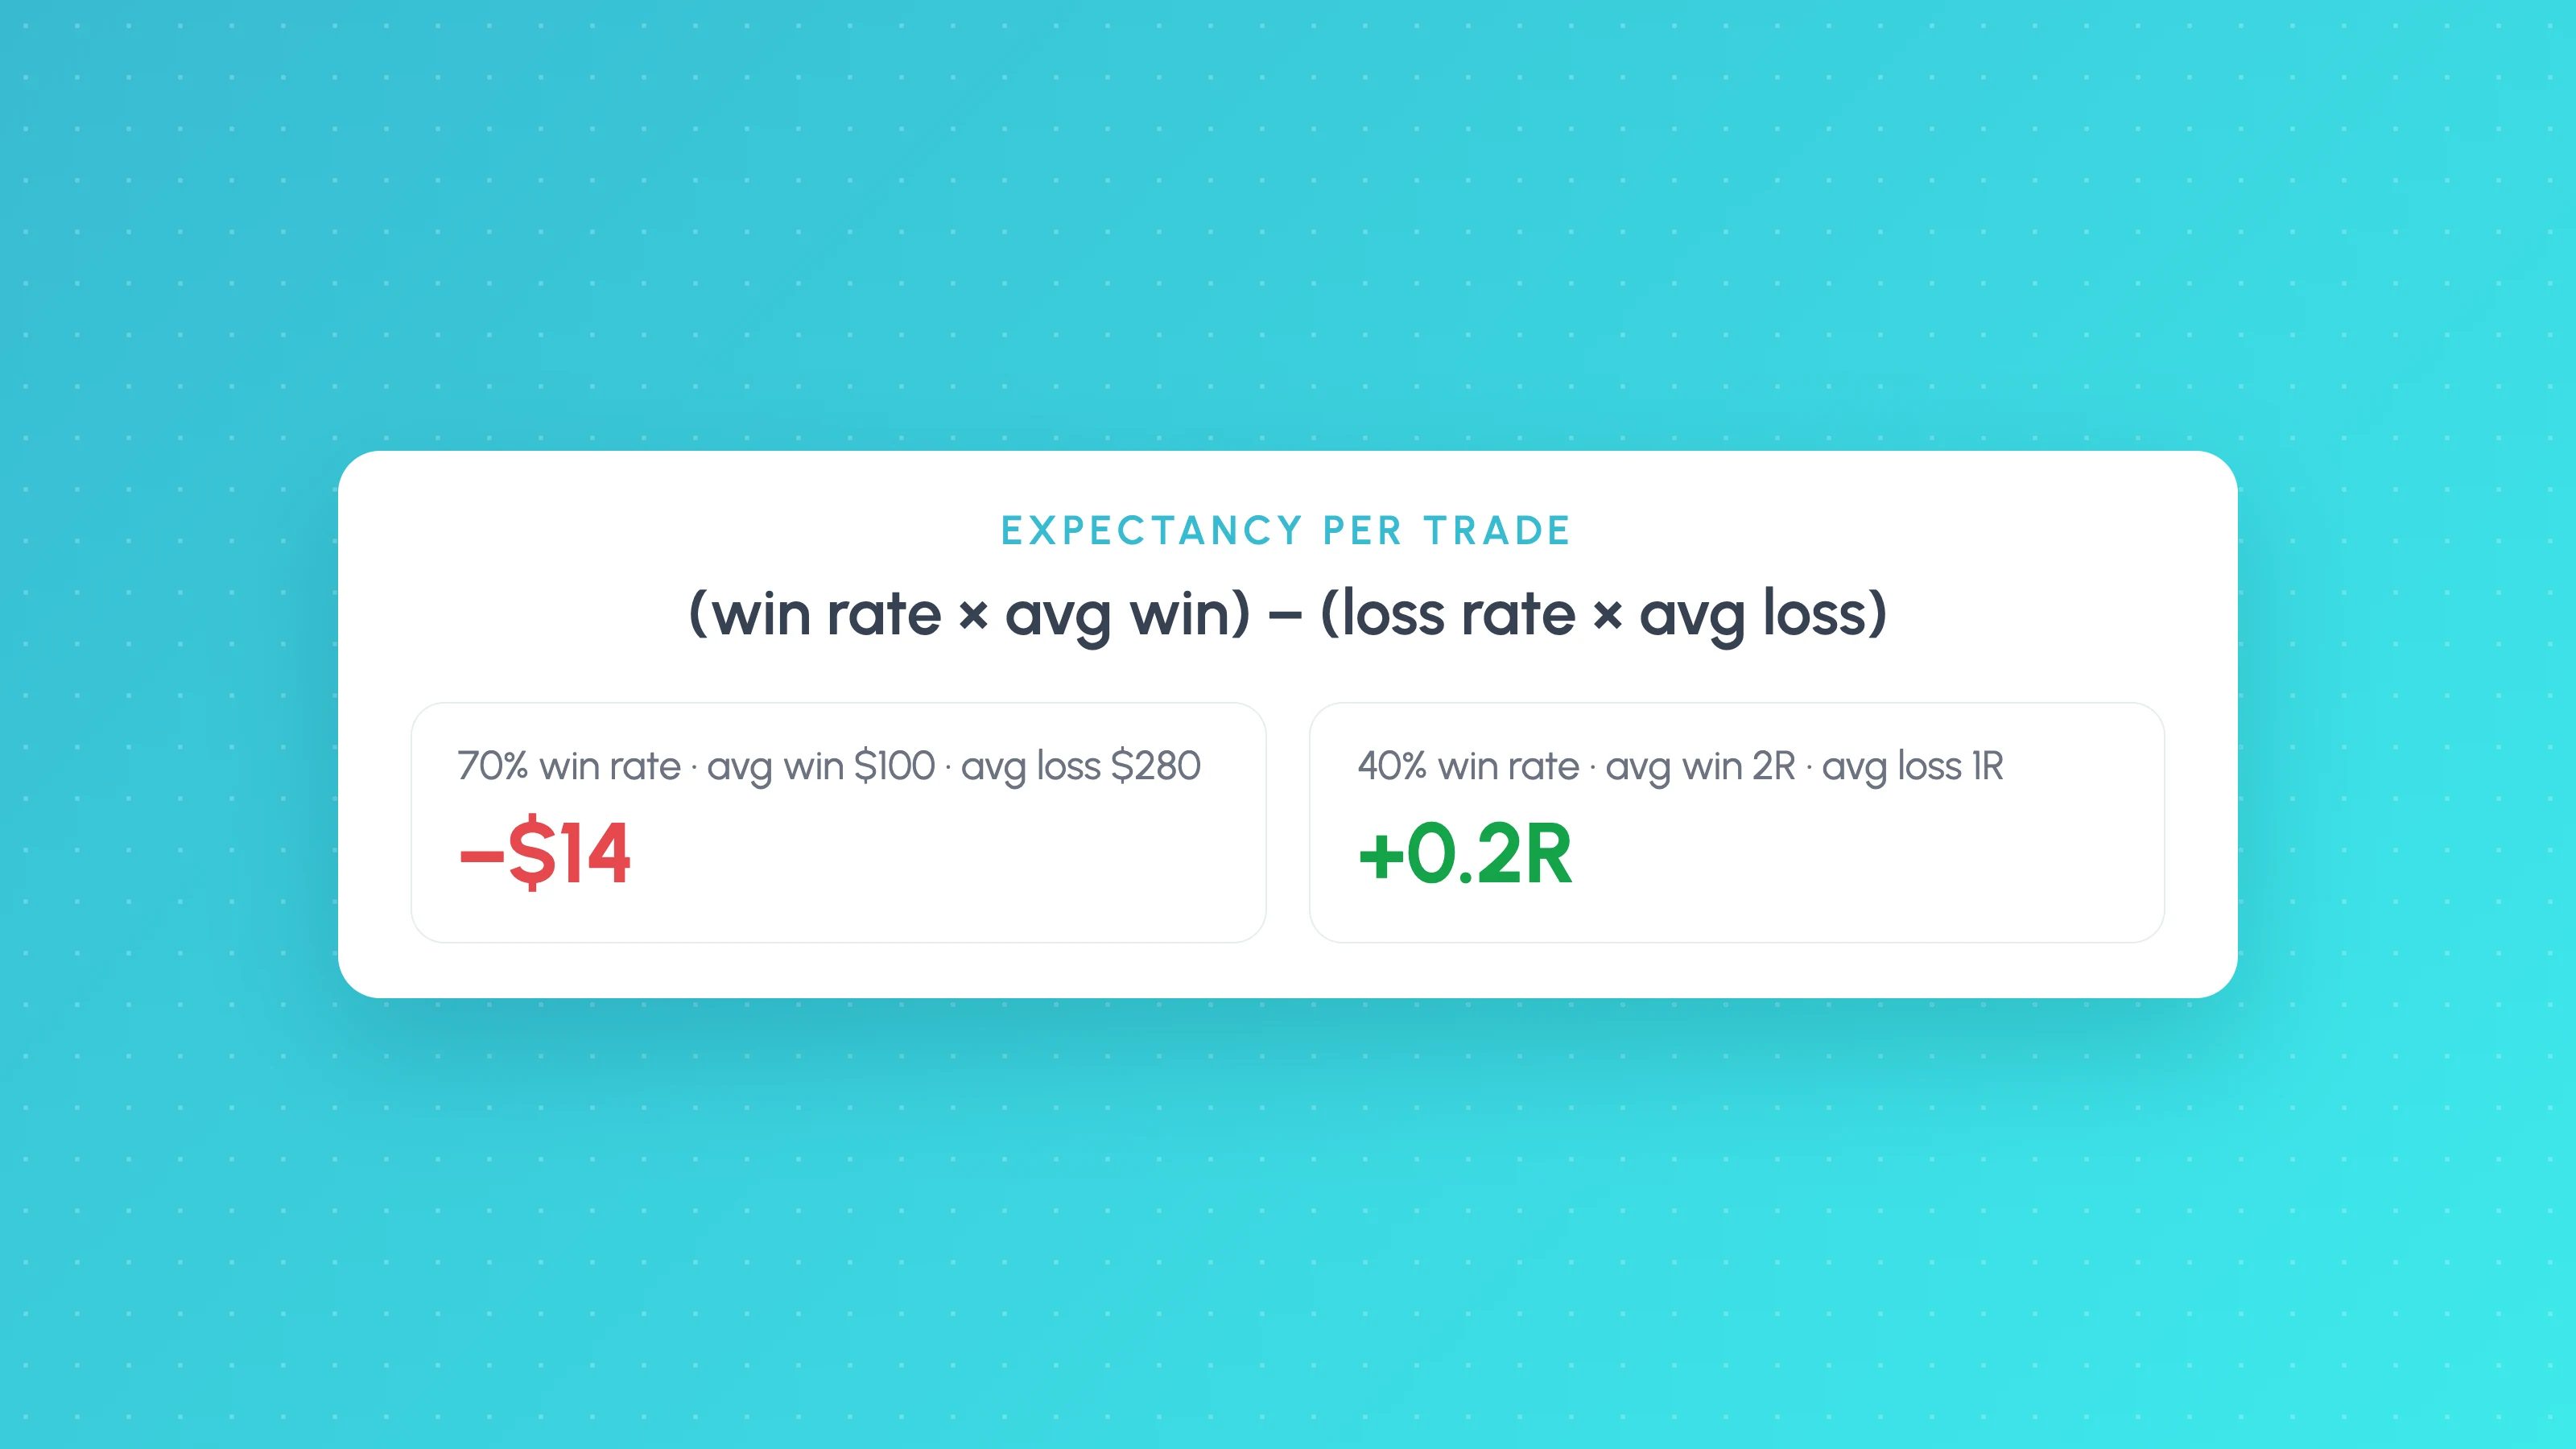
Trading Expectancy Formula: In Currency and R, With Examples
Expectancy = win rate x average win minus loss rate x average loss. Worked examples in currency and R, why 70% win rates lose, and spreadsheet formulas.
 TradingView backtests
7 min read
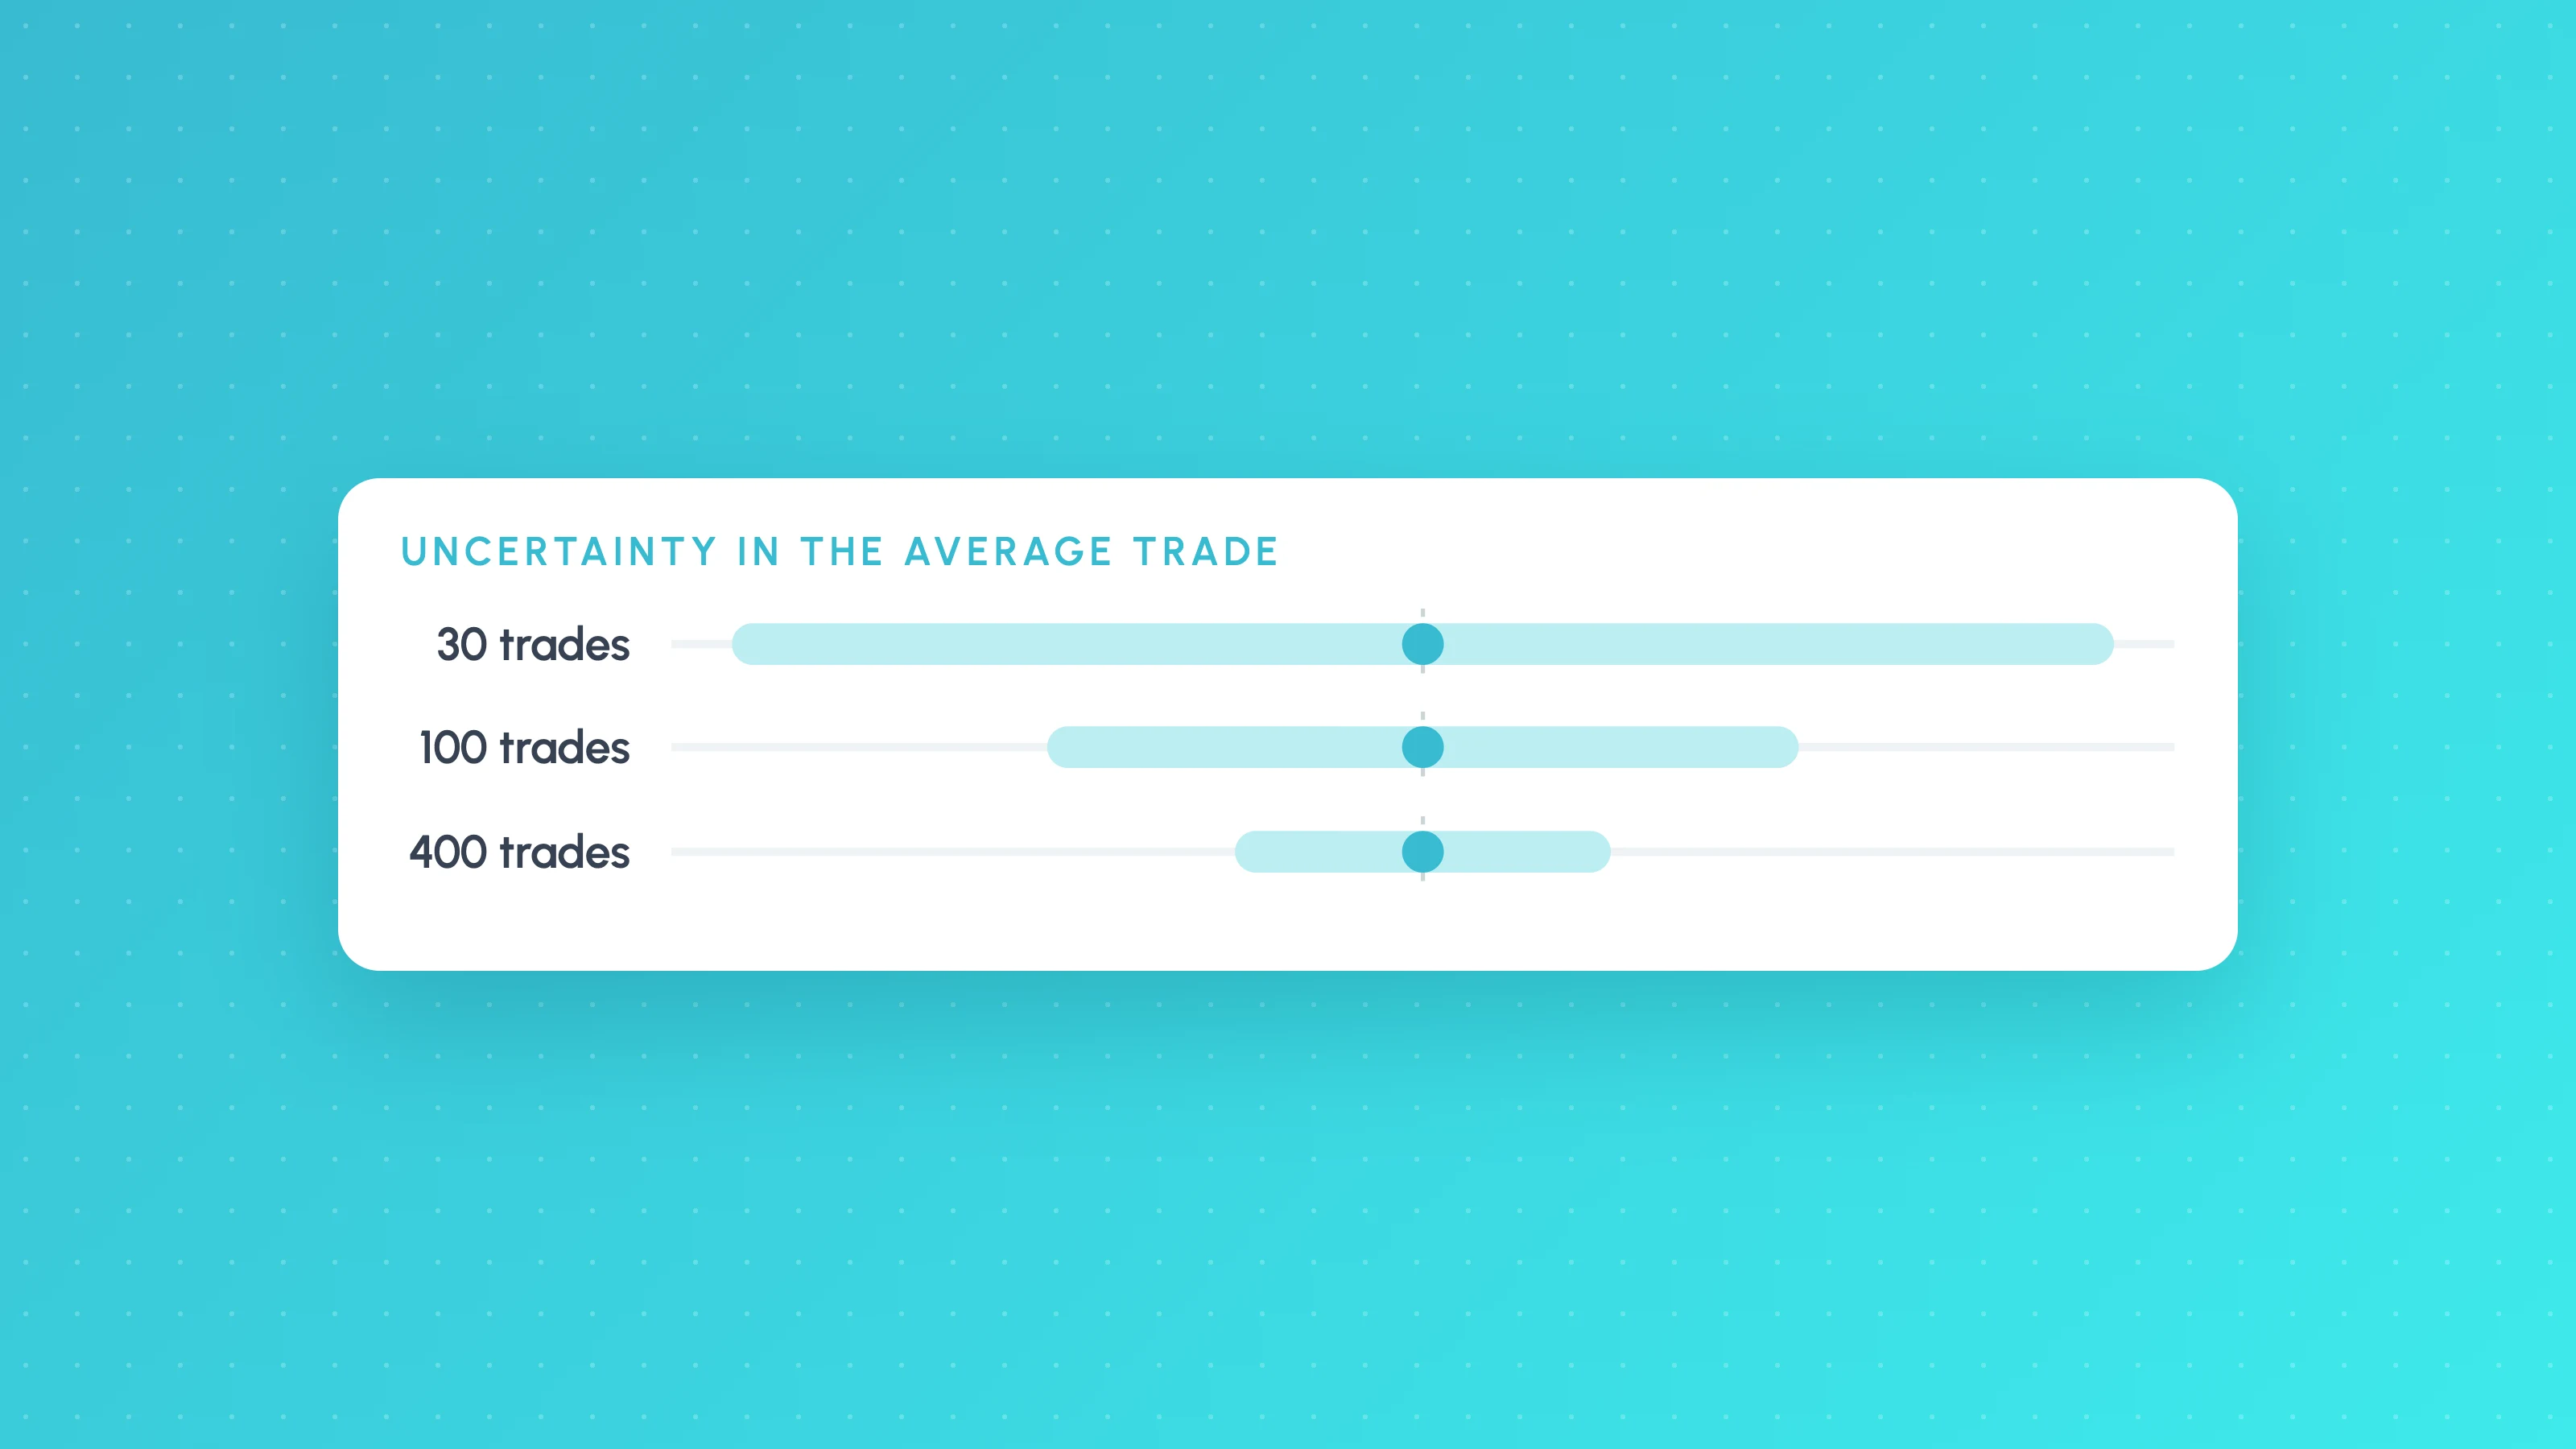
How Many Trades Do You Need for a Valid Backtest?
How many trades a backtest needs: rules of thumb, the t-statistic formula with a worked example, a table by edge size, per-bucket minimums and multiple testing.