

Win Rate vs Risk:Reward: The Breakeven Table for Algo Strategies
Win rate vs risk reward: breakeven win rate = 1 / (1 + R), so 1:2 needs 33.3% before costs. Table from 0.5R to 5R, with costs and spreadsheet formulas.
By Tessera Trades · Updated · 11 min read
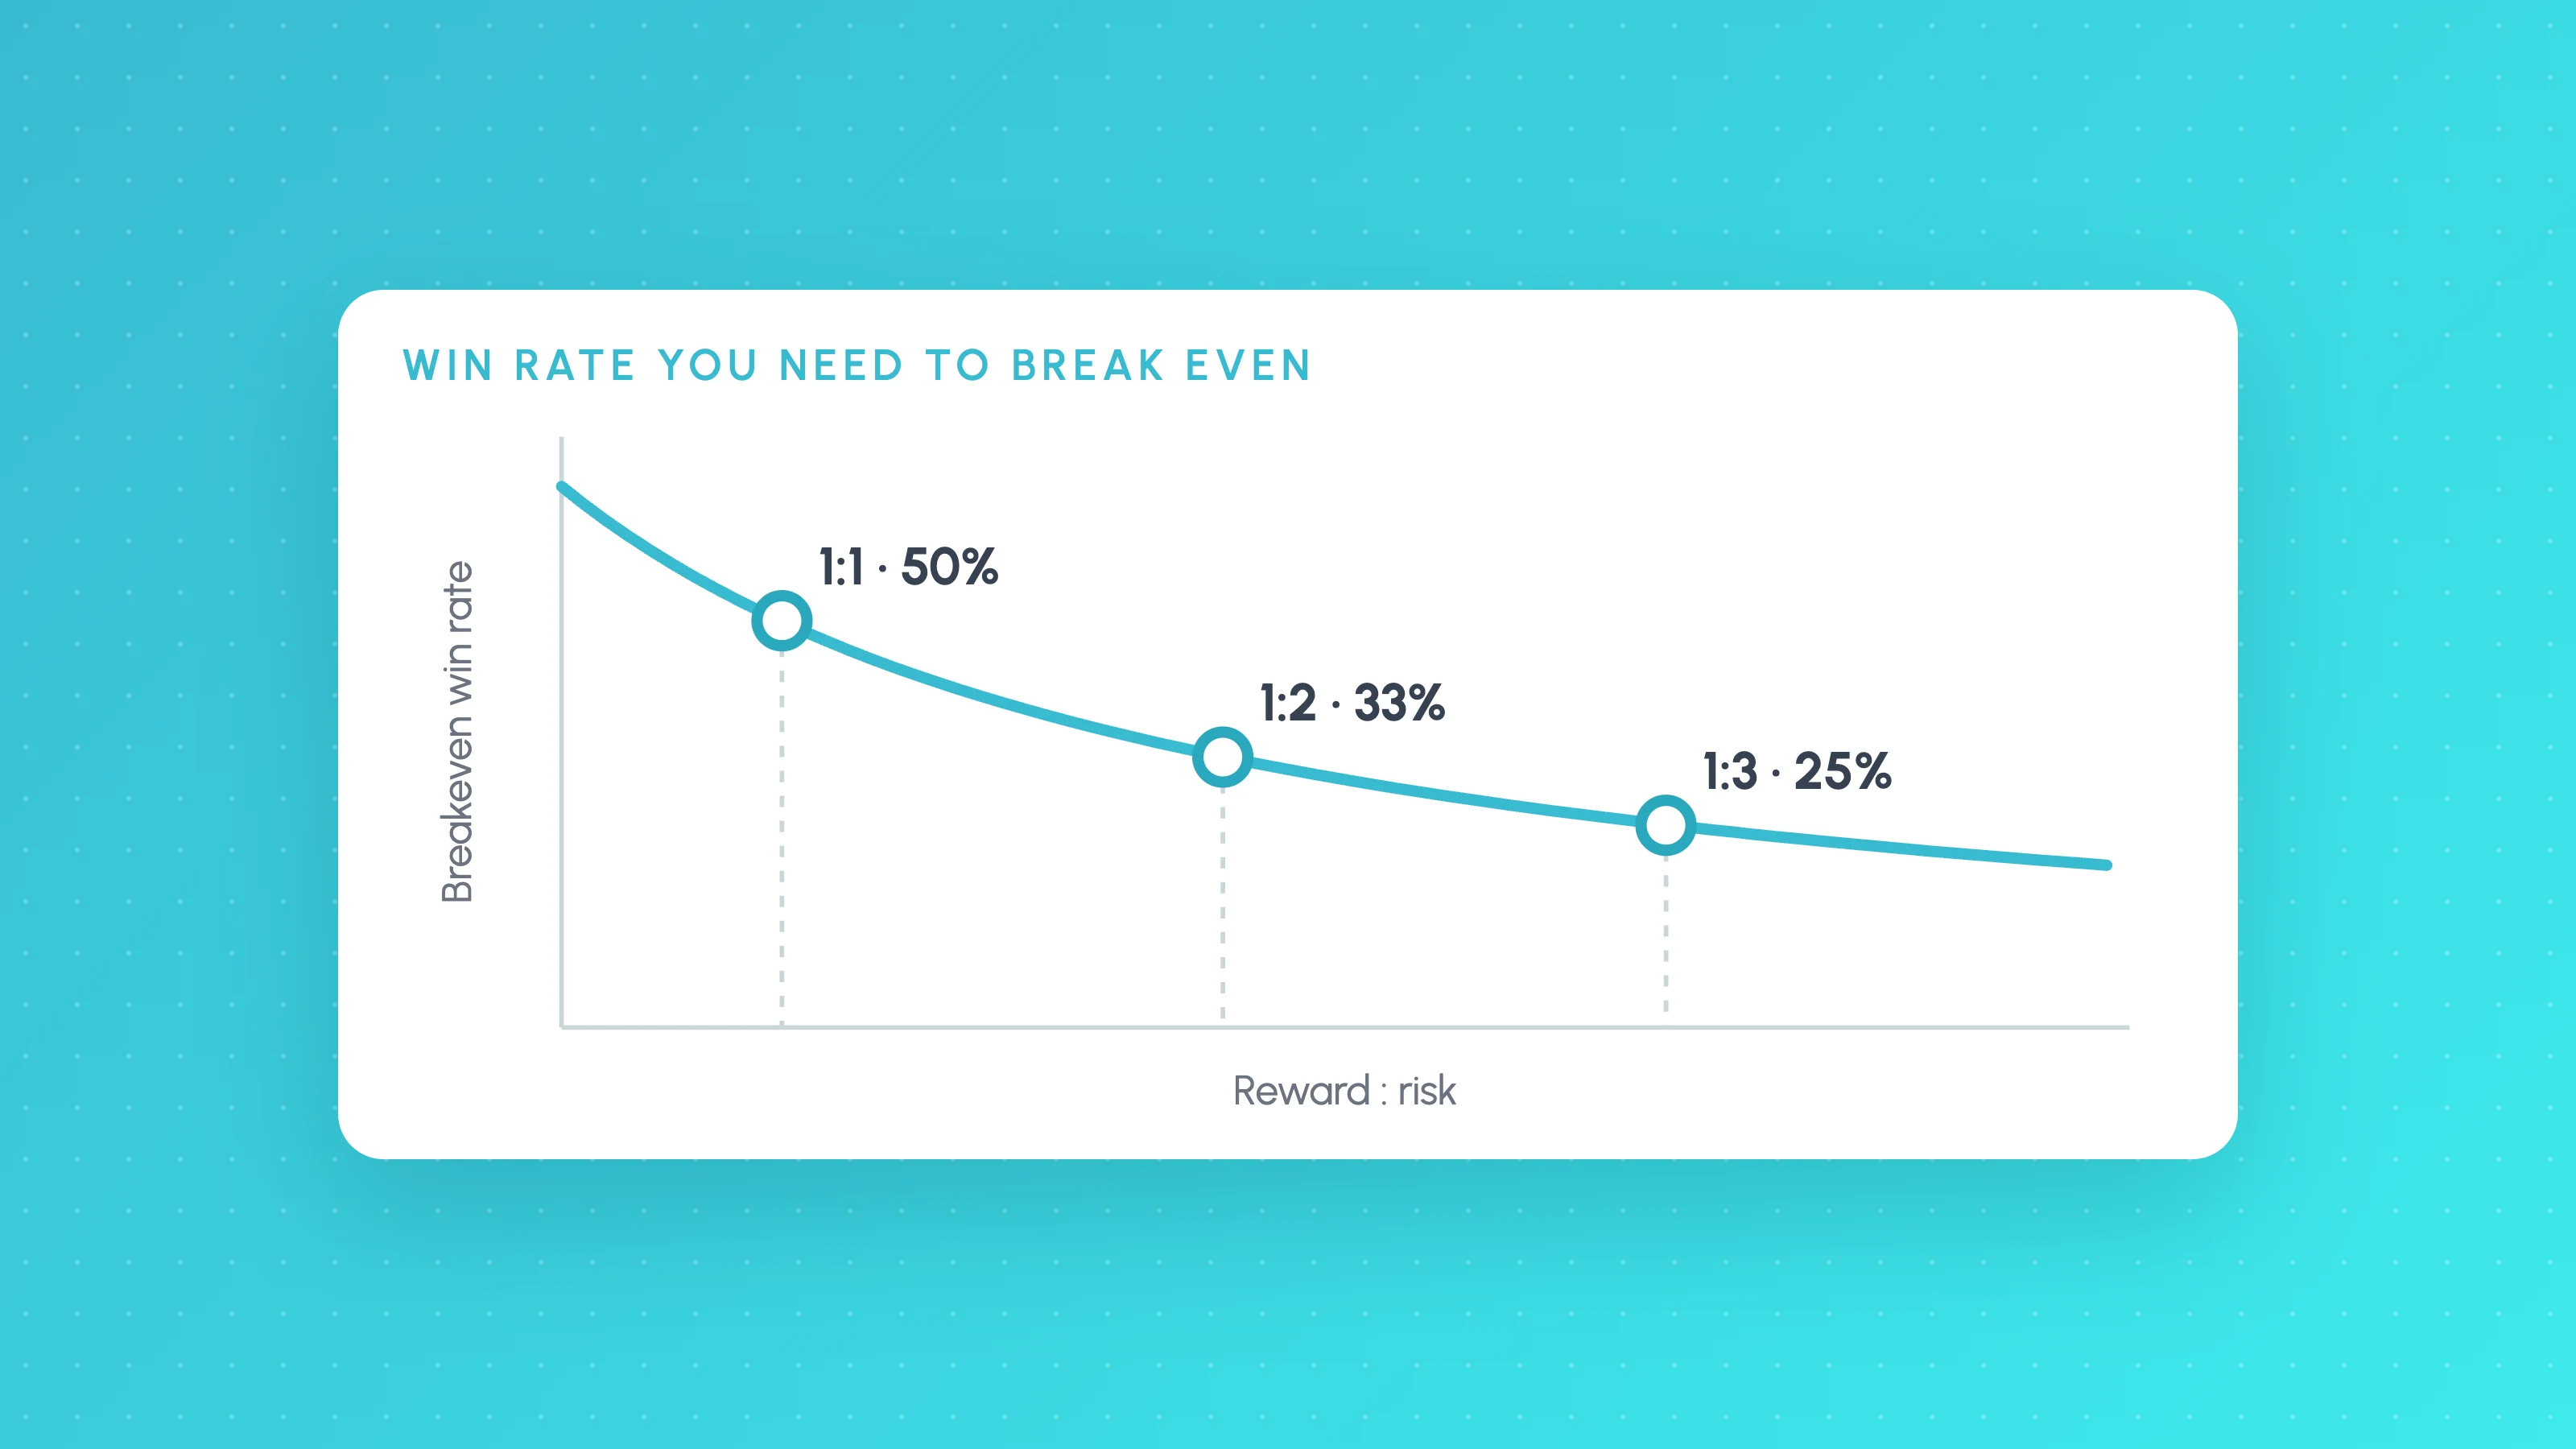
The win rate you need to break even is 1 / (1 + R), where R is your average win divided by your average loss. At 1:2 risk:reward you need to win 33.3% of trades, at 1:1 you need 50%, and at 1:0.5 you need 66.7%, all before costs. Commission and slippage push every one of those figures up.
Neither number means anything alone. A 90% win rate can lose money, and a 35% win rate can be a solid strategy. This guide gives the formula, a full breakeven table with and without costs, the reasons high win-rate strategies fail, a worked example of a modest-looking bot that is fine, and spreadsheet formulas to check your own trades.
The breakeven win rate formula
Call the average win R times the average loss. A strategy breaks even when the money from winners equals the money lost on losers:
Win rate x R = (1 - Win rate) x 1
Breakeven win rate = 1 / (1 + R)
In currency, without converting to R:
Breakeven win rate = Average loss / (Average win + Average loss)Both versions give the same answer. If winners average $300 and losers average $150, R is 2 and the breakeven win rate is $150 / $450 = 33.3%.
Use realised averages from your trade list, not the target and stop written in your code. Planned 1:2 trades rarely average exactly 1:2: some exits are by time or signal, stops slip, and a target that price gaps through can fill at a better price than planned. TradingView reports the realised figure as Ratio avg win / avg loss, and its help page notes that this ratio does not factor in win rate, which is why you need both.
The breakeven win rate table
R below is average win / average loss. The first column is before costs. The other three add a fixed cost per trade, expressed as a fraction of the average loss (0.1R means costs equal a tenth of what you lose on a typical losing trade).
| Risk:reward (1:R) | Breakeven win rate, no costs | Costs 0.05R | Costs 0.1R | Costs 0.2R |
|---|---|---|---|---|
| 1:0.5 | 66.7% | 70.0% | 73.3% | 80.0% |
| 1:0.75 | 57.1% | 60.0% | 62.9% | 68.6% |
| 1:1 | 50.0% | 52.5% | 55.0% | 60.0% |
| 1:1.25 | 44.4% | 46.7% | 48.9% | 53.3% |
| 1:1.5 | 40.0% | 42.0% | 44.0% | 48.0% |
| 1:2 | 33.3% | 35.0% | 36.7% | 40.0% |
| 1:2.5 | 28.6% | 30.0% | 31.4% | 34.3% |
| 1:3 | 25.0% | 26.3% | 27.5% | 30.0% |
| 1:4 | 20.0% | 21.0% | 22.0% | 24.0% |
| 1:5 | 16.7% | 17.5% | 18.3% | 20.0% |
Read across a row to see how much costs matter. At 1:1, a cost of a fifth of your risk per trade moves breakeven from 50% to 60%. Read down a column to see the trade-off: every step up in payoff lowers the win rate you need, but by less each time.
How costs shift the breakeven point
Costs are paid on every trade, winners and losers. With a cost of c (in R) per trade, a winner nets R minus c and a loser costs 1 plus c, so the formula becomes:
Breakeven win rate with costs = (1 + c) / (1 + R)For a 1:2 strategy paying 0.1R per trade: (1 + 0.1) / (1 + 2) = 1.1 / 3 = 36.7%.
c is measured against your stop, not your account. The same round-trip cost is a tiny fraction of a wide stop and a large fraction of a tight one. Say commission plus slippage come to 2 ticks per round trip:
| Stop distance | Cost in R | Breakeven at 1:1 | Breakeven at 1:2 |
|---|---|---|---|
| 40 ticks | 0.05R | 52.5% | 35.0% |
| 20 ticks | 0.1R | 55.0% | 36.7% |
| 10 ticks | 0.2R | 60.0% | 40.0% |
This is why scalping strategies with small stops are so sensitive to fees and fills, and why the cost settings in a backtest matter so much for them. In TradingView, Pine Script strategies apply no commission unless you specify one, and the slippage argument, measured in ticks, also defaults to 0 according to the same page. A backtest left on those defaults is reporting the "no costs" column. Our guide to why strategies work in backtest but not live covers setting them realistically.
What win rate do you need for 1:2 risk:reward?
33.3% before costs. Win one trade in three at 1:2 and you break even: the winner makes 2R, the two losers cost 2R. Above that, after costs, the strategy has positive expectancy; below it, negative.
In practice, add a margin. A realistic cost of 0.05R to 0.1R per trade lifts breakeven to 35% to 37%, and your measured win rate is itself uncertain (more on that below). A 1:2 strategy that wins 38% in a backtest is much closer to breakeven than it looks.
Do you need an 80% win rate?
No. You only need 80% if your average win is a quarter of your average loss or smaller (1 / (1 + 0.25) = 80%). An 80% win rate is neither necessary nor, by itself, good. What matters is how far your win rate sits above the breakeven win rate for your payoff, after costs.
The two numbers are linked because exits drive both. Move a target closer and more trades reach it, so win rate rises, but each win is smaller, so R falls. Widen a stop and fewer trades hit it, but each loss is bigger. Changing an exit almost always trades one for the other, and the question is whether the margin above breakeven grows or shrinks.
Why high win-rate strategies can still lose
A high win rate usually comes from small targets, wide stops, no stops, or adding to losing positions. Each one keeps the win count high by making losses larger or rarer, and the arithmetic catches up.
Small wins, normal losses. A strategy that wins 90% of trades, with winners averaging 0.1R and losers at 1R:
(0.90 x 0.1R) - (0.10 x 1R) = 0.09R - 0.10R = -0.01R per tradeBreakeven at R = 0.1 is 1 / 1.1 = 90.9%, so 90% loses slowly, and that is before costs.
Rare, large losses. A strategy wins 95 trades out of 100 at +0.2R each, then has 5 losses that average 4R because the stop is wide or missing:
95 x 0.2R = +19R
5 x 4R    = -20R
Net       = -1R over 100 trades
Its realised R is 0.2 / 4 = 0.05, so breakeven is 1 / 1.05 = 95.2%. It wins 95% of the time and still loses.
The loss that hasn't happened yet. The most dangerous version is a backtest that never contains the big loss. Martingale, grid and averaging-down systems can show 95%+ win rates over the test period because the one move that blows through their risk didn't occur in that sample. If your largest loss is many times your average win, check the MAE of your trades: winners that sat deep underwater before recovering are losses the strategy got lucky on.
Costs eat small wins first. At R = 0.25, a cost of 0.05R per trade takes 20% off every winner. Tight targets make high win-rate strategies the most cost-sensitive of all.
Example: why a 63% win rate and 1.35 profit factor can be fine
Forum threads regularly argue that a strategy needs something like an 80% win rate and a high profit factor to be worth trading. Here is a generic example, with made-up numbers, showing why that is the wrong test.
Say a bot's trade list, after costs, shows a 63% win rate and a profit factor of 1.35. Profit factor is (win rate x average win) / (loss rate x average loss), so you can back out the payoff:
R = Profit factor x Loss rate / Win rate
  = 1.35 x 0.37 / 0.63
  = 0.79
Winners average about 0.79 times the size of losers. Now the checks:
| Measure | Calculation | Result |
|---|---|---|
| Breakeven win rate | 1 / (1 + 0.79) | 55.8% |
| Margin above breakeven | 63.0% - 55.8% | 7.2 points |
| Expectancy | (0.63 x 0.79R) - (0.37 x 1R) | +0.13R per trade |
A 63% win rate is unremarkable and 1.35 is a modest profit factor, but together they give a positive expectancy of about 0.13R per trade with a 7-point cushion above breakeven. Over many trades that is a real edge, if it holds out of sample.
Two things would change the verdict:
- If those figures were before costs. Add 0.05R per trade and expectancy drops to about +0.08R, profit factor to about 1.20, and breakeven rises to 58.6%. Still positive, with a much thinner margin.
- If the sample is small. The win rate itself is an estimate. A rough 95% range for a measured win rate p over n trades is p plus or minus 1.96 x √(p(1 - p) / n). At 63% that is about ±6.7 points on 200 trades and ±3.0 points on 1,000 trades. On 200 trades, the 7.2-point margin is barely outside the noise; on 1,000 it is comfortably clear. This treats average win and loss as fixed, so the true uncertainty is larger. The backtest sample size guide goes further.
The lesson is that win rate and profit factor are judged against each other and against breakeven, not against fixed targets.
What is a good win rate for an algo strategy?
There isn't one. A good win rate is one that sits clearly above the breakeven win rate for your realised payoff, after costs, on enough trades to be confident. As rough patterns rather than rules:
| Strategy style | Typical win rate | Typical R | What to watch |
|---|---|---|---|
| Trend following, breakouts | Low | High | Long losing streaks; a few winners carry the results |
| Mean reversion | High | Low | Large losses when the reversion doesn't come; costs |
| Scalping | Varies | Often near 1R | Costs as a fraction of a tight stop |
Losing streaks follow directly from win rate. Assuming trades are independent, the chance that any given run of five trades is all losers is (1 - win rate)^5: about 13.5% at a 33% win rate and about 1% at 60%. A low win-rate strategy can be profitable and still be hard to run, because the streaks are long and frequent.
Testing a target or stop change
Because exits move win rate and R together, the only way to know whether a change helps is to test both at once on the same trades. Moving a target from 2R to 1.5R might raise the win rate from 36% to 44%, but the breakeven also rises from 33.3% to 40%, so the margin goes from 2.7 points to 4 points. Whether the real numbers move like that depends on how far your trades actually ran, which is what MFE measures.
Tessera's simulator replays stop, target and filter changes on real candles for trades your strategy already took, with up to 16 runs (on the Plus plan) compared side by side against the original. It doesn't generate new entries, so it answers "what would these trades have done with a different exit", not "find me a better strategy".
Spreadsheet formulas
Export your trade list (in TradingView, the Trades tab of the Strategy Tester report, which saves the List of Trades as a CSV; exporting needs a paid TradingView plan) with one row per trade and the net P&L in column D, rows 2 to 500.
| Measure | Formula |
|---|---|
| Win rate | =COUNTIF(D2:D500,">0")/COUNT(D2:D500) |
| Average win | =AVERAGEIF(D2:D500,">0") |
| Average loss | =ABS(AVERAGEIF(D2:D500,"<0")) |
| Realised R | =AVERAGEIF(D2:D500,">0")/ABS(AVERAGEIF(D2:D500,"<0")) |
| Breakeven win rate | =ABS(AVERAGEIF(D2:D500,"<0"))/(AVERAGEIF(D2:D500,">0")+ABS(AVERAGEIF(D2:D500,"<0"))) |
| Margin above breakeven | Win rate cell minus breakeven cell |
To build your own breakeven table, put R values in column A from A2 down and a cost in R in cell B1, then use =1/(1+A2) for no costs and =(1+$B$1)/(1+A2) with costs, filled down.
Two cautions. Decide how to treat zero-P&L trades and keep it consistent, because counting them as wins or losses changes the win rate. And make sure the P&L column is net of commission, otherwise every figure is in the "no costs" column of the table.
If you want those numbers split by session, weekday, time of day and volatility without building pivot tables, a free Entry Analysis report does it from your trades from a synced broker, a platform export or any spreadsheet, with no card needed.
To see what a given win rate and reward-to-risk mean for your account, try the free risk of ruin calculator and the expectancy calculator.
Frequently asked questions
- What win rate do I need for a 1:2 risk reward?
- You need to win just over 33.3% of trades to break even before costs, because one 2R winner covers two 1R losers. With realistic costs of 0.05R to 0.1R per trade, breakeven rises to about 35% to 37%. Aim for a clear margin above that on a large sample.
- Is a 90% win rate trading strategy real?
- A 90% win rate is arithmetically possible, but it is usually bought with small targets and large or rare losses. At 90%, your average win needs to be more than about 0.11 times your average loss just to break even before costs. Check the largest loss against the average win before trusting one.
- Why does my high win rate strategy lose money?
- Because your average loss is too large relative to your average win. Work out your breakeven win rate as average loss / (average win + average loss); if your actual win rate is below it, you lose money however often you win. Costs, wide stops and positions held hoping for recovery are the usual causes.
- How do win rate and risk reward relate?
- They trade off against each other through your exits. A closer target raises win rate and lowers reward; a wider stop raises win rate and increases the size of losses. The breakeven win rate, 1 / (1 + R), tells you which combinations make money.
- Is win rate or risk reward more important?
- Neither on its own. What matters is expectancy, which combines both: (win rate x average win) - (loss rate x average loss). A strategy is only as good as its margin above breakeven after costs.
- Should I use planned or actual risk reward?
- Use the actual, realised average win and loss from your trade history. Exits on signals or time, slippage on stops and partial fills mean planned and realised ratios often differ, and only the realised one tells you your true breakeven.
Keep reading
 Trading metrics
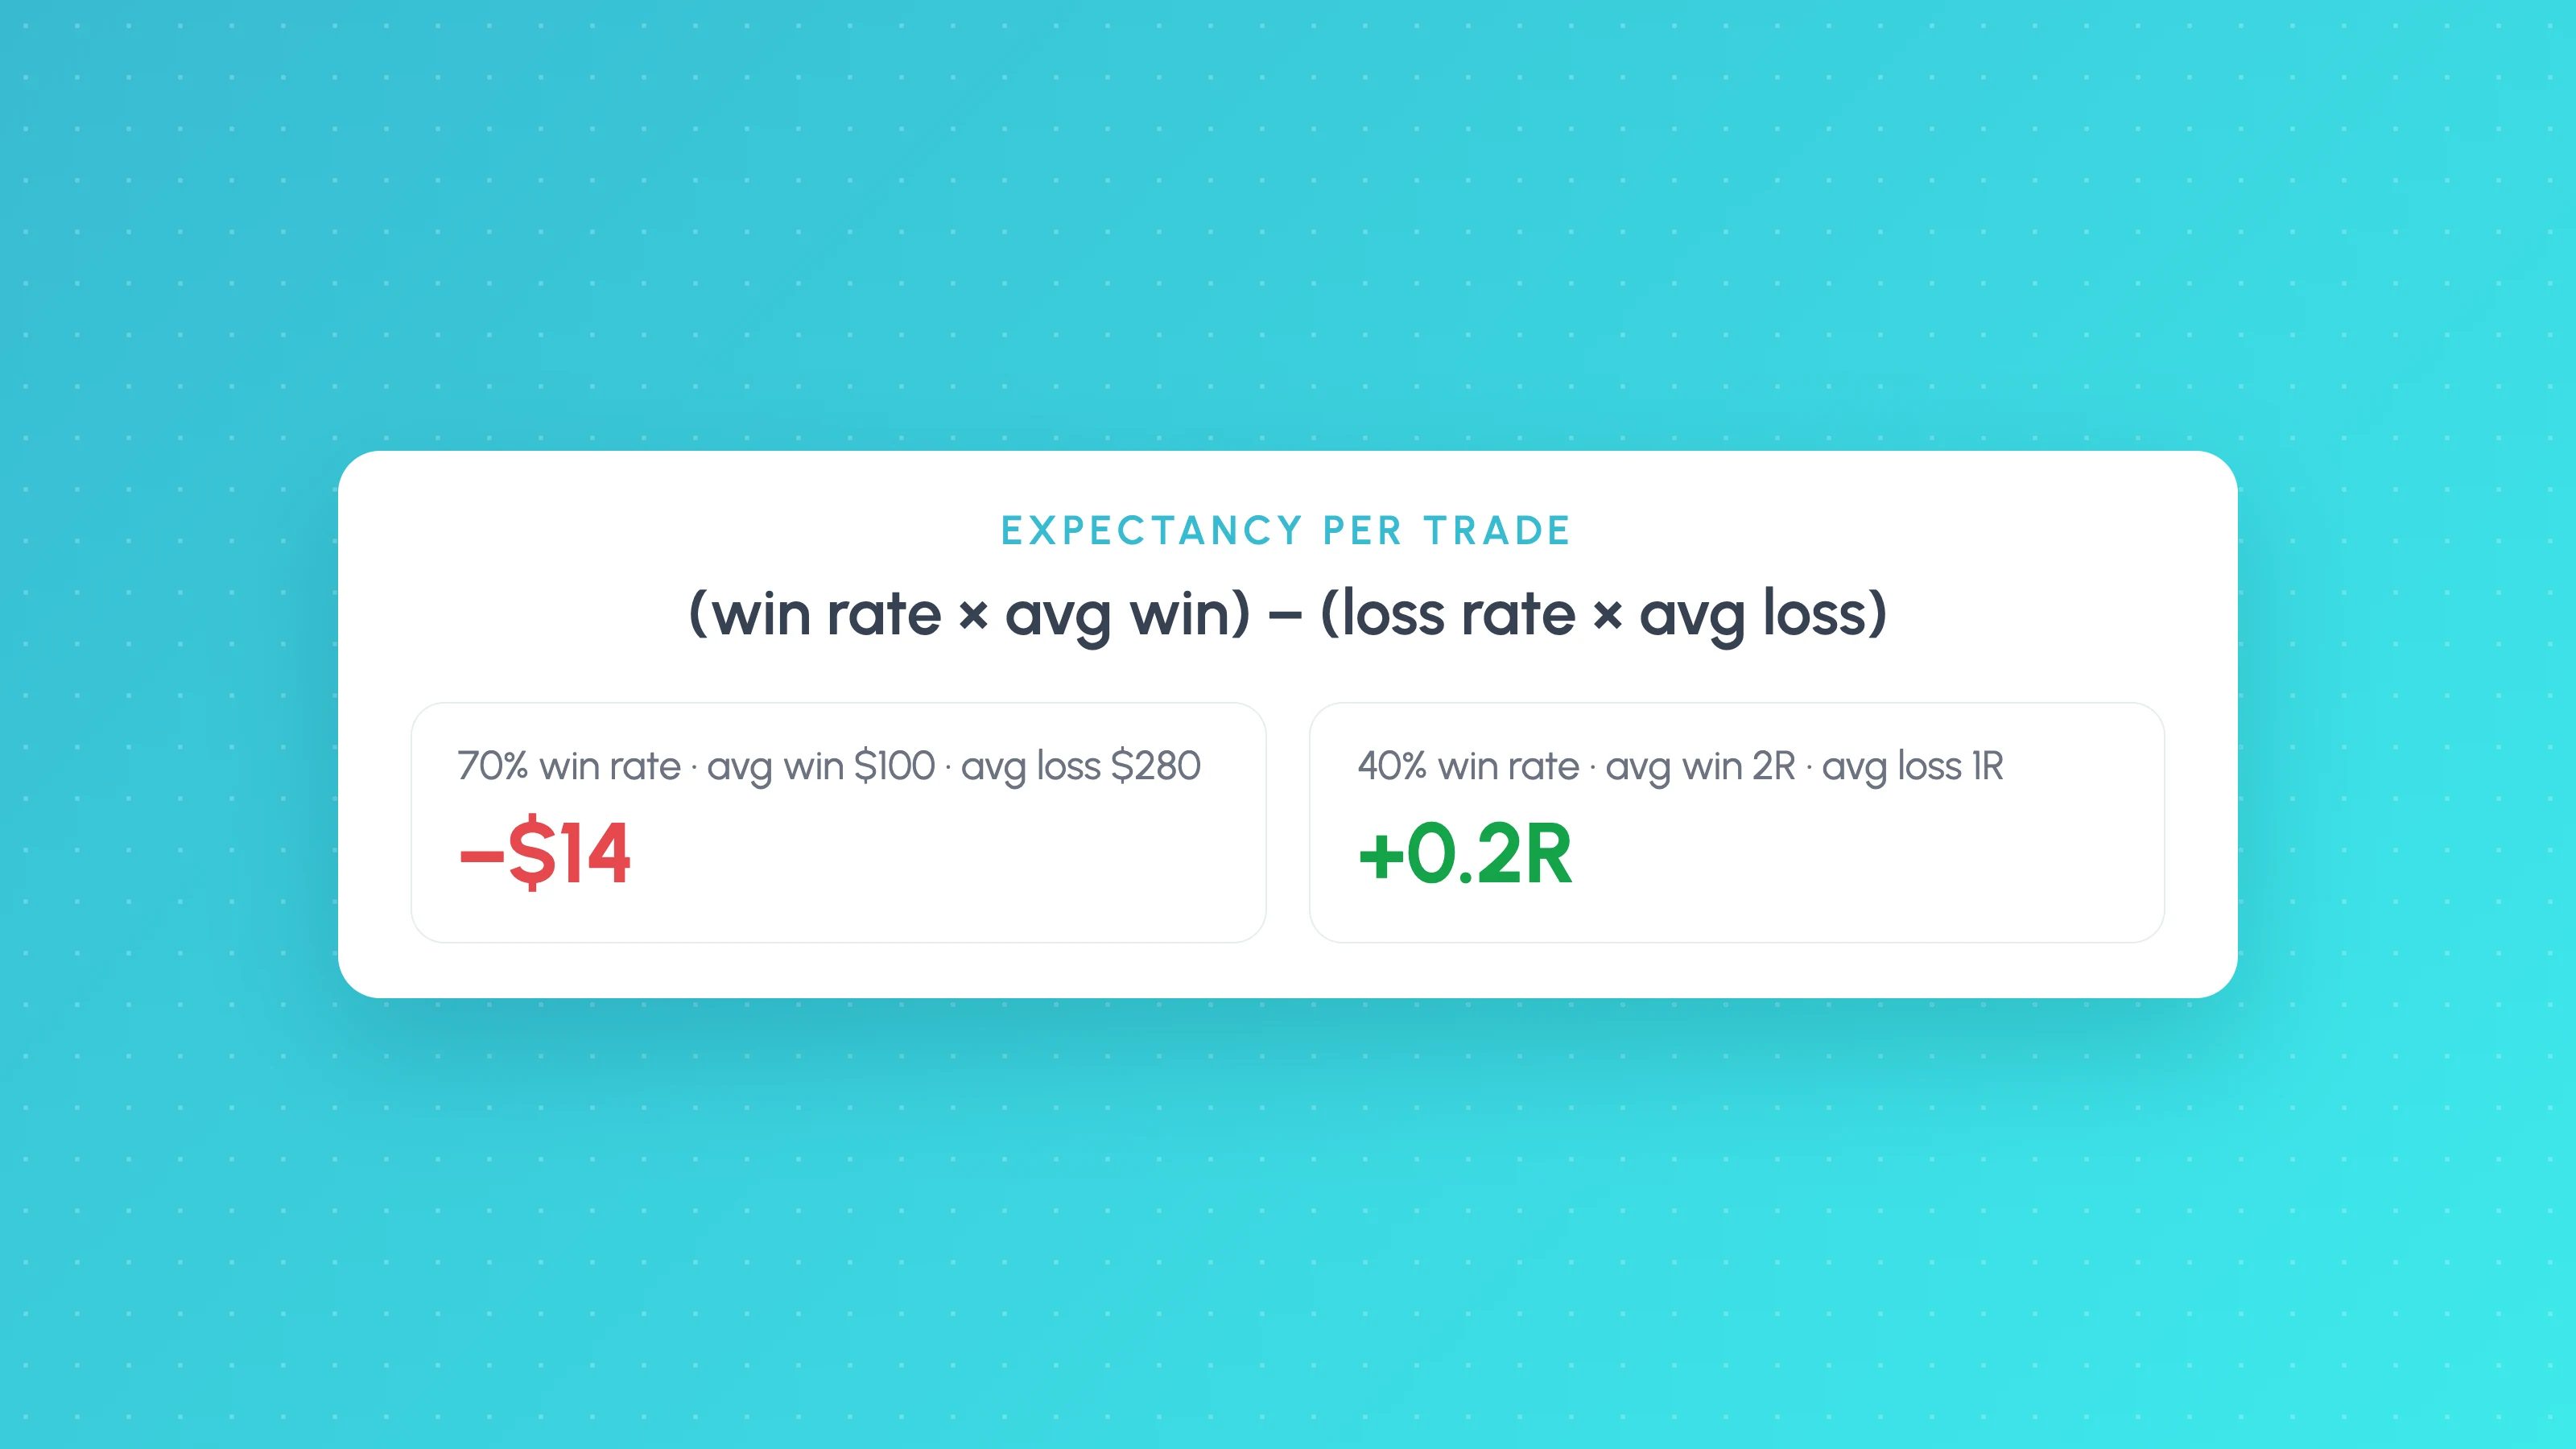
Trading Expectancy Formula: In Currency and R, With Examples
Expectancy = win rate x average win minus loss rate x average loss. Worked examples in currency and R, why 70% win rates lose, and spreadsheet formulas.
 Trading metrics
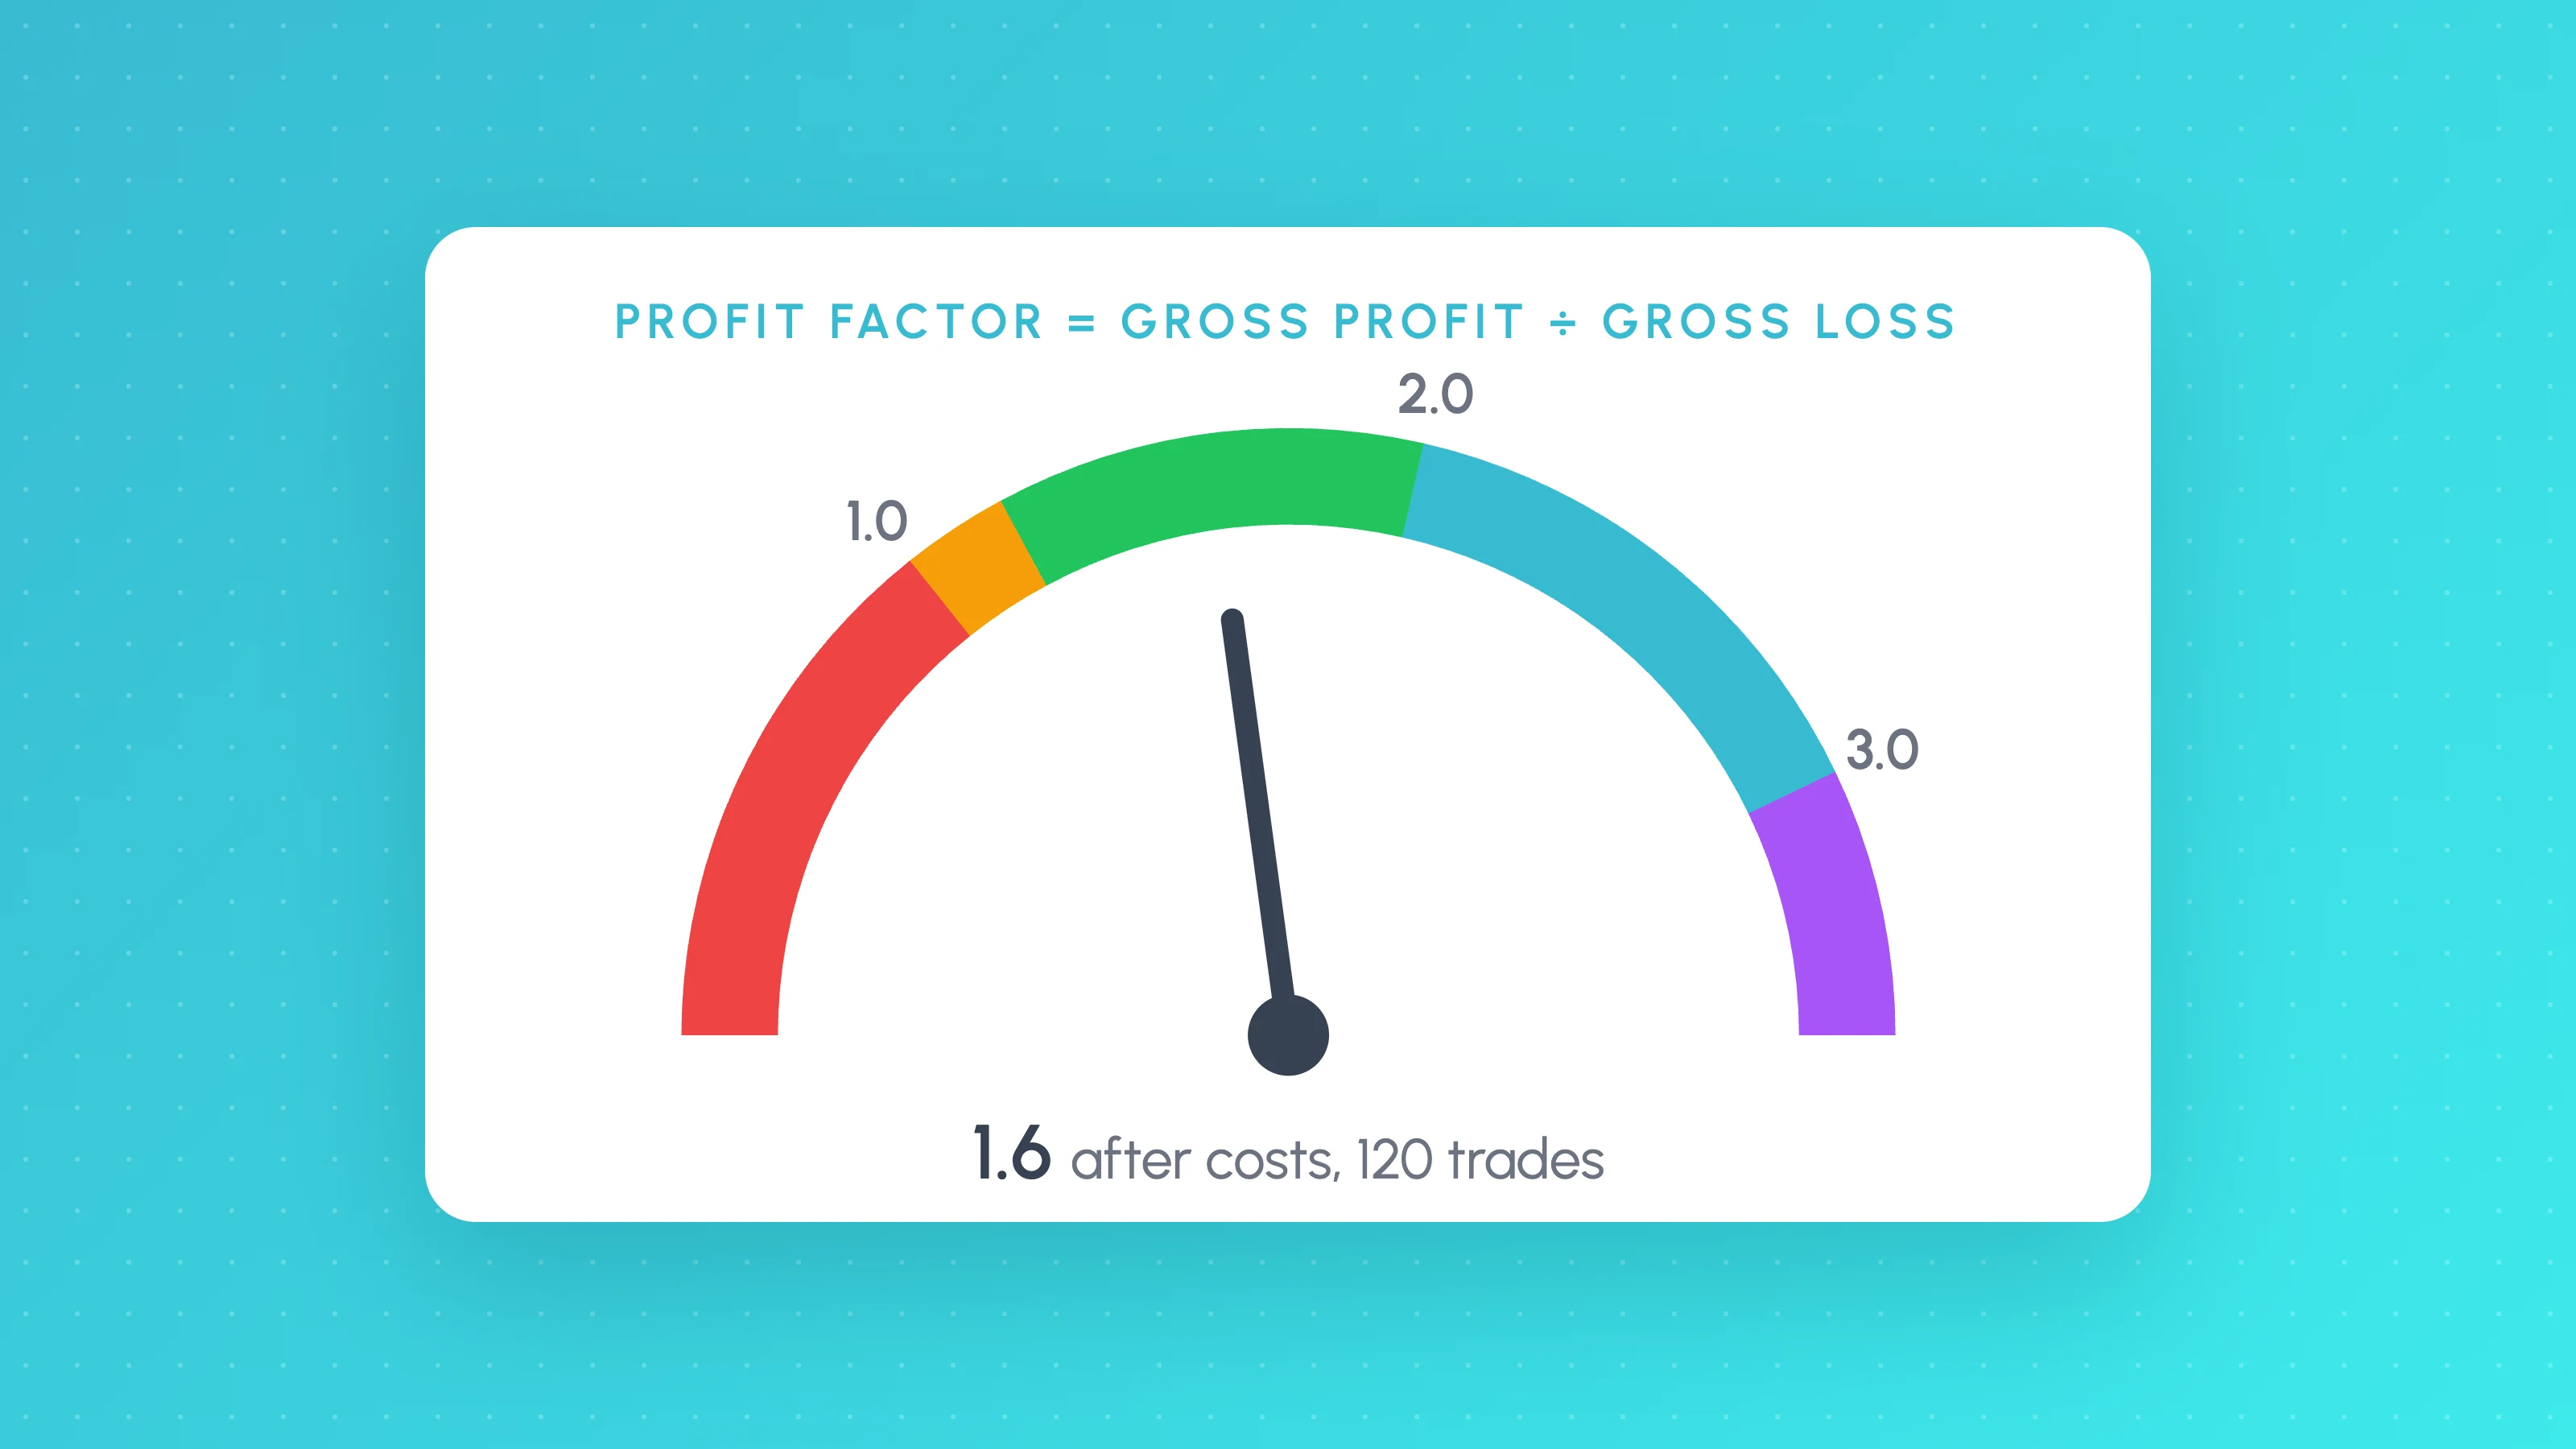
What Is a Good Profit Factor? Formula, Ranges and Red Flags
A good profit factor is usually 1.3 to 2.0 after costs on 100+ trades. See the formula, a worked example, a spreadsheet calculator and why above 3 is a warning.
 Trading metrics
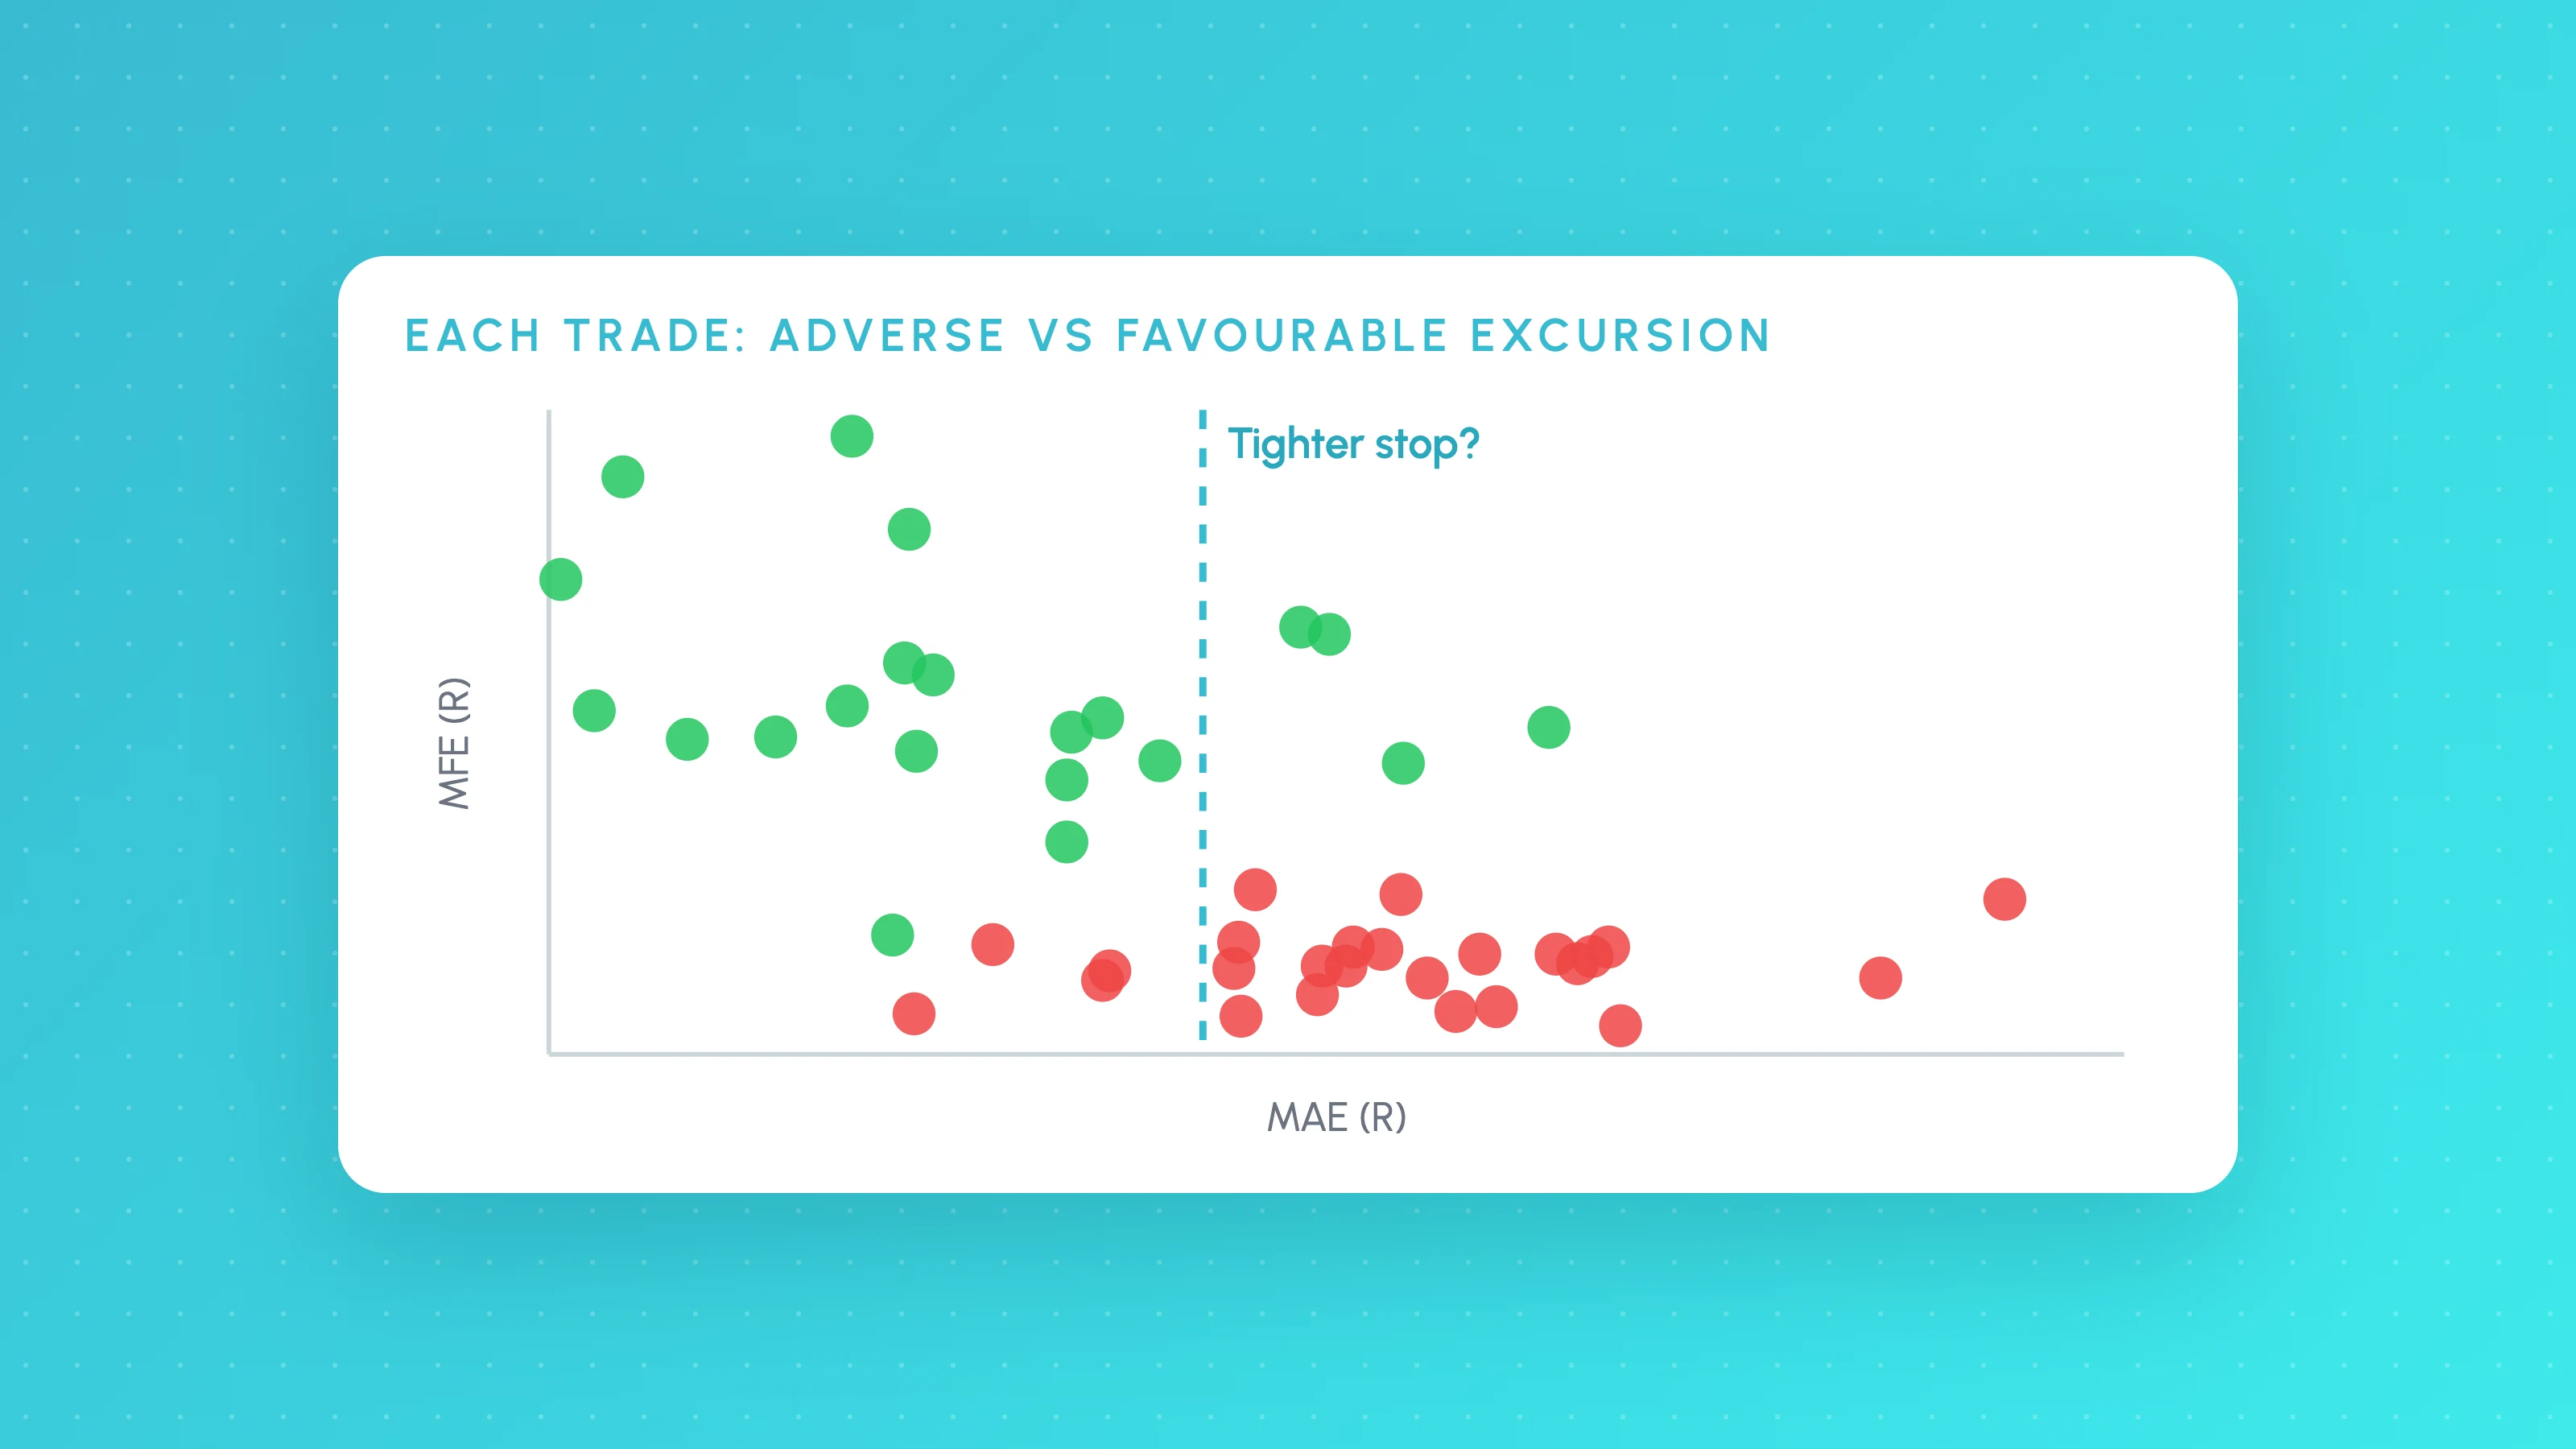
MAE and MFE Analysis: Set Stops and Targets From Your Own Trades
How to calculate MAE and MFE for each trade, read the scatter plots, set stops from winners' MAE and targets from MFE, then test the change on real candles.