

Trading Expectancy Formula: In Currency and R, With Examples
Expectancy = win rate x average win minus loss rate x average loss. Worked examples in currency and R, why 70% win rates lose, and spreadsheet formulas.
By Tessera Trades · Updated · 8 min read
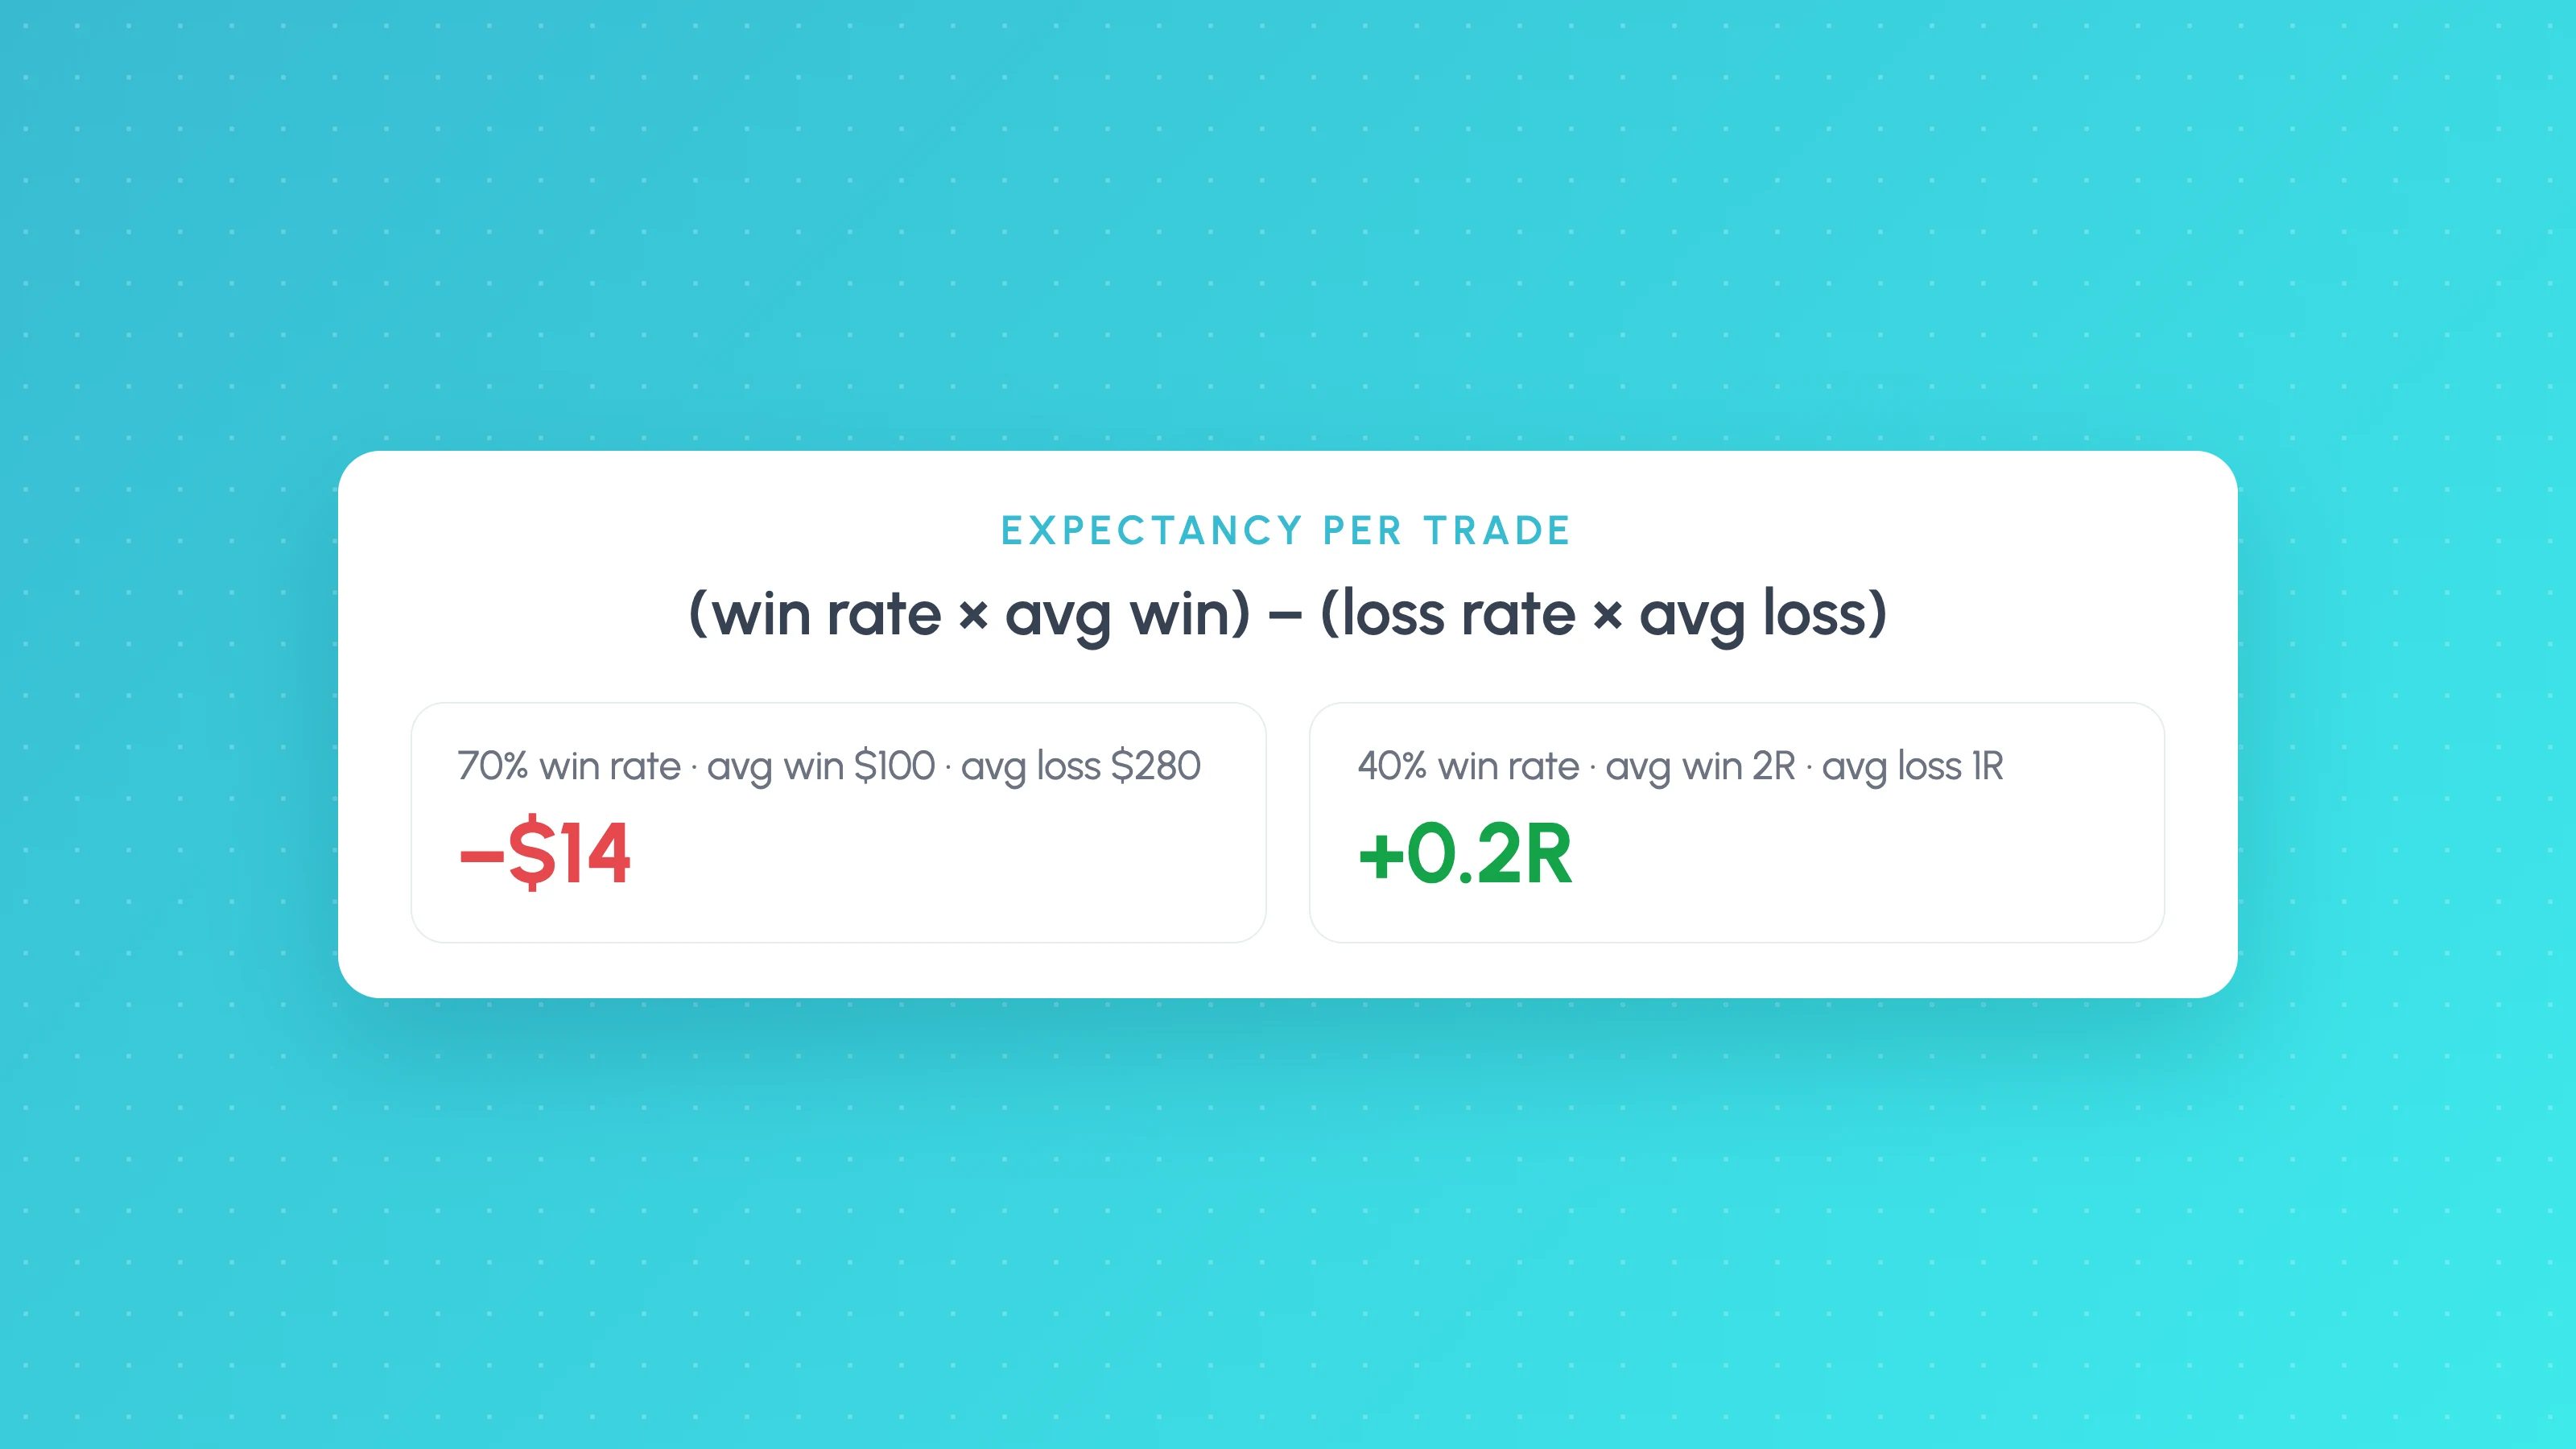
The trading expectancy formula is (win rate x average win) minus (loss rate x average loss), and the result is the average amount a strategy makes or loses per trade. A positive expectancy means the strategy made money on average over the trades measured; a negative one means it lost, whatever its win rate.
Expectancy is the most direct answer to "does this strategy make money per trade, and how much?". It is also easy to misread, because a single number hides how much it depends on sample size and on the conditions the trades were taken in. This guide covers the formula in currency and in R-multiples, a worked example, why a high win rate can still lose, and how to calculate it in a spreadsheet.
The expectancy formula
Expectancy = (Win rate x Average win) - (Loss rate x Average loss)Win rate and loss rate are fractions that add up to 1 (ignoring breakeven trades). Average win and average loss are both positive numbers. The result is in the same unit as the averages: dollars, points or R.
There is a shortcut that gives the same answer: expectancy is simply the average P&L of all trades. Add up every trade's result and divide by the number of trades. The formula above is useful because it shows which part, win rate or payoff, is doing the work.
Worked example in currency
Say a strategy has 120 trades: 54 winners averaging $300 and 66 losers averaging $180.
| Input | Value |
|---|---|
| Win rate | 54 / 120 = 45% |
| Loss rate | 66 / 120 = 55% |
| Average win | $300 |
| Average loss | $180 |
| Expectancy | (0.45 x $300) - (0.55 x $180) = $135 - $99 = $36 per trade |
Check it the other way: net profit is (54 x $300) - (66 x $180) = $16,200 - $11,880 = $4,320, and $4,320 / 120 trades = $36. The two methods agree.
Expectancy in R-multiples
Expectancy in currency depends on position size, so you can't compare two strategies, or the same strategy at different sizes, directly. R-multiples fix that. One R is the amount you planned to risk on a trade, usually the distance from entry to the initial stop multiplied by position size. A trade that made twice its planned risk is +2R; a trade stopped out at its planned stop is -1R.
Expectancy (R) = (Win rate x Average win in R) - (Loss rate x Average loss in R)Say a strategy wins 40% of the time, winners average 1.8R and losers average 1.0R:
(0.40 x 1.8) - (0.60 x 1.0) = 0.72 - 0.60 = 0.12R per tradeThat means for every $100 risked per trade, the strategy made $12 per trade on average. Watch the average loss: if it is well above 1R, stops are slipping or not being honoured, and that is worth looking into on its own.
Different mixes of win rate and payoff can produce the same expectancy. Each row below gives +0.2R per trade with losers at 1R:
| Win rate | Average win needed | Expectancy |
|---|---|---|
| 30% | 3.0R | +0.2R |
| 40% | 2.0R | +0.2R |
| 50% | 1.4R | +0.2R |
| 60% | 1.0R | +0.2R |
| 70% | 0.71R | +0.2R |
Why a 70% win rate can lose money
Say a strategy wins 70% of its trades, with an average win of $100 and an average loss of $280:
(0.70 x $100) - (0.30 x $280) = $70 - $84 = -$14 per tradeOver 100 trades that is a loss of $1,400, despite winning seven trades in ten. This pattern is common in strategies with tight targets and wide or no stops, and in strategies that hold losers hoping they come back.
The breakeven win rate tells you how often you need to win for a given payoff:
Breakeven win rate = Average loss / (Average win + Average loss)For the example: $280 / ($100 + $280) = 73.7%. The strategy wins 70%, so it loses. In R terms, if winners average b times the size of losers, the breakeven win rate is 1 / (1 + b):
| Average win / average loss | Breakeven win rate |
|---|---|
| 0.5 | 66.7% |
| 1.0 | 50.0% |
| 1.5 | 40.0% |
| 2.0 | 33.3% |
| 3.0 | 25.0% |
These are before costs. Commission and slippage raise every breakeven figure, and the effect is largest when average wins are small.
Expectancy and profit factor
Expectancy and profit factor use the same four inputs. Profit factor is a ratio: (win rate x average win) / (loss rate x average loss). Expectancy is the difference between the same two terms. That gives a simple link:
Expectancy = Loss rate x Average loss x (Profit factor - 1)In the currency example: 0.55 x $180 x (1.36 - 1) = $36, allowing for rounding. Expectancy is positive exactly when profit factor is above 1. Profit factor tells you how efficiently a strategy turns losses into profits; expectancy tells you how much it makes per trade in money or R.
Per trade vs per period
Expectancy per trade ignores how often a strategy trades. What you earn over a month is expectancy multiplied by the number of trades:
| Strategy | Expectancy | Trades per month | Expected per month |
|---|---|---|---|
| A | 0.5R | 4 | 2.0R |
| B | 0.1R | 40 | 4.0R |
Strategy B earns more per month on paper, but its edge per trade is small, so it is far more exposed to costs. An extra 0.05R of slippage per trade halves B's expectancy and barely dents A's. Always compare strategies on expectancy after costs.
How many trades before expectancy means anything?
Expectancy is an average, and averages from small samples are noisy. A quick check is the standard error: the standard deviation of trade results divided by the square root of the number of trades. If expectancy is less than about two standard errors above zero, the result could be noise.
In the currency example, the standard deviation of trade results is about $240. With 120 trades, the standard error is $240 / 10.95 = about $22, and two standard errors is about $44. The $36 expectancy is below that, so 120 trades isn't enough to rule out luck. You would need roughly (2 x 240 / 36) squared, about 178 trades, with the same results before the expectancy cleared that bar. Our guide to backtest sample size goes further into this.
Expectancy by market condition
A strategy's overall expectancy is the trade-weighted average of its expectancy in each condition it traded. Breaking it down often shows where the edge actually comes from. Say a strategy has 150 trades:
| Weekday | Trades | Expectancy |
|---|---|---|
| Monday | 28 | -0.15R |
| Tuesday to Thursday | 92 | +0.22R |
| Friday | 30 | +0.05R |
| All | 150 | +0.12R |
Monday loses, Tuesday to Thursday carries the result, and Friday barely pays for its costs. With 28 and 30 trades, the Monday and Friday figures are hypotheses to test on more data, not conclusions. Tessera's statistics dashboard shows results by symbol and session from your imported trades, and the reports split them by weekday, time of day and volatility with the trade count behind each slice.
Expectancy formulas for a spreadsheet
Put each trade's net P&L in column D (rows 2 to 500). These work in Excel and Google Sheets:
| Measure | Formula |
|---|---|
| Win rate | =COUNTIF(D2:D500,">0")/COUNT(D2:D500) |
| Average win | =AVERAGEIF(D2:D500,">0") |
| Average loss | =ABS(AVERAGEIF(D2:D500,"<0")) |
| Expectancy | =AVERAGE(D2:D500) |
| Standard error | =STDEV.S(D2:D500)/SQRT(COUNT(D2:D500)) |
For expectancy in R, add a column E with each trade's P&L divided by its planned risk, then use =AVERAGE(E2:E500). If your export lists an entry and an exit row for each trade, filter to one row per trade first.
To see expectancy split by session, weekday and volatility without building the sheet, run your trades from a synced broker, a platform export or any spreadsheet through the free Entry Analysis report.
If you'd rather not build the sheet, the free expectancy calculator works it out from a win rate and average win and loss, or from a pasted list of trades. Tessera's statistics dashboard shows expectancy for every strategy you import, alongside profit factor and drawdown.
Frequently asked questions
- What is a good trading expectancy?
- Any positive expectancy after costs, measured on enough trades to rule out luck, is a working edge. In R terms, many systematic traders consider 0.1R to 0.3R per trade solid for a strategy that trades often, but what matters is that the number survives costs and holds on data the strategy wasn't tuned on.
- How do you calculate expectancy in R?
- Divide each trade's profit or loss by the amount you planned to risk on it, then average the results. Equivalently, multiply win rate by the average win in R and subtract loss rate multiplied by the average loss in R.
- Can a strategy with a high win rate have negative expectancy?
- Yes. A 70% win rate with an average win of $100 and an average loss of $280 has an expectancy of minus $14 per trade. It needs to win about 73.7% of the time just to break even before costs.
- What is the difference between expectancy and profit factor?
- Both use win rate, average win and average loss. Profit factor divides total wins by total losses, so it is a ratio with no units. Expectancy subtracts them per trade, so it is in money or R. Expectancy is positive whenever profit factor is above 1.
- Is expectancy the same as average trade?
- Yes, in practice. The average net P&L across all trades equals the expectancy formula's result for the same trades. The formula version is useful because it separates the contribution of win rate from the contribution of payoff size.
Keep reading
 Trading metrics
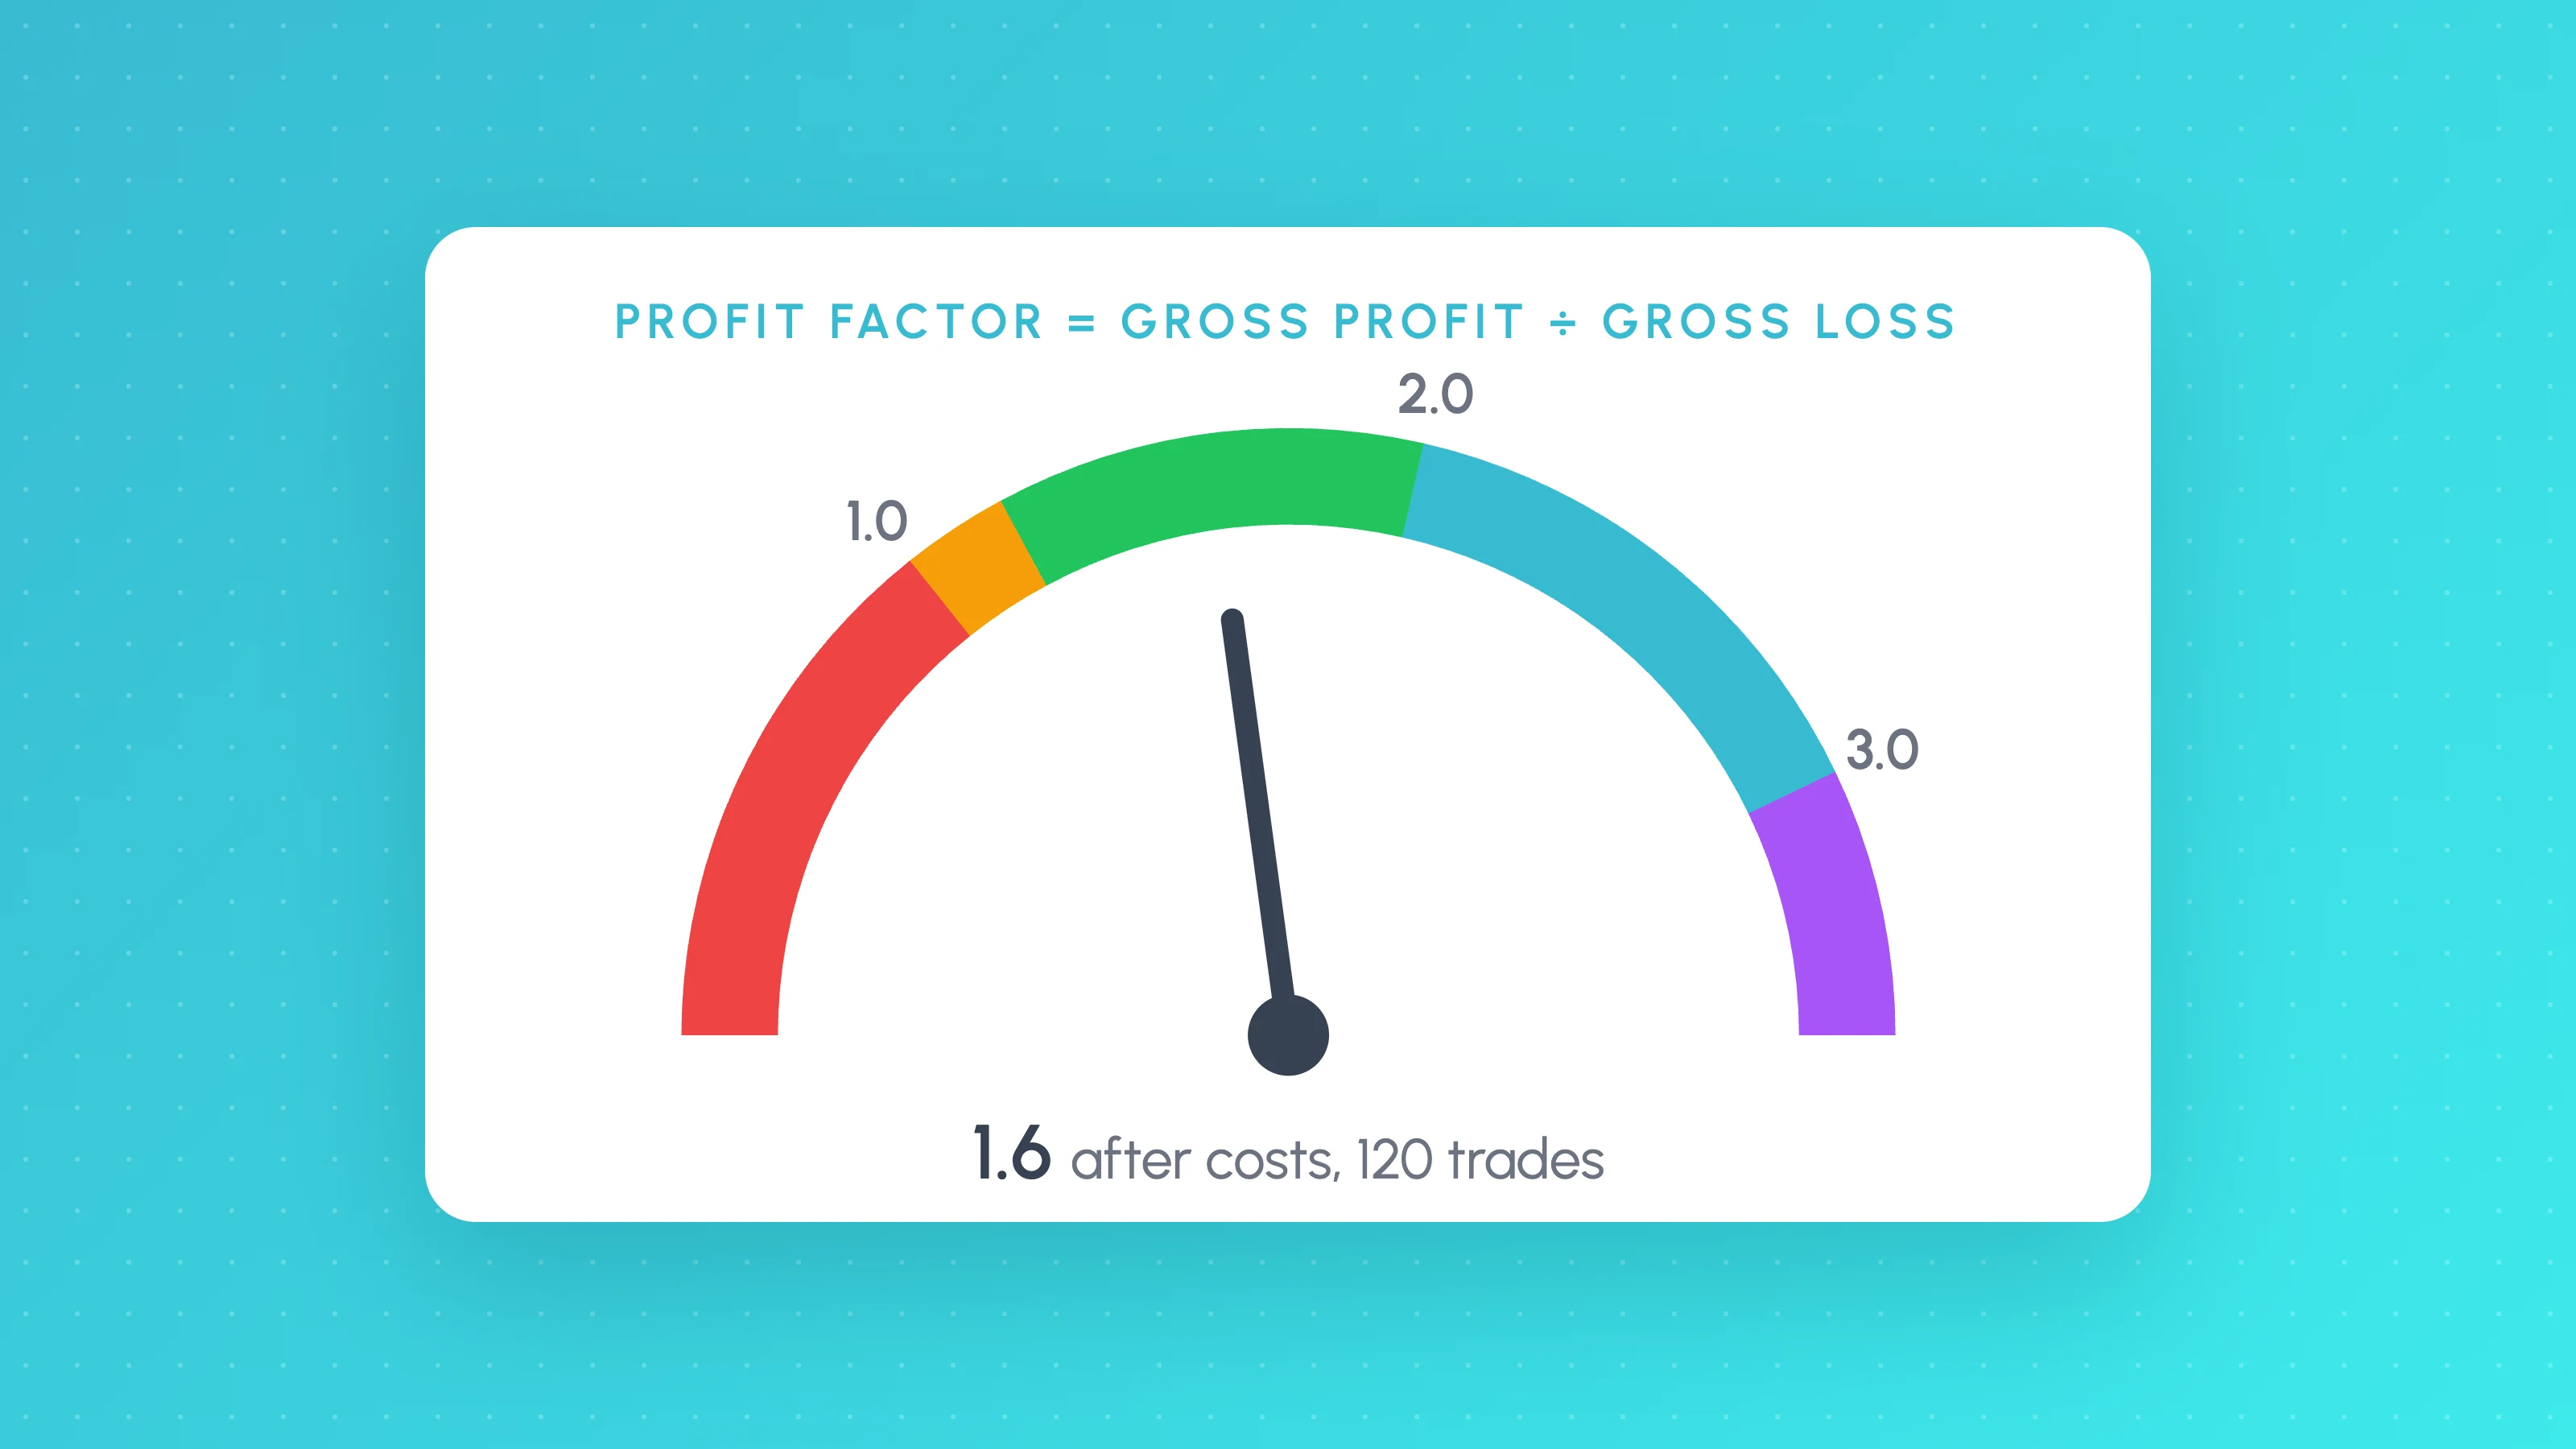
What Is a Good Profit Factor? Formula, Ranges and Red Flags
A good profit factor is usually 1.3 to 2.0 after costs on 100+ trades. See the formula, a worked example, a spreadsheet calculator and why above 3 is a warning.
 Trading metrics
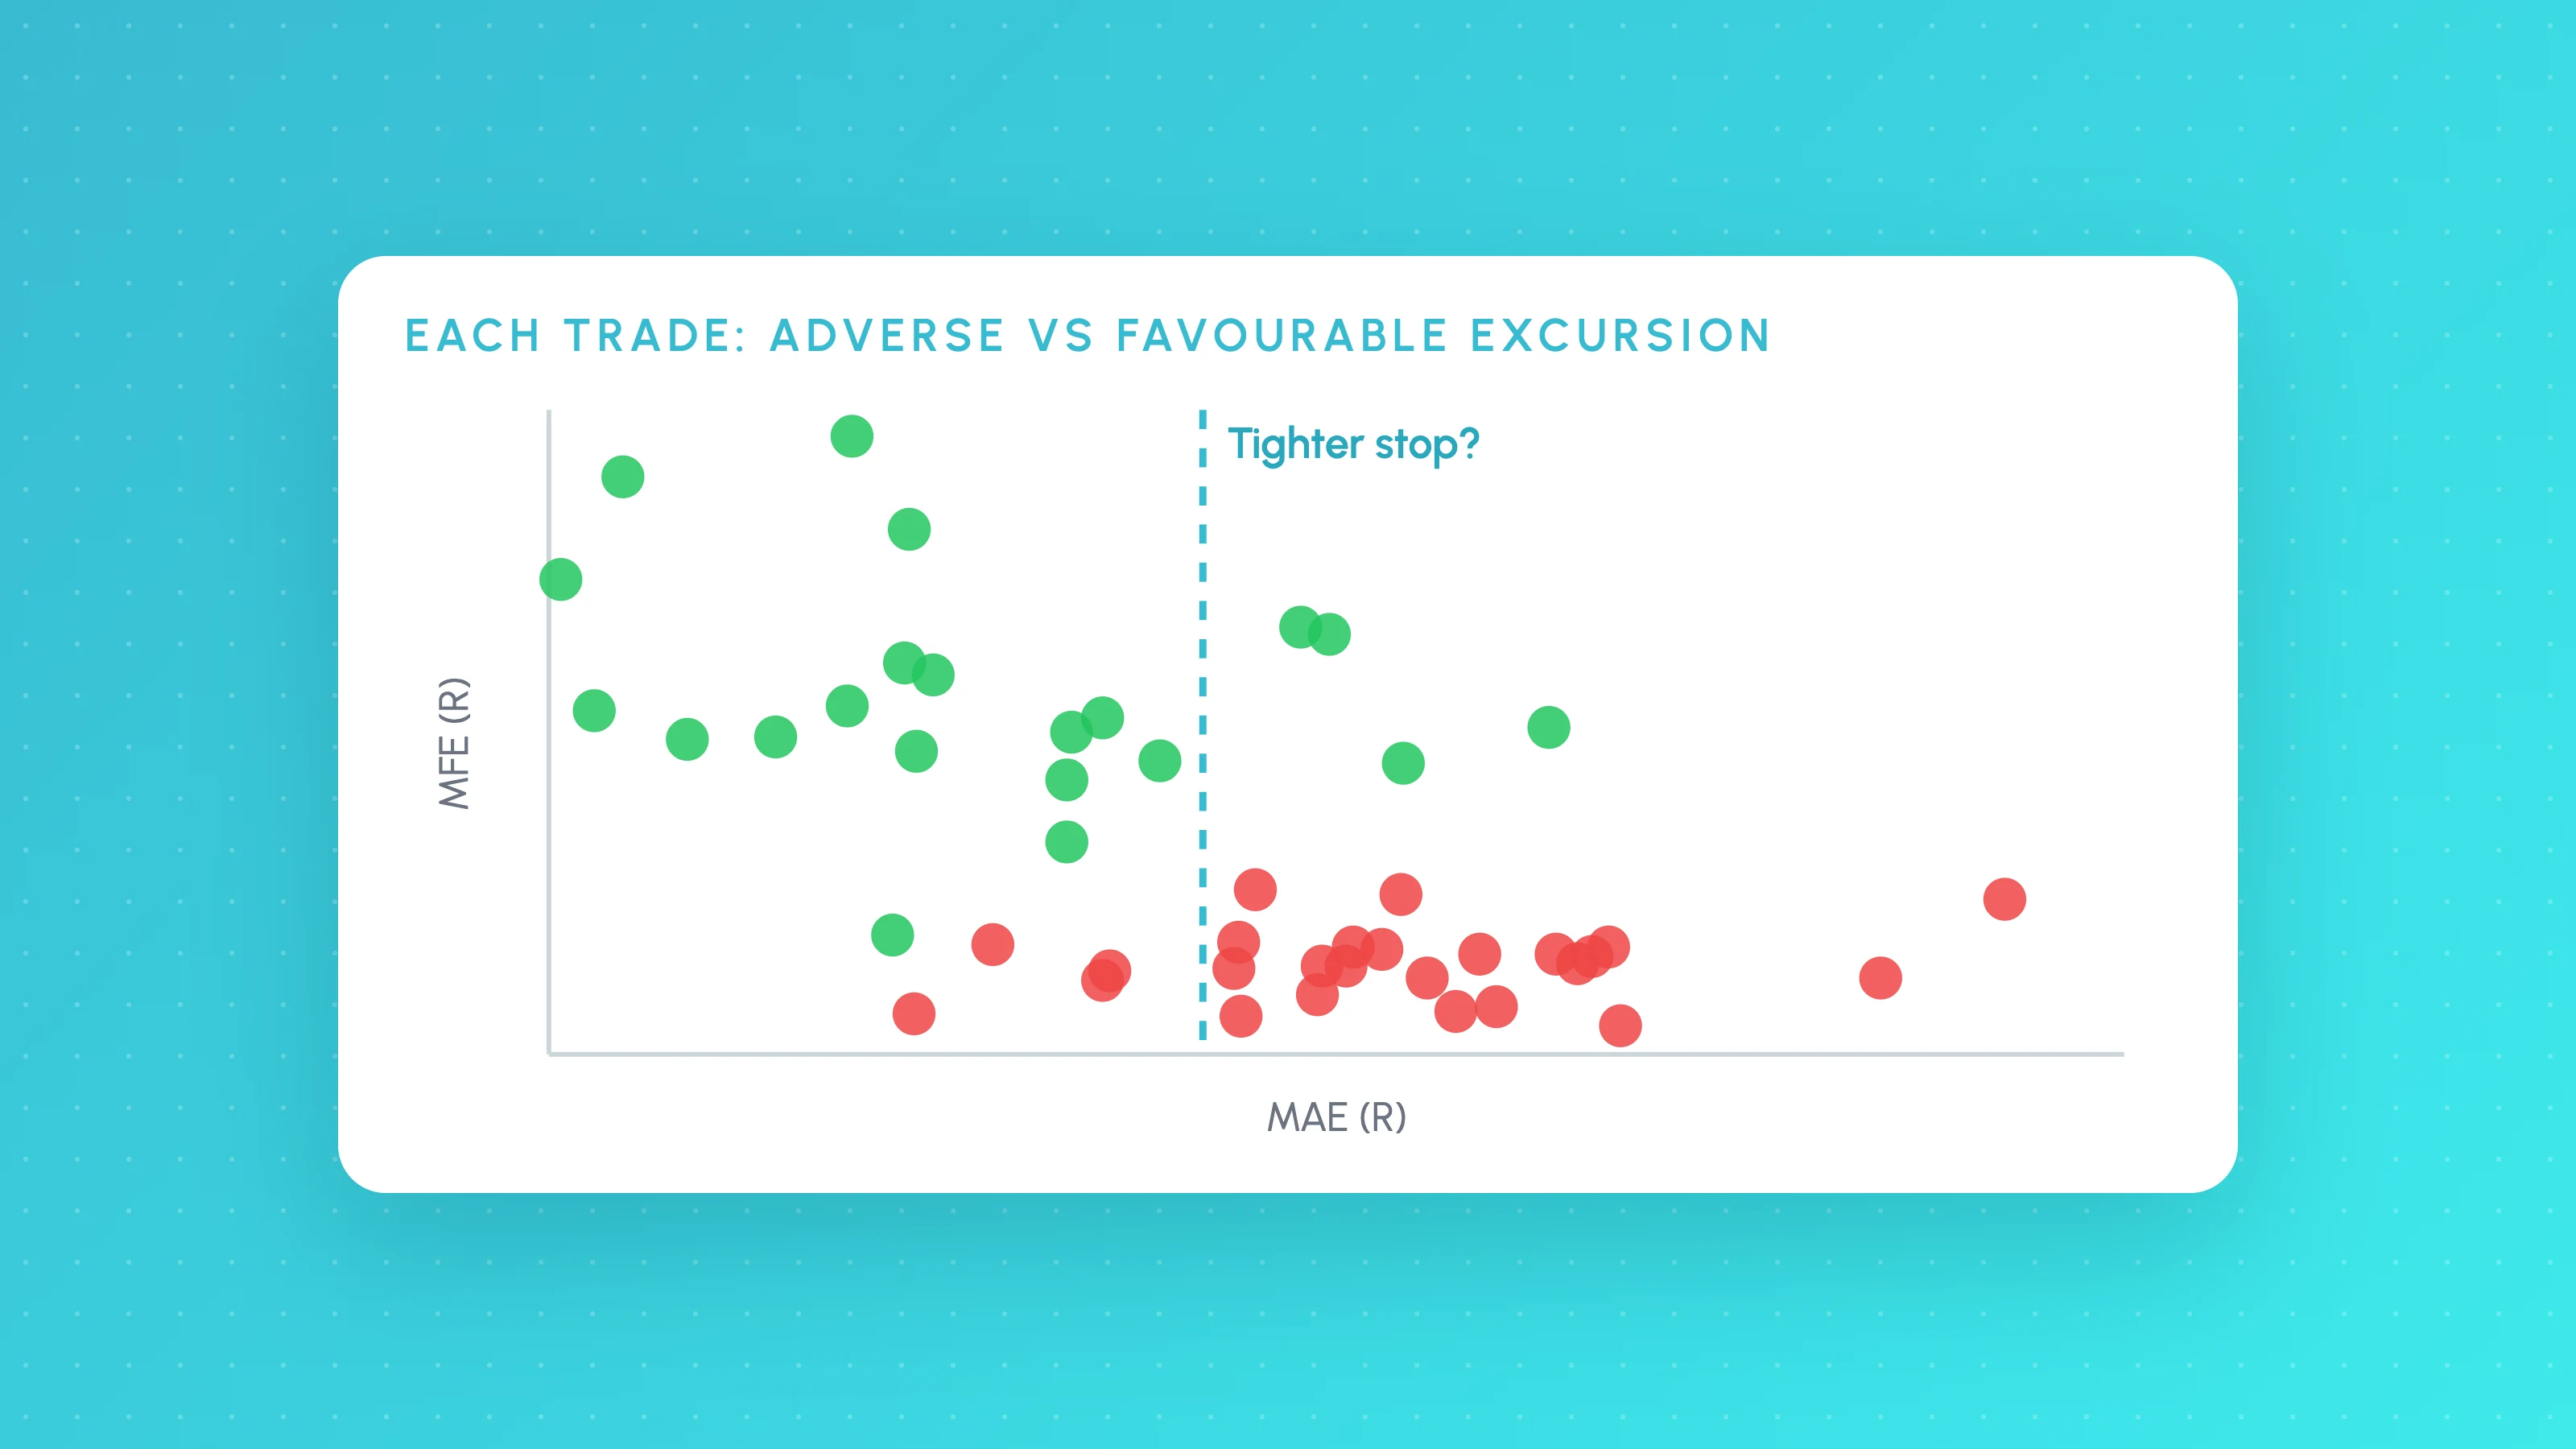
MAE and MFE Analysis: Set Stops and Targets From Your Own Trades
How to calculate MAE and MFE for each trade, read the scatter plots, set stops from winners' MAE and targets from MFE, then test the change on real candles.
 TradingView backtests
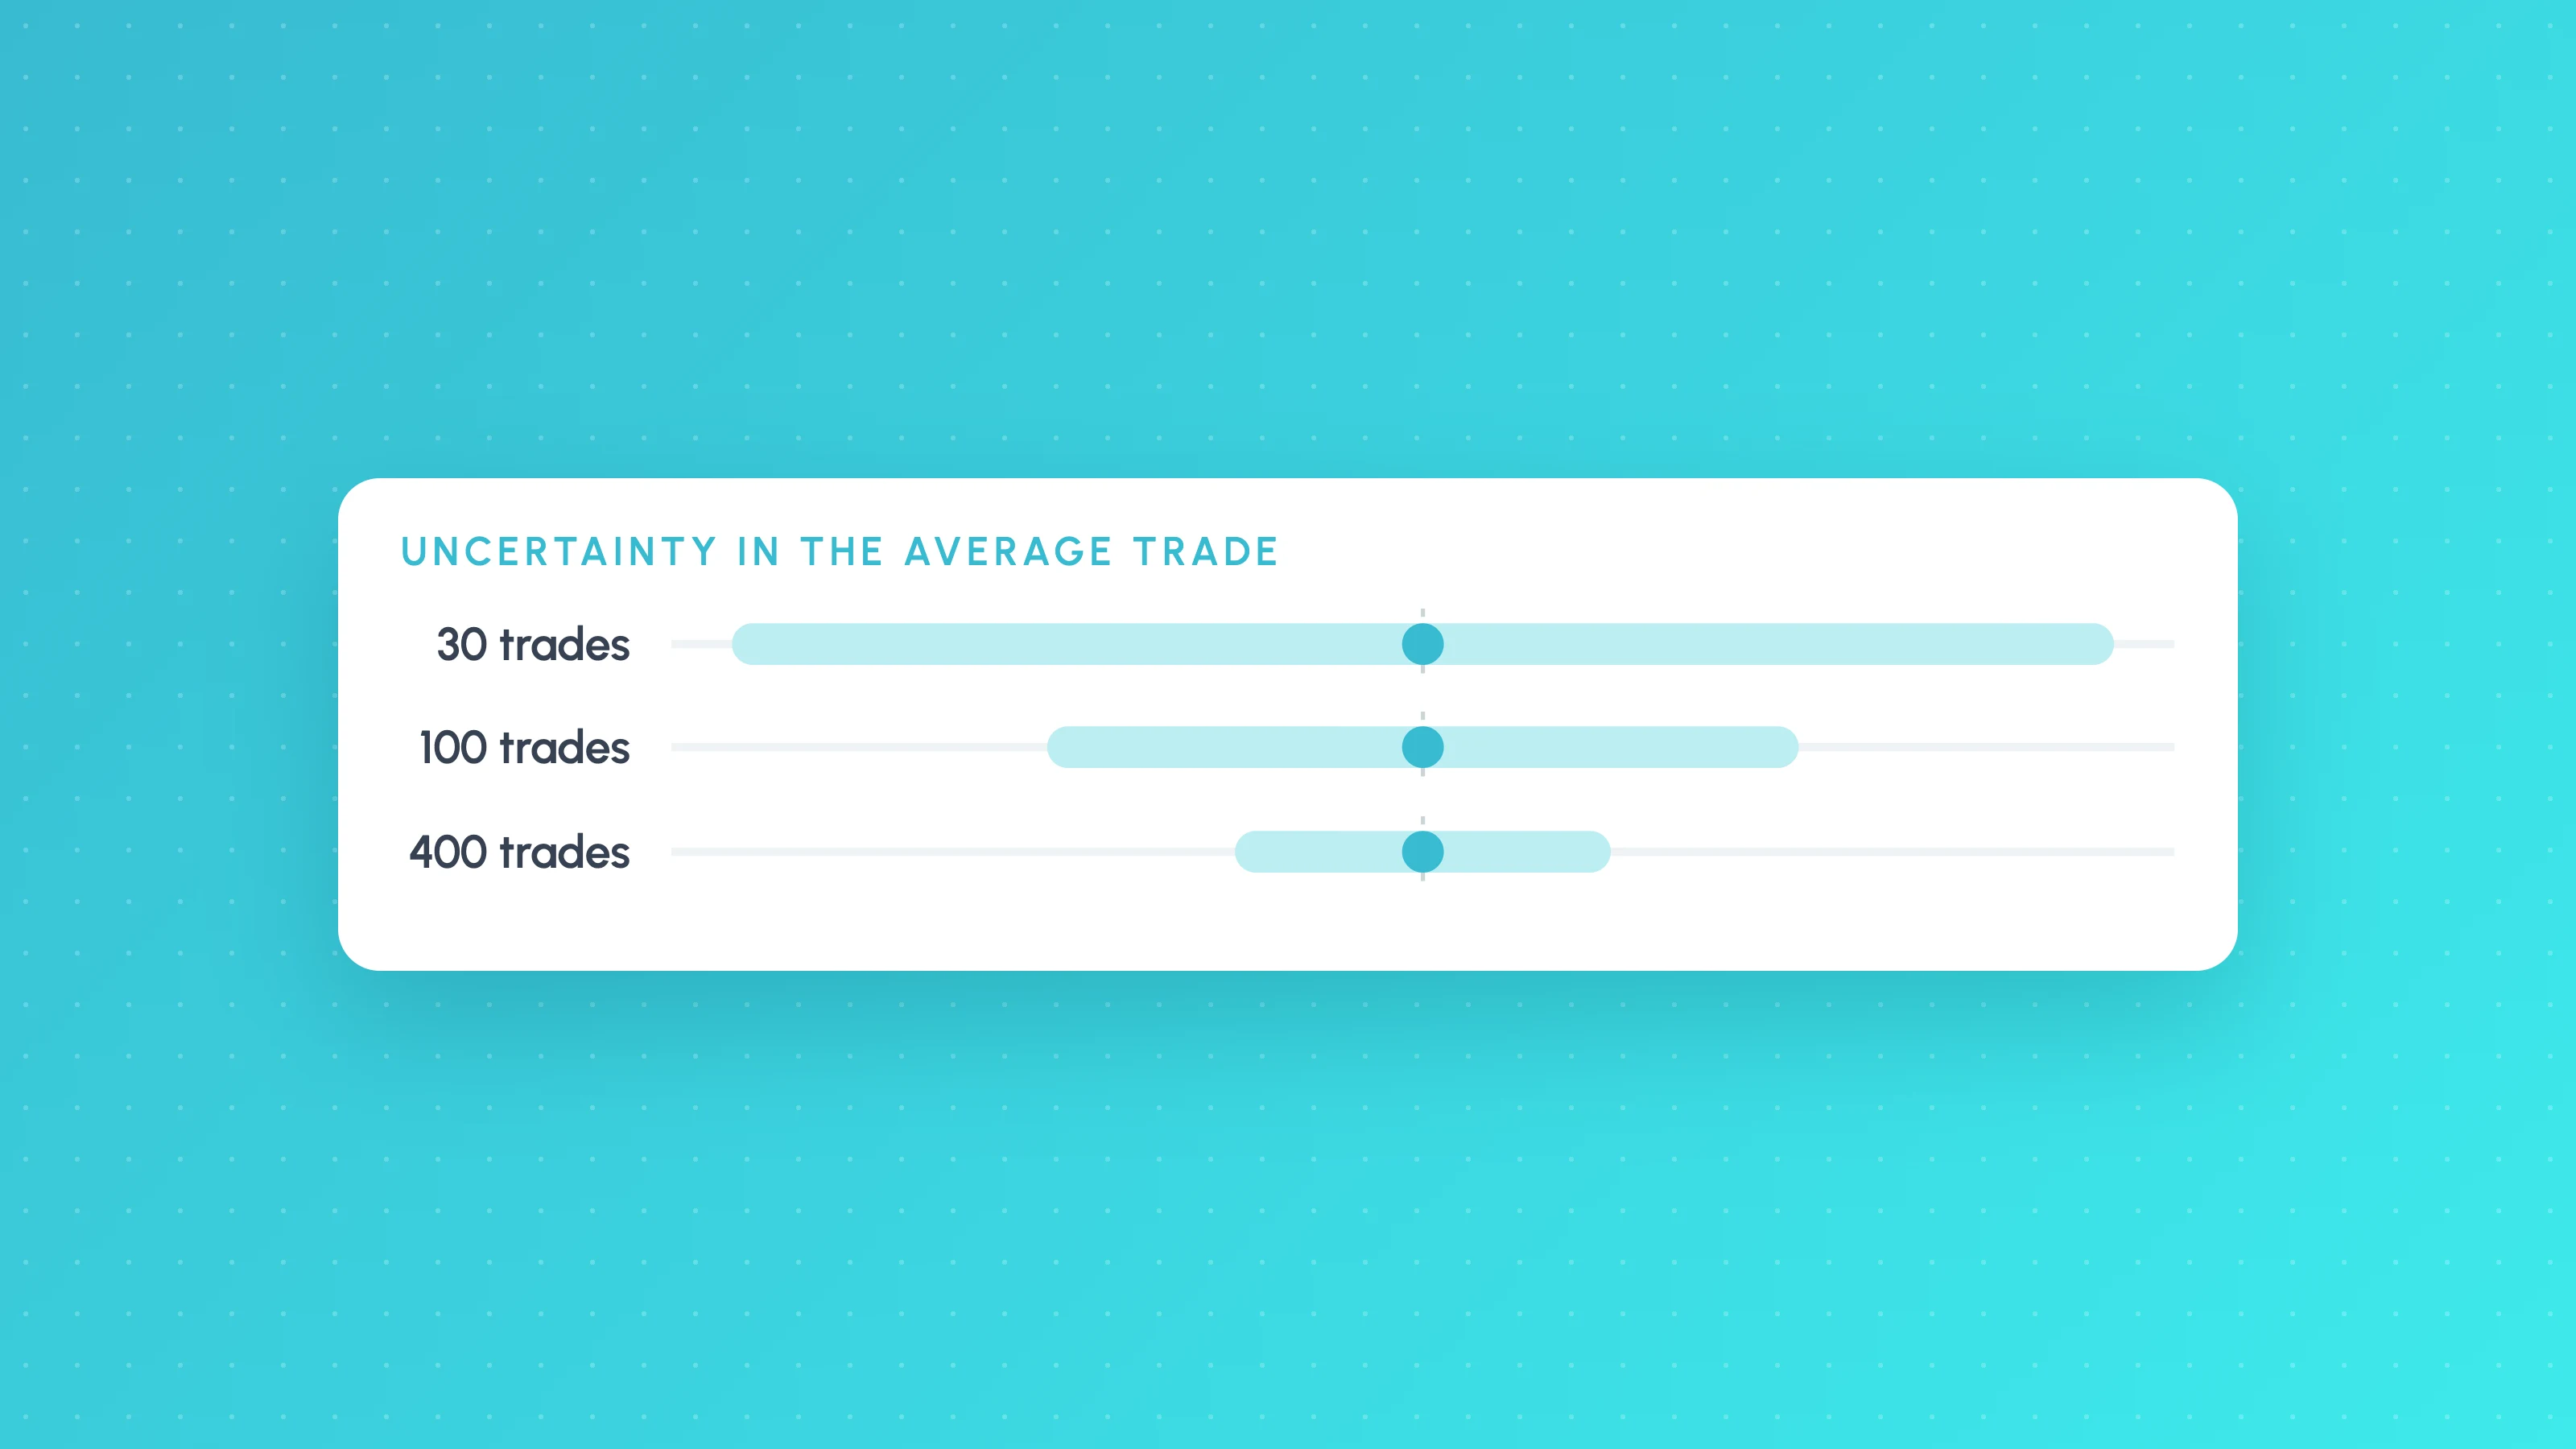
How Many Trades Do You Need for a Valid Backtest?
How many trades a backtest needs: rules of thumb, the t-statistic formula with a worked example, a table by edge size, per-bucket minimums and multiple testing.