

How Many Trades Do You Need for a Valid Backtest?
How many trades a backtest needs: rules of thumb, the t-statistic formula with a worked example, a table by edge size, per-bucket minimums and multiple testing.
By Tessera Trades · Updated · 7 min read
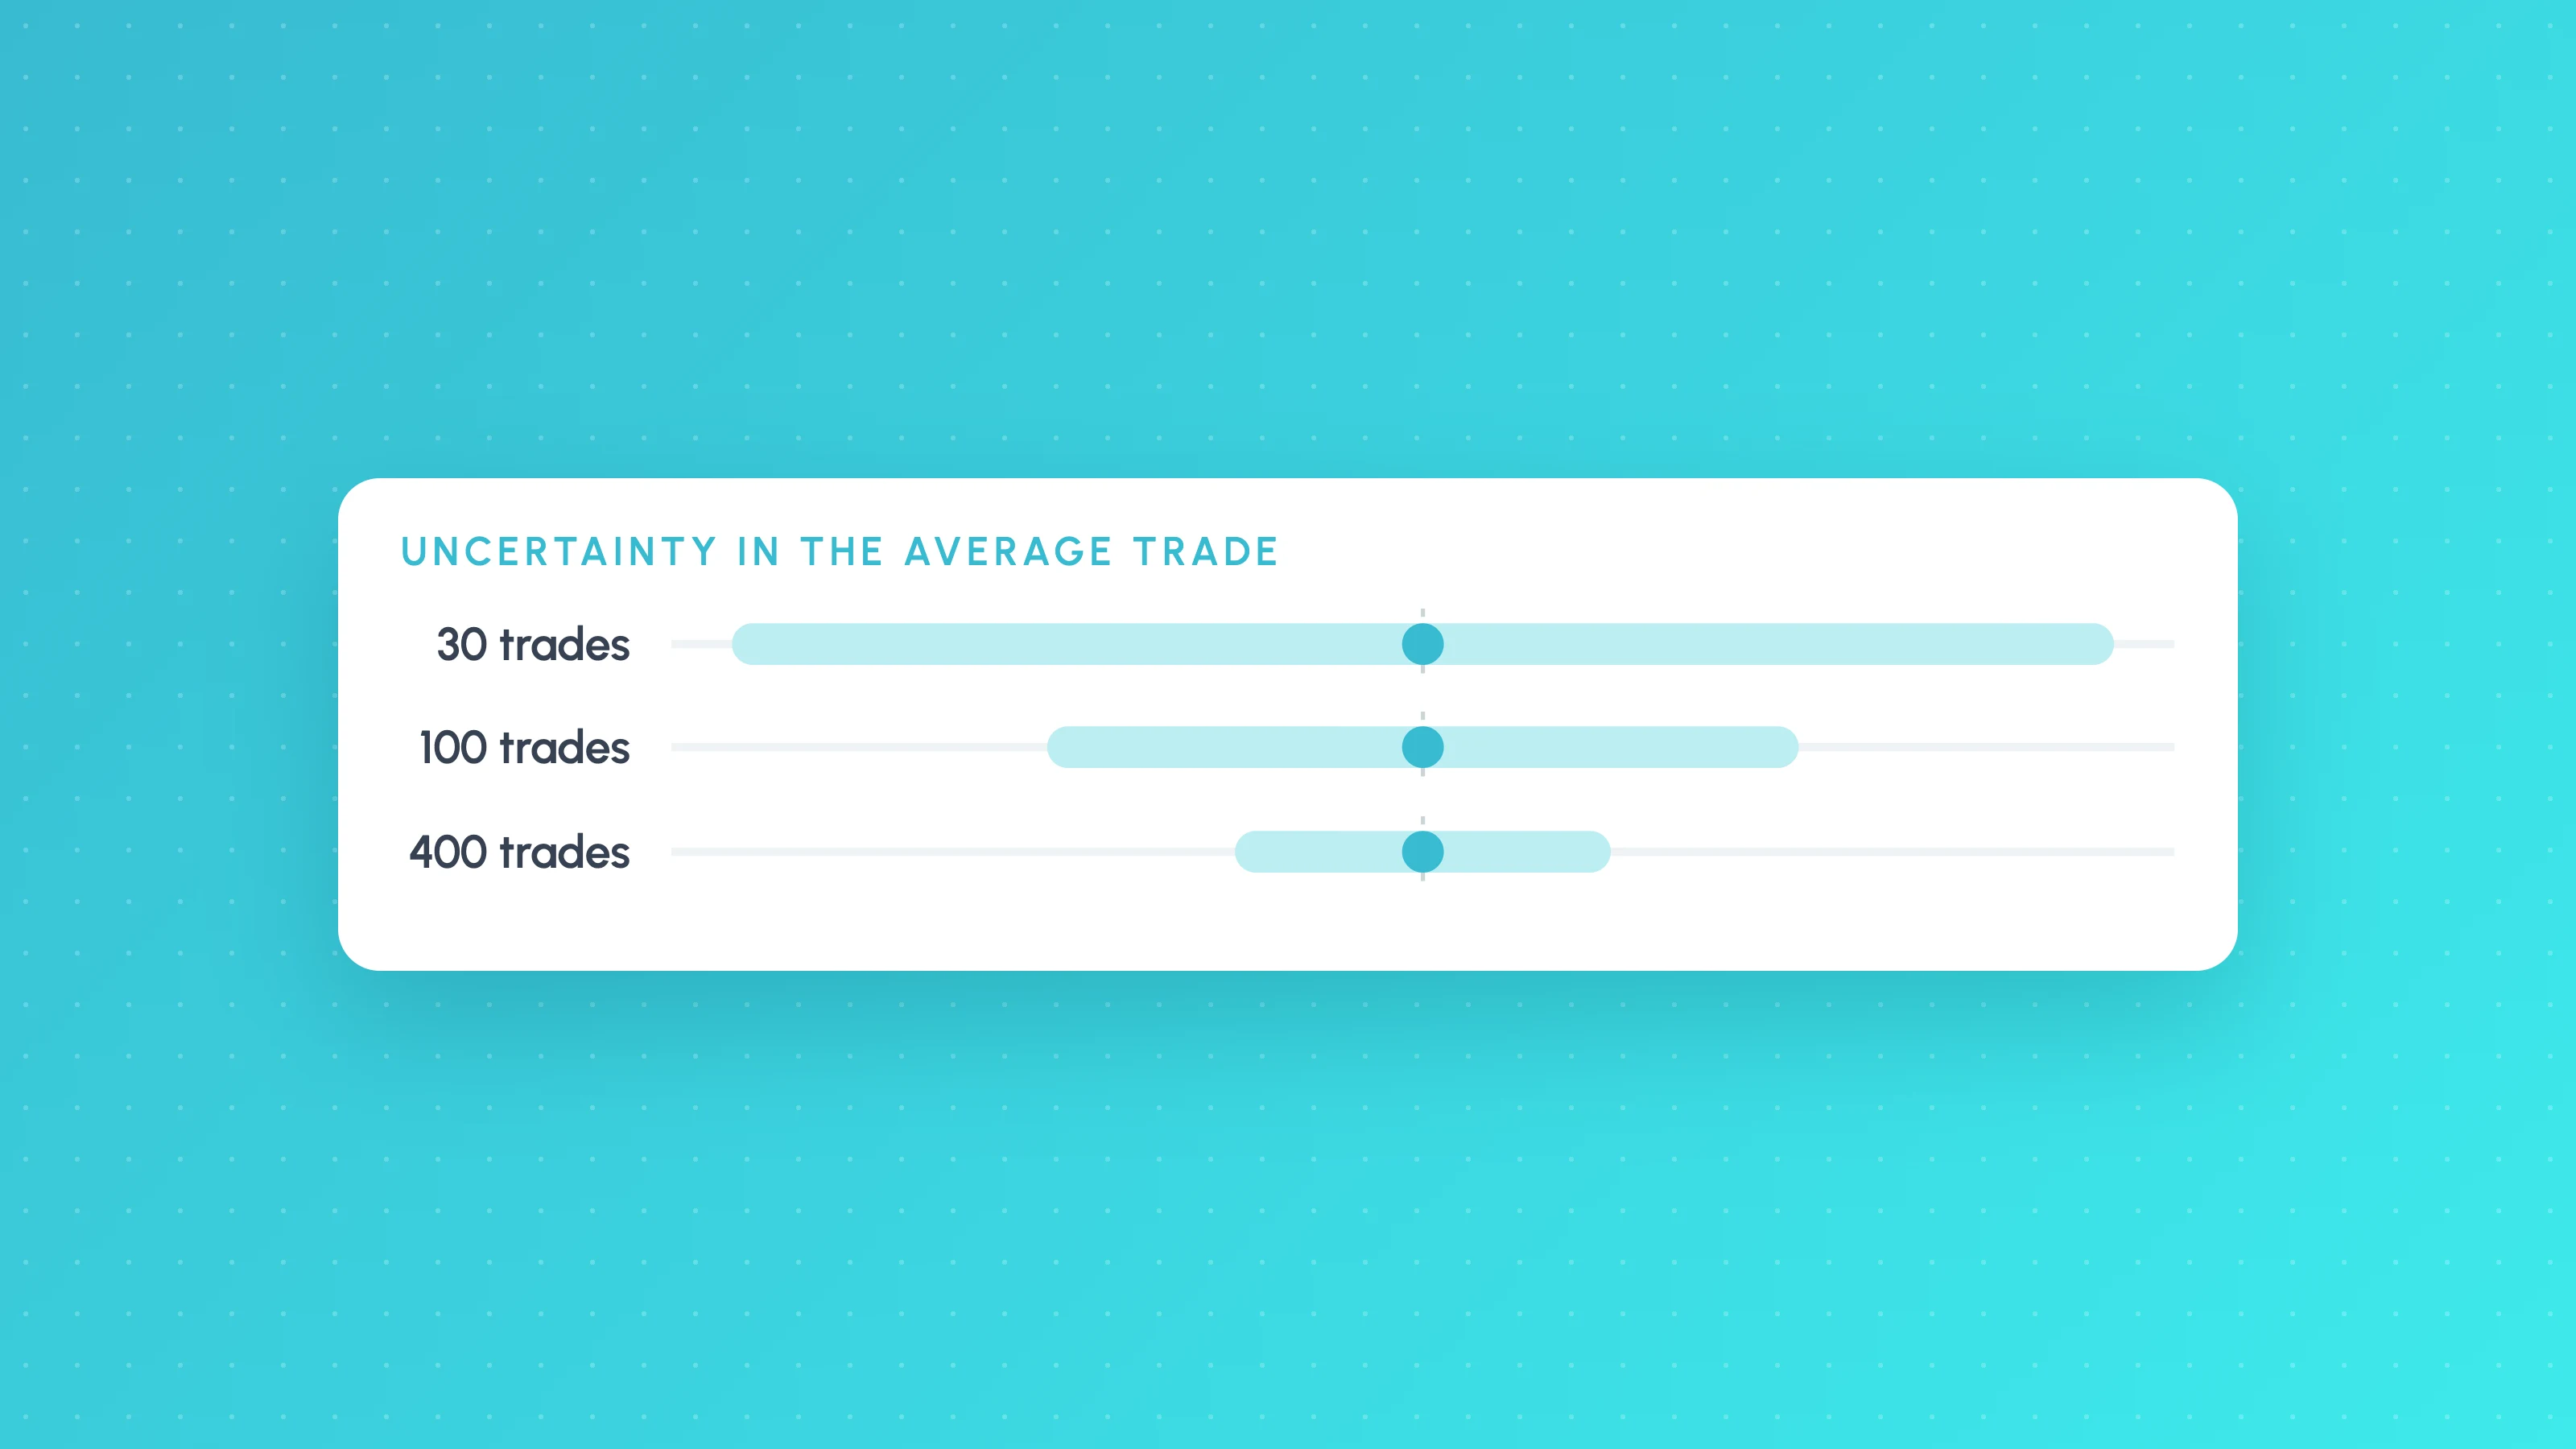
As a rule of thumb, a backtest needs at least 100 trades to say anything useful, and at least 30 in any session, weekday or other slice you act on. The real answer depends on the size of the edge compared with how much results vary: to reach a t-statistic of about 2 you need n = (2 ÷ (average trade ÷ standard deviation))² trades, which is 100 trades when the average trade is a fifth of the standard deviation and 400 when it's a tenth.
Forum answers to this question range from 20 trades to 10,000, usually without reasons. This guide shows where the numbers come from, so you can work out the figure for your own strategy from your trade export.
The rules of thumb, and why they're only a start
| Sample | What it can tell you |
|---|---|
| Under 30 trades | Almost nothing. A few big trades can produce the whole result. |
| 30 to 100 trades | Whether a large edge might exist. Small edges are invisible. |
| 100 to 300 trades | Enough to judge a moderate edge, if the strategy is simple. |
| Several hundred or more | Needed for small edges, many filters, or slicing by condition. |
These numbers are reasonable defaults, but they ignore the two things that actually decide the answer: how big the edge is, and how noisy each trade's result is. A strategy that makes 0.5R per trade with steady results proves itself quickly. One that makes 0.05R per trade with wild swings needs thousands of trades.
The maths: standard error of the average trade
The number that matters most in a backtest is the average trade (expectancy). Its uncertainty is the standard error:
standard error = standard deviation of trade results ÷ √(number of trades)The standard deviation measures how much individual trades vary. Dividing by the square root of the trade count means precision improves slowly: four times as many trades only halves the standard error.
A simple t-statistic on per-trade returns
To ask "is the average trade distinguishable from zero?", divide the average by its standard error:
t = average trade ÷ (standard deviation ÷ √n)A t-statistic around 2 or above means an average this far from zero would be unusual if the true edge were zero (roughly the 95% level for samples of this size). Below about 2, the result is within what luck alone often produces.
In a spreadsheet, with trade results in column C:
=AVERAGE(C2:C241)/(STDEV.S(C2:C241)/SQRT(COUNT(C2:C241)))Worked example
Say a strategy has 120 trades with an average of $25 and a standard deviation of $250.
- Square root of 120 ≈ 10.95
- Standard error = 250 ÷ 10.95 ≈ $22.82
- t = 25 ÷ 22.82 ≈ 1.10
A t of 1.10 means the $25 average is well within the range luck could produce. The strategy might have an edge, but 120 trades can't show it. The average is a tenth of the standard deviation (25 ÷ 250 = 0.1), so to reach t ≈ 2 at the same average and spread it would need (2 ÷ 0.1)² = 400 trades.
How required trades scale with edge size
Rearranging the t-statistic gives the number of trades needed to reach a target t:
n = (target t ÷ (average trade ÷ standard deviation))²The ratio average ÷ standard deviation is the edge per unit of noise. Halve it and you need four times as many trades.
| Average trade ÷ standard deviation | Trades for t ≈ 2 | Trades for t ≈ 3 |
|---|---|---|
| 0.05 | 1,600 | 3,600 |
| 0.10 | 400 | 900 |
| 0.15 | 178 | 400 |
| 0.20 | 100 | 225 |
| 0.25 | 64 | 144 |
| 0.30 | 45 | 100 |
| 0.50 | 16 | 36 |
The t ≈ 3 column matters when you've tested many versions or many slices (see multiple testing below).
Example in R multiples
Say a strategy wins 40% of the time, winners make 2R and losers lose 1R.
- Average trade = 0.4 × 2 − 0.6 × 1 = 0.2R
- Average squared result = 0.4 × 4 + 0.6 × 1 = 2.2, so variance = 2.2 − 0.2² = 2.16 and standard deviation ≈ 1.47R
- Edge per unit of noise = 0.2 ÷ 1.47 ≈ 0.136
- Trades for t ≈ 2 = (2 ÷ 0.136)² ≈ 216
So a perfectly decent 2:1 strategy at a 40% win rate needs over 200 trades before its edge clearly separates from noise. With 100 trades its t-statistic would be about 1.36.
What about the win rate?
Win rates are noisy too. The standard error of a win rate p over n trades is √(p × (1 − p) ÷ n). At a 50% win rate:
- 30 trades: standard error ≈ 9.1 percentage points, so a roughly 95% range of about ±18 points
- 100 trades: standard error 5 points, a range of about ±10 points
A strategy showing 60% wins over 30 trades could easily be a 45% strategy.
Minimum trades per bucket
When you split a backtest by session, weekday, hour or volatility, each bucket is a small backtest of its own and needs its own sample. A strategy with 240 trades split five ways has about 48 per bucket, and splitting by hour can leave buckets in single digits.
Working rules for buckets:
- Under about 30 trades, ignore the bucket. Treat it as unknown rather than good or bad.
- Above that, calculate the bucket's own t-statistic. Say a bucket has 40 trades averaging 0.5R with a standard deviation of 1.5R: t = 0.5 ÷ (1.5 ÷ √40) = 0.5 ÷ 0.237 ≈ 2.11. That's worth a closer look.
- To decide whether two buckets differ (London versus New York, say), you need even more trades, because the uncertainty of both buckets adds together.
How to analyse a TradingView backtest shows how to build these buckets from a Strategy Tester export, and exporting TradingView Strategy Tester results covers getting the file.
The multiple-testing penalty
A t of 2 corresponds to about a 5% chance of a false positive for one test. Look at 20 buckets of a strategy with no edge at all, and on average one of them will cross t = 2 by luck; the chance that at least one does is about 64% (1 − 0.95²⁰). The same applies to strategy versions: the best of 30 variations is not held to the standard of a single test.
Two practical adjustments:
- Raise the bar. A simple Bonferroni correction divides the 5% threshold by the number of tests. For 20 buckets that's 0.25%, which needs a t of about 3. In finance research, Harvey, Liu and Zhu argued that new factors should clear a t-ratio above 3.0 rather than the usual 2.0 because so many have been tested (". . . and the Cross-Section of Expected Returns").
- Count your tests. Every bucket you looked at and every version you tried counts, including the ones you discarded. Is my backtest overfit? covers this in more depth.
Limits of the formula
The t-statistic assumes trades are independent and drawn from a stable distribution. Real trades aren't quite: results cluster in volatile periods, fat tails make the standard deviation unstable, and markets change. Treat the formula as a minimum, not a guarantee:
- More trades over a longer and more varied period beats more trades from one market regime.
- A big t-statistic from a lookahead bug or unrealistic fills is still wrong. Check the backtest's realism first.
- A significant average in the past is evidence of an edge, not proof it will continue.
Seeing the sample behind every number
The usual mistake isn't a strategy with too few trades overall; it's acting on a slice with too few. Tessera's reports show the trade count behind every session, weekday, time of day and volatility slice, so you can see straight away which findings have a real sample behind them.
Check your own sample
Upload a Strategy Tester export or trade history to the free Entry Analysis report and see how many trades sit behind each condition. No card needed.
Frequently asked questions
- Is 100 trades enough for a backtest?
- It's enough for a moderate edge on a simple strategy, but not a small one. If your average trade is at least a fifth of the standard deviation of your trades, 100 trades gets you to a t-statistic of about 2. If it's a tenth, you need about 400.
- Is 30 trades enough to backtest a strategy?
- Only for spotting very large effects. Thirty trades leave a 50% win rate uncertain by roughly ±18 percentage points, and a few large winners can create the whole result. Use 30 as the minimum for a single slice, not for a whole strategy.
- How do I calculate statistical significance for a trading strategy?
- Take the per-trade results, calculate the average and the standard deviation, and compute t = average ÷ (standard deviation ÷ √number of trades). A t around 2 or above suggests the average is unlikely to be pure luck for a single test; if you tested many versions or slices, look for about 3.
- Do more years of data matter, or just more trades?
- Both. More trades shrink the standard error, but trades from one market regime can all share the same conditions. A sample that covers different volatility levels and trends is more convincing than the same number of trades from a single year.
- How many trades do I need before going live?
- Enough that the backtest's average trade has a t-statistic of at least about 2 after realistic costs, more if you tested many variations, and a forward test or out-of-sample period with results in the same range. Then start small, because live results will add uncertainty of their own.
Keep reading
 TradingView backtests
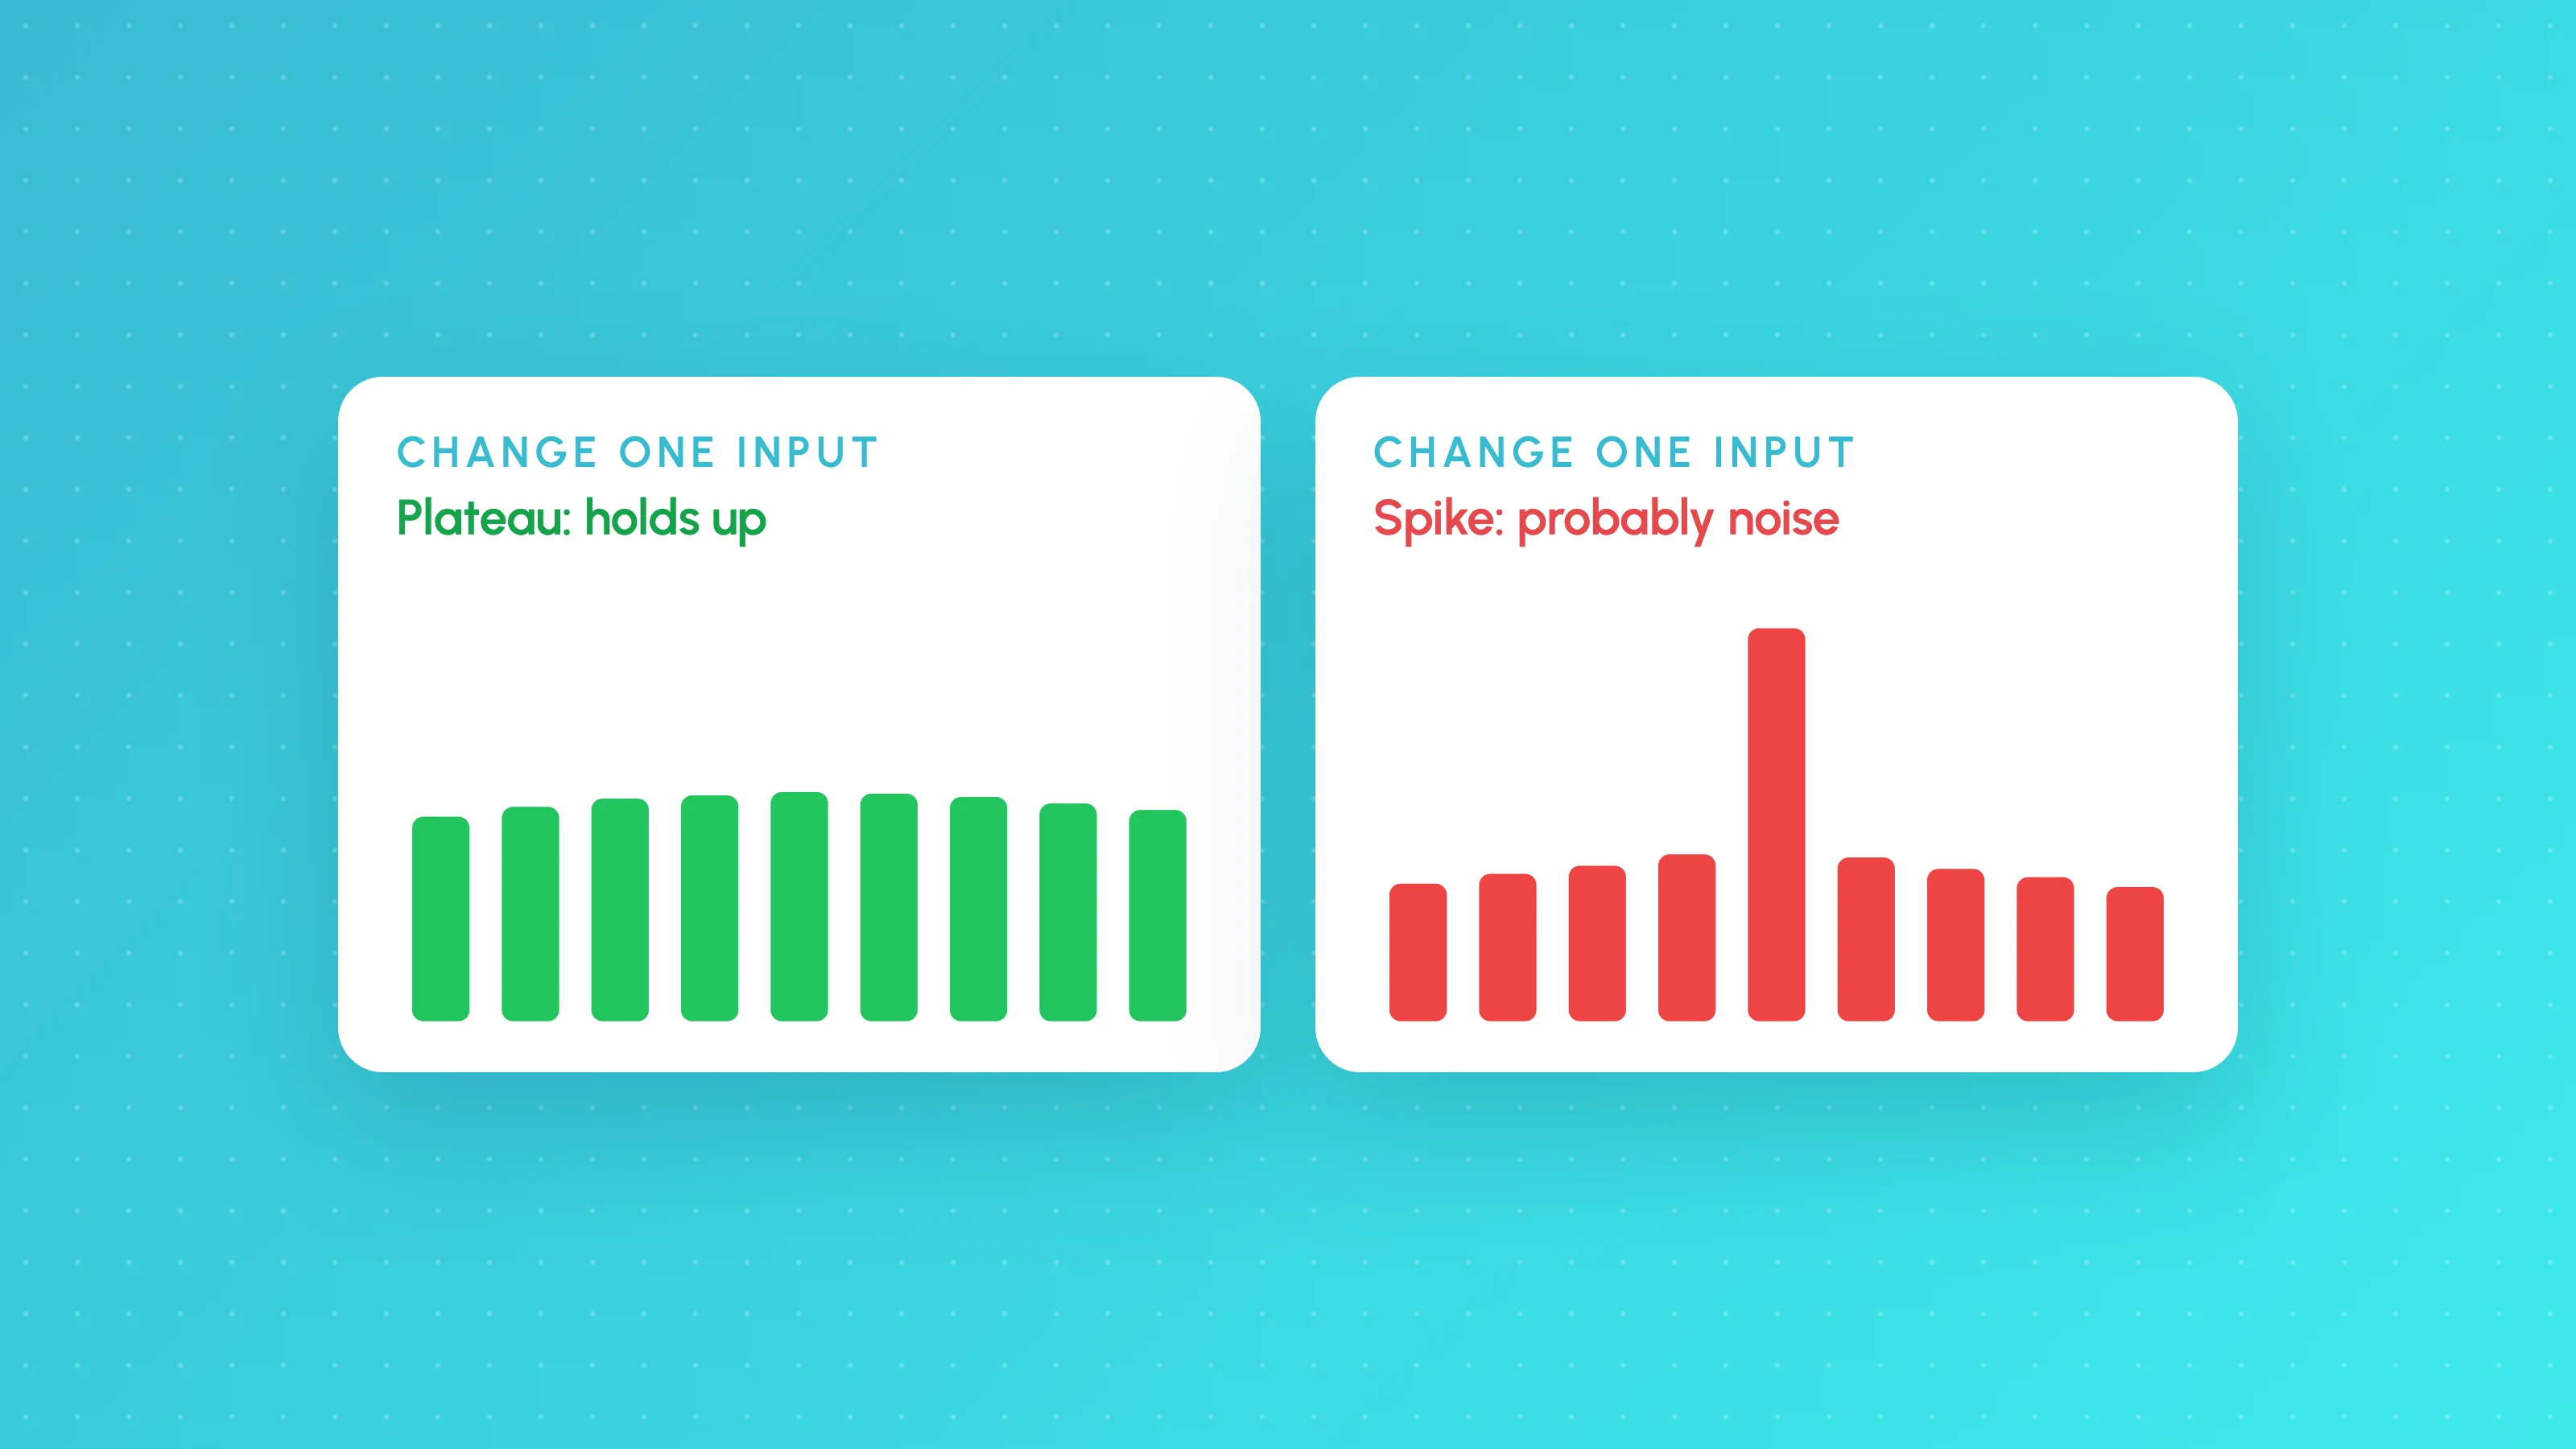
Is My Backtest Overfit? A Practical Checklist for Traders
How to tell if a backtest is overfit: too-good metrics, thin samples, fragile inputs, useless filters, out-of-sample and walk-forward tests, plus a checklist.
 TradingView backtests
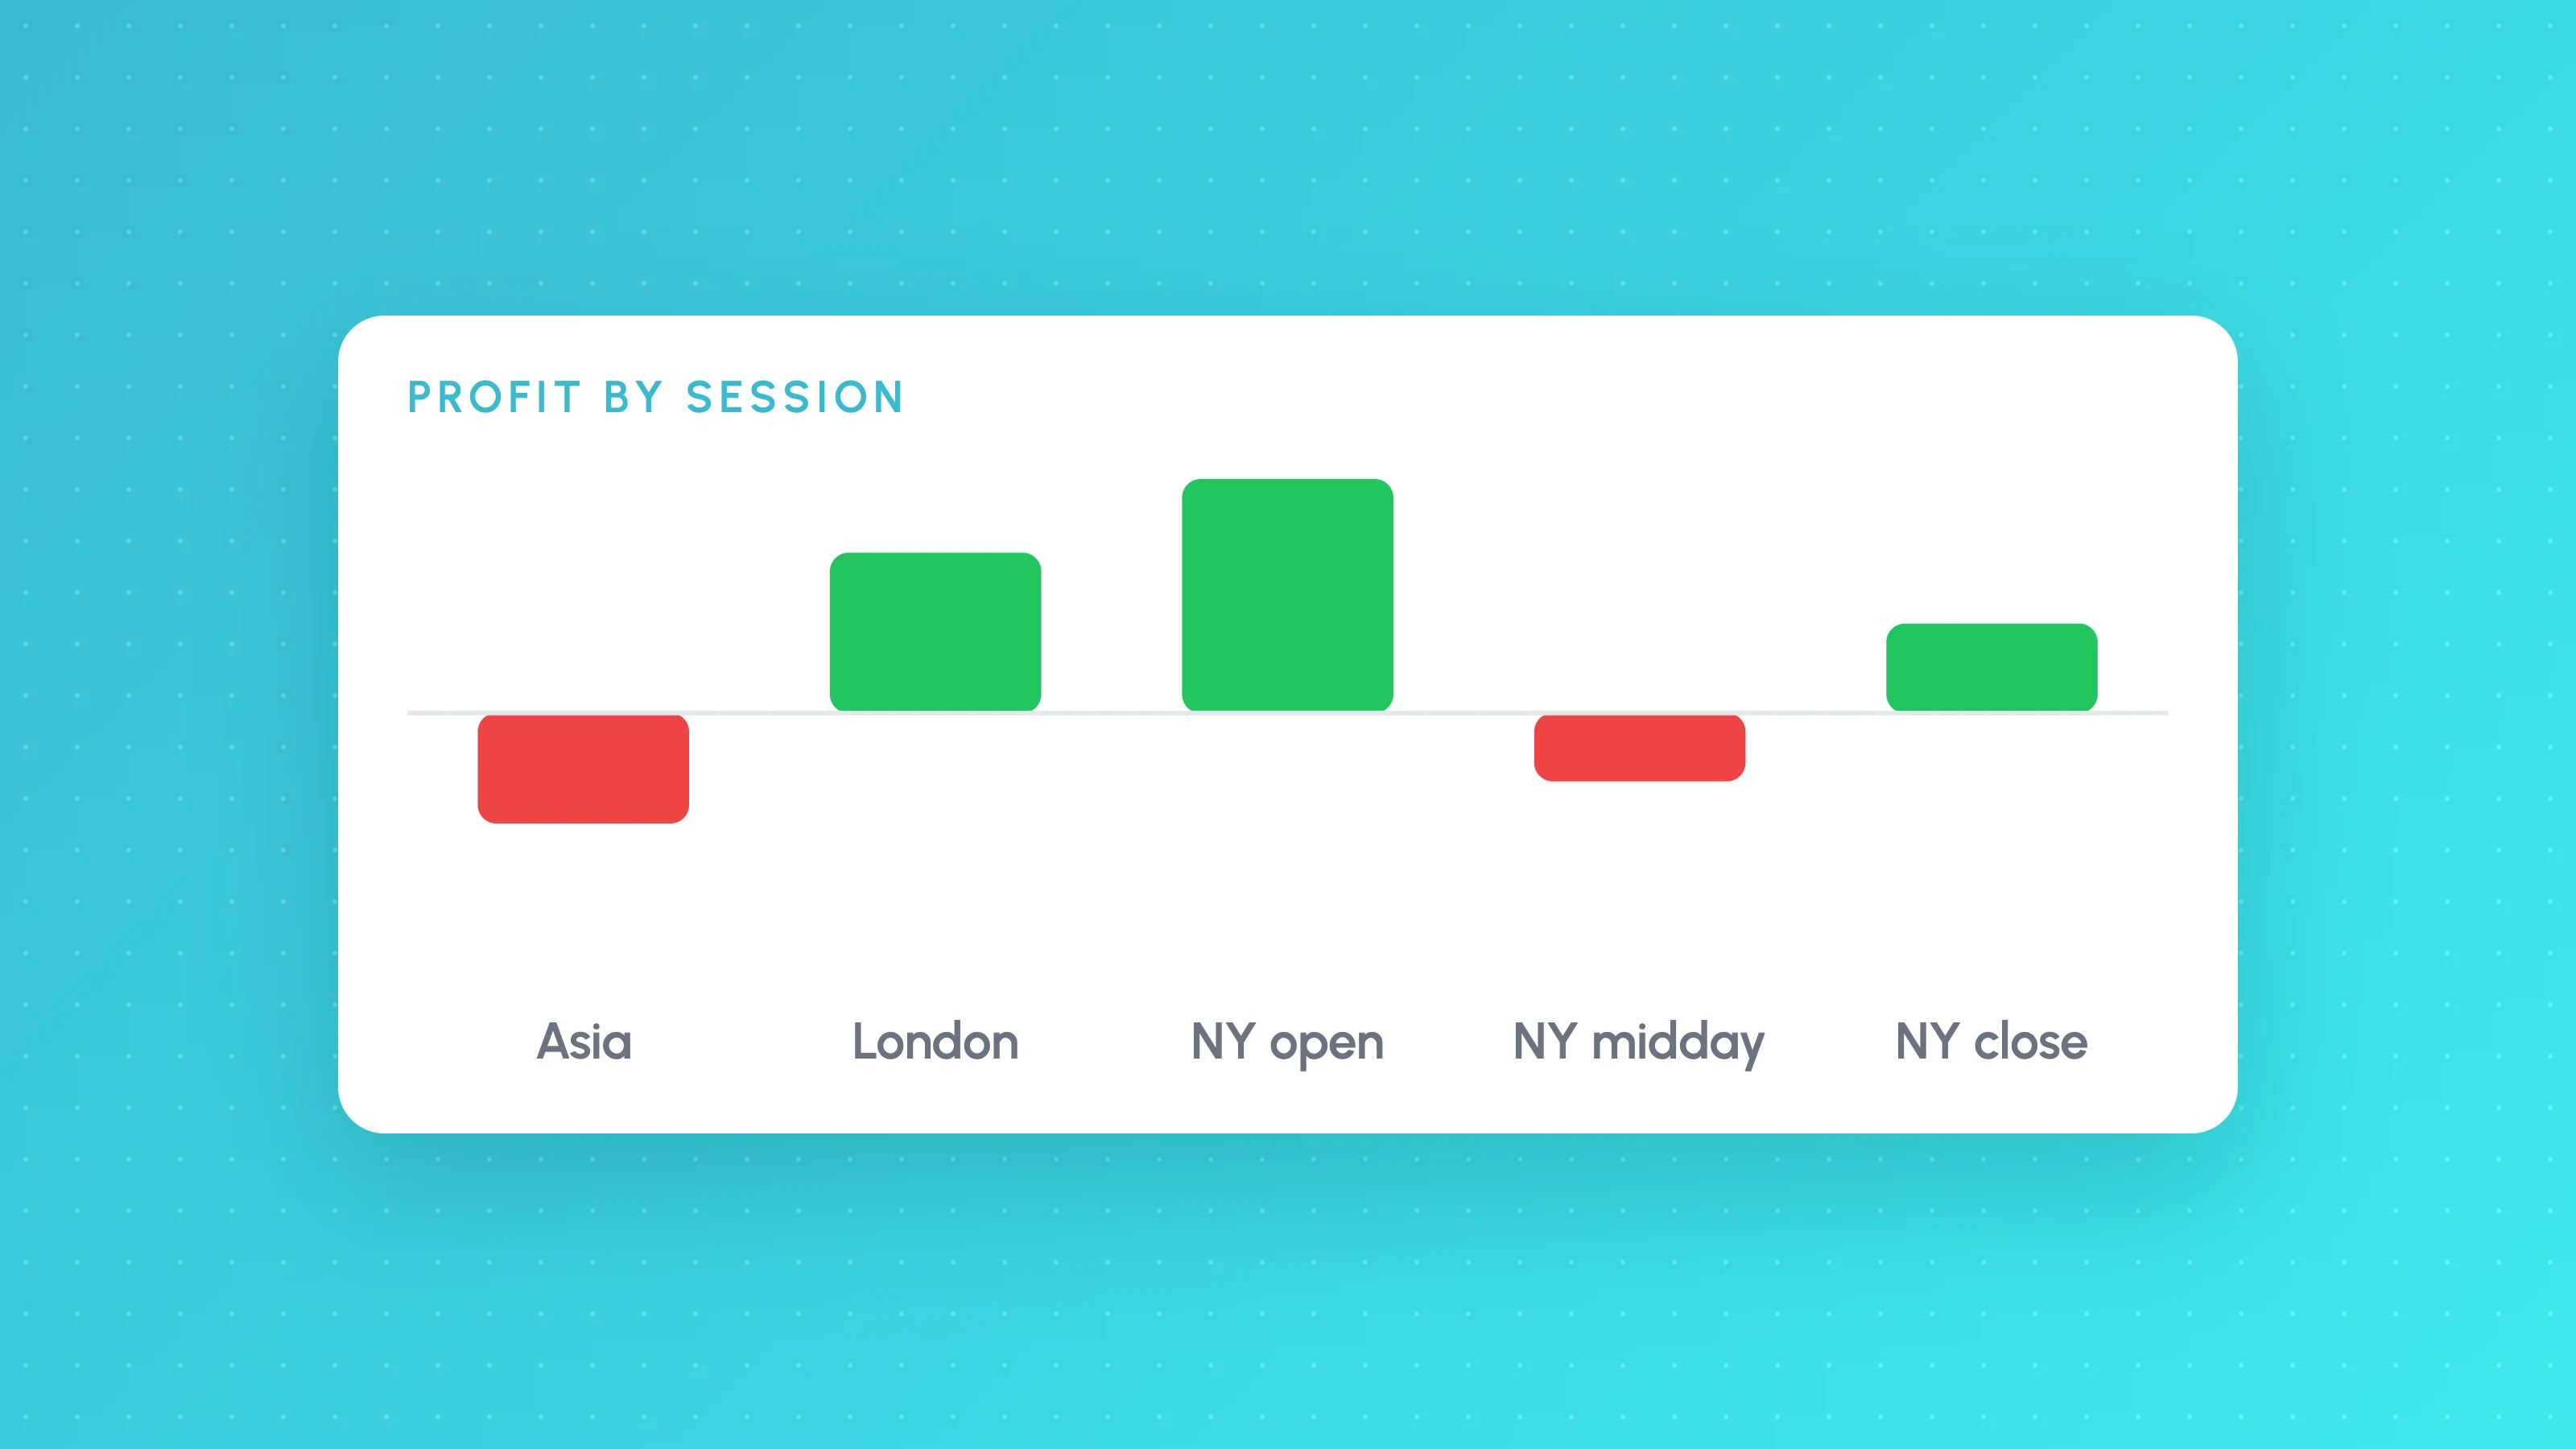
How to Analyse a TradingView Backtest by Session, Weekday and Hour
Analyse a TradingView backtest beyond the summary: split trades by session, weekday, hour, volatility and direction, check sample sizes, then test the rule.
 TradingView backtests
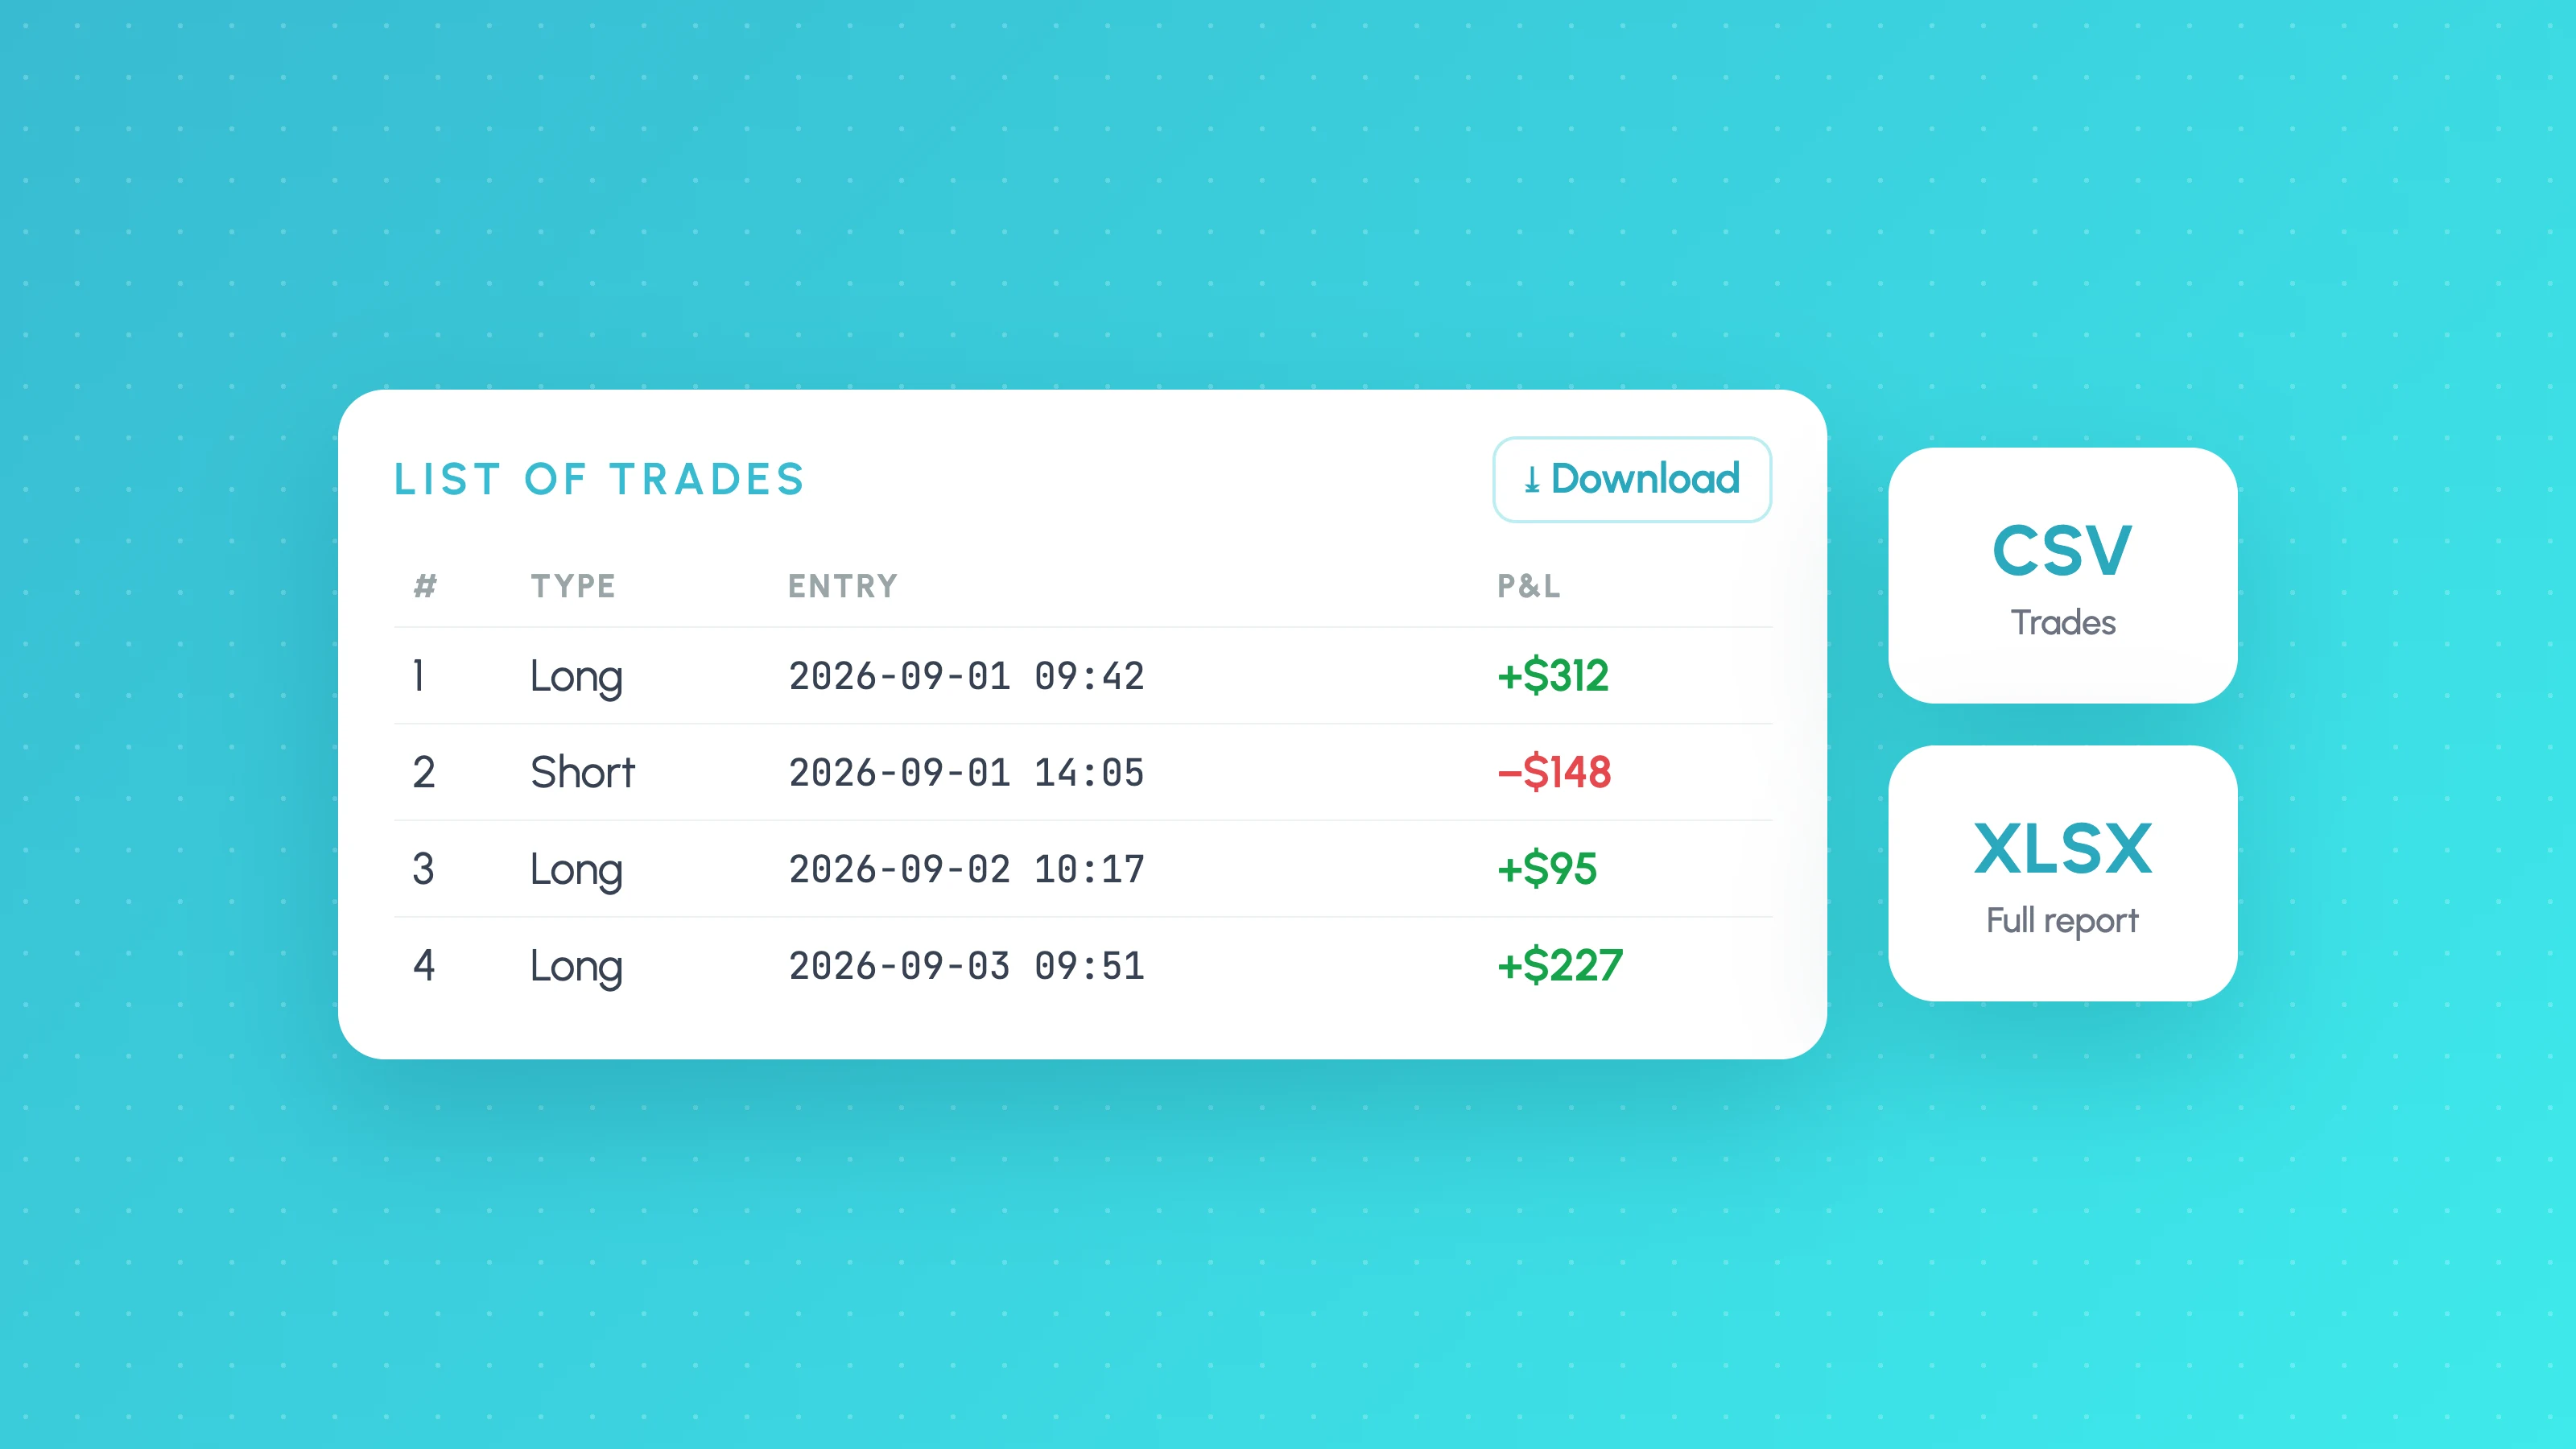
How to Export TradingView Strategy Tester Results (2026)
Export TradingView Strategy Tester results as CSV or XLSX: where the download buttons are, which plan you need, the 9,000 trade limit and what columns mean.