

Why Does My Strategy Work in Backtest but Not Live?
Why a TradingView strategy works in backtest but not live: costs, fill assumptions, repainting, gaps, data, alert delays and overfitting, with a check for each.
By Tessera Trades · Updated · 9 min read
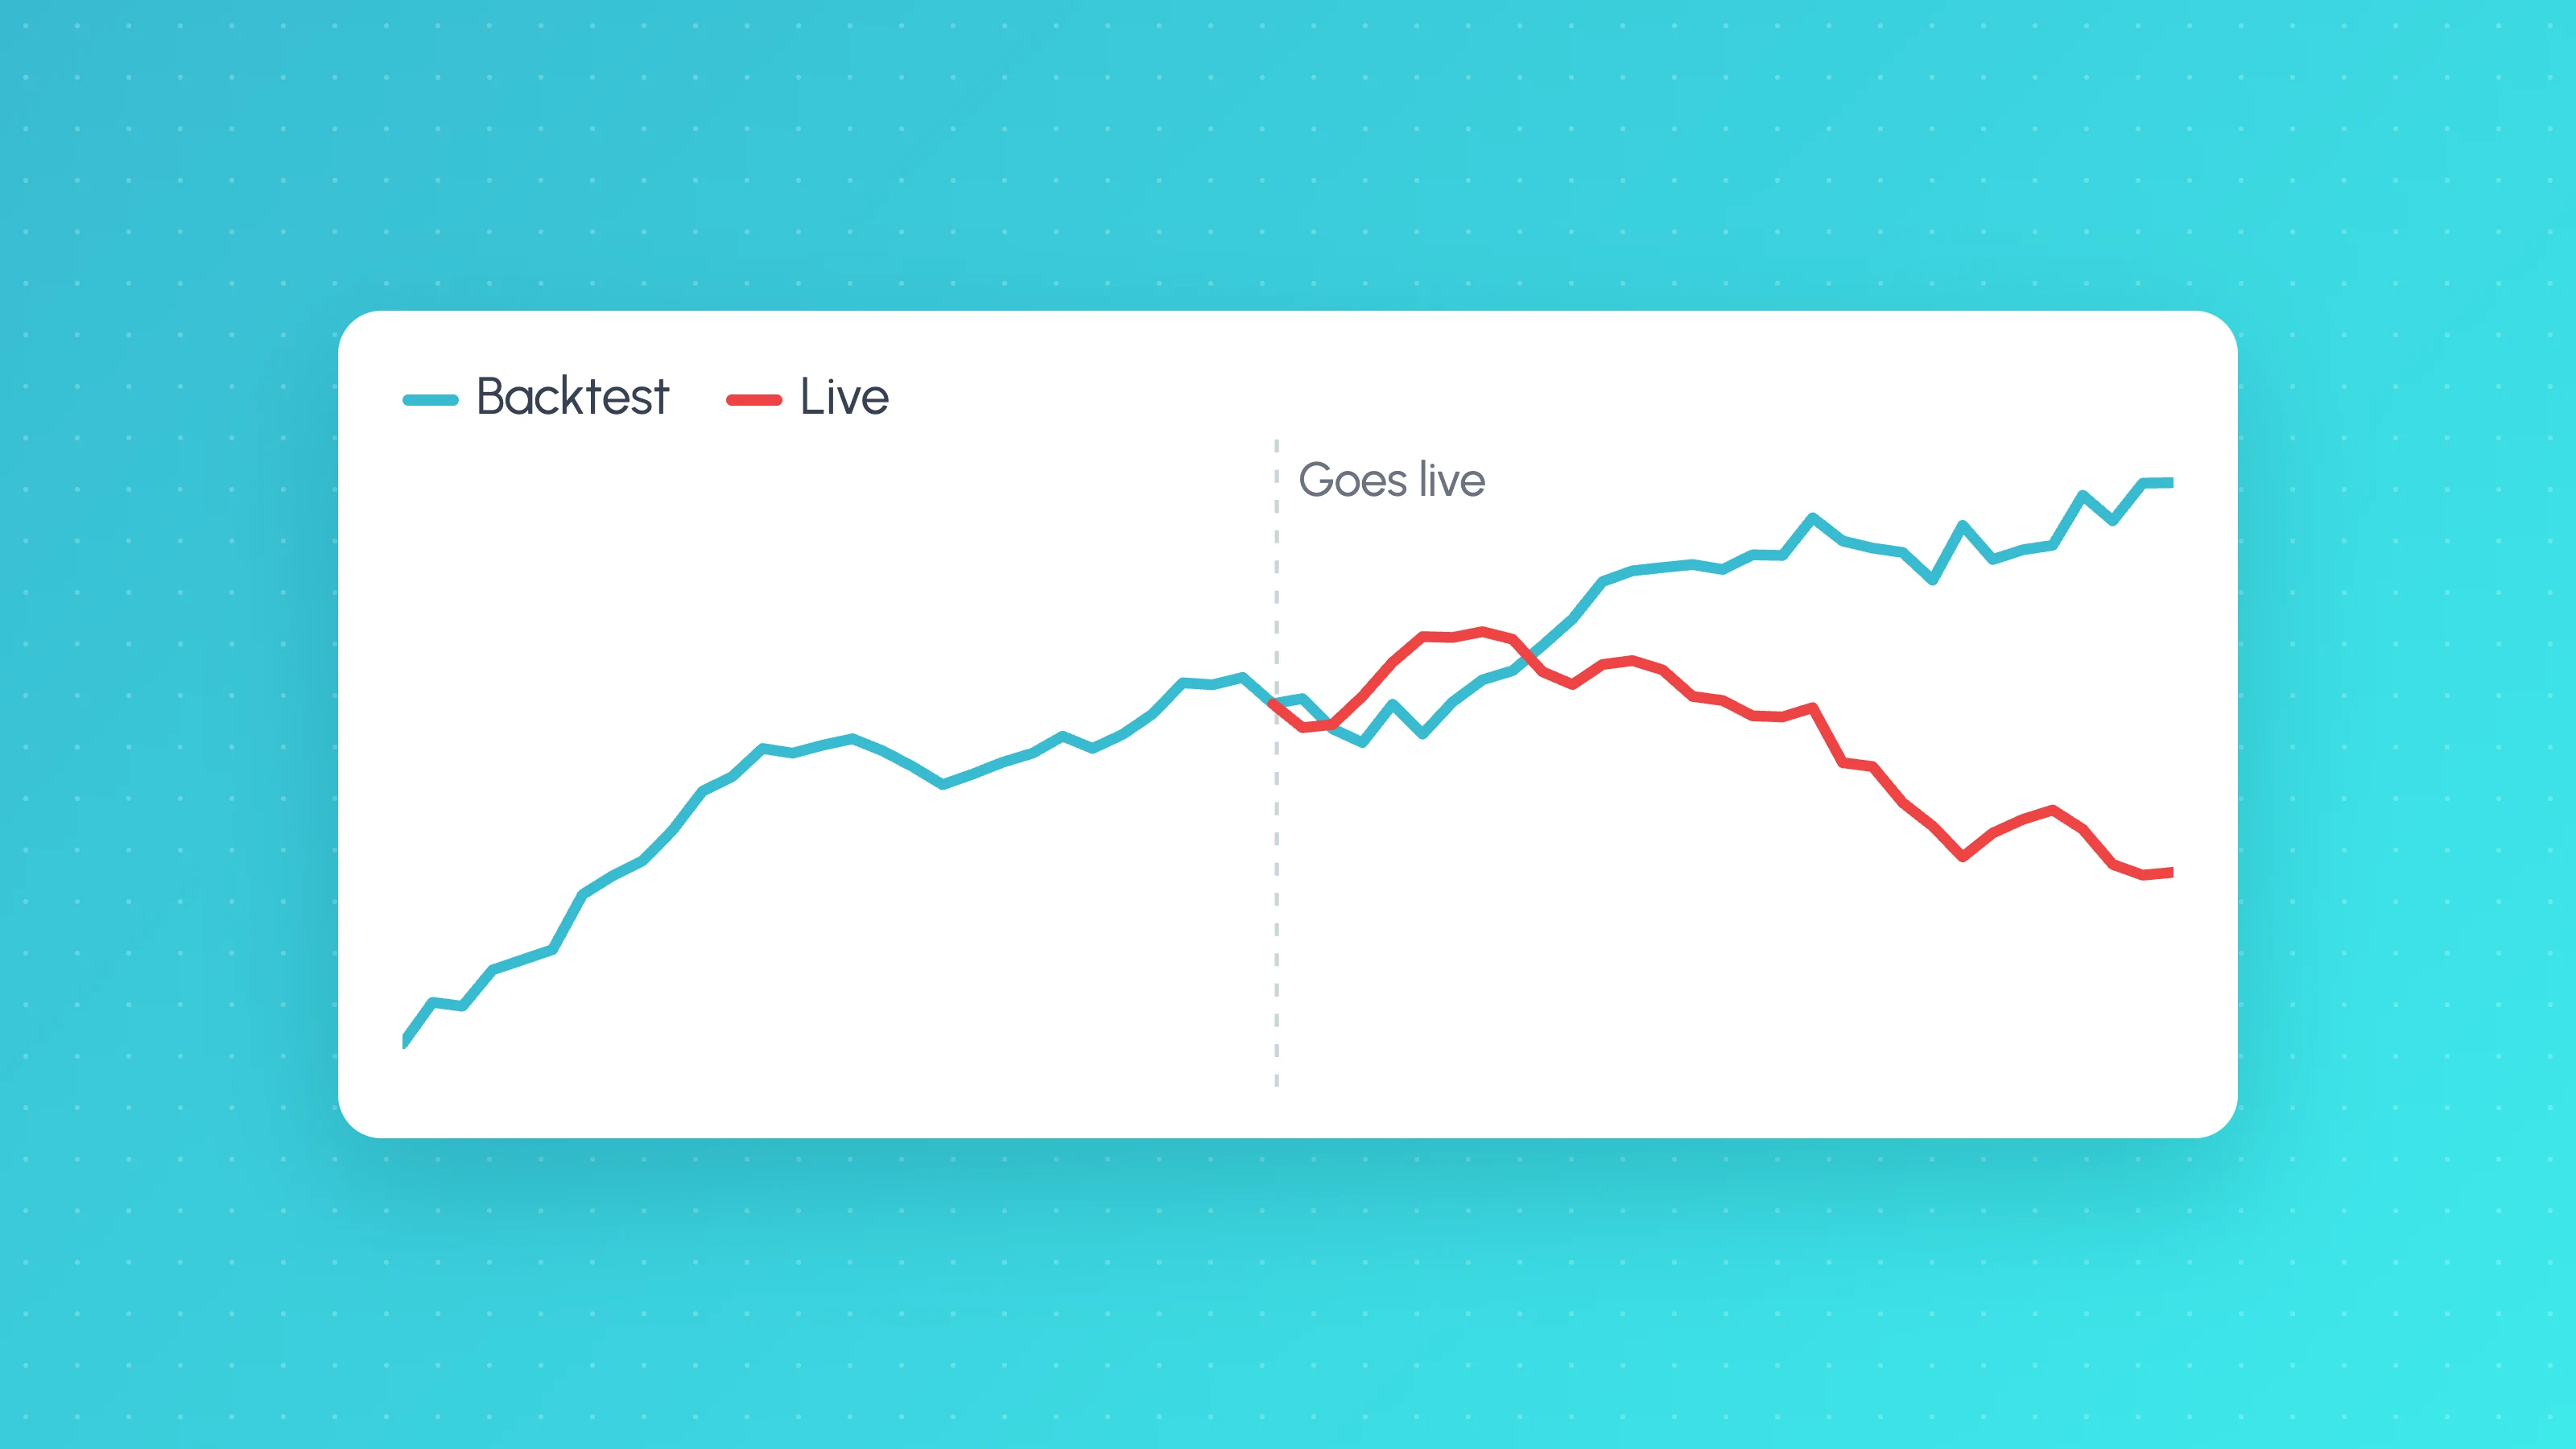
A strategy usually works in backtest but not live for one of a handful of reasons: the backtest left out real costs and slippage, it assumed fills that couldn't happen, it used information that wasn't available in real time (repainting or lookahead), it ran on different data from the market you trade, or it was overfit to the past. Most of these can be checked in an afternoon, and the fastest way to find yours is to compare live and backtest trades one by one.
This guide goes through the causes in the order worth checking them (quick, common checks first, slow ones last), gives a check for each one using TradingView settings or your trade export, then shows how to do a trade-by-trade comparison.
1. Costs and slippage weren't in the backtest
In Pine Script, slippage and commission_value both default to zero. A strategy that makes a few ticks per trade can be profitable at zero cost and lose money once you pay the spread, commission and slippage you actually get.
TradingView's strategies documentation shows the effect directly: adding 1% commission to its example strategy cut net profit significantly and increased maximum drawdown.
Check: divide your backtest's average trade by the tick value. If the average trade is only two or three ticks, costs decide everything. Set realistic values in the strategy() call or the Properties tab and re-run:
//@version=6
strategy("Realistic settings", overlay = true,
     commission_type = strategy.commission.cash_per_contract,
     commission_value = 2.5,
     slippage = 2,
     backtest_fill_limits_assumption = 1,
     use_bar_magnifier = true)
Use your broker's real commission per contract, and slippage in ticks that matches what you see on your fills. backtest_fill_limits_assumption = 1 makes limit orders need price to trade one tick through before they fill, which is closer to reality than filling on a touch.
2. The fill assumptions were too generous
On historical bars TradingView's broker emulator only knows each bar's open, high, low and close. By default it assumes price went open, high, low, close if the open was nearer the high, and open, low, high, close if the open was nearer the low, and it treats any price inside the bar as fillable. It also executes orders after a bar closes, so a market order placed on a bar's close fills on the next available tick.
Three things go wrong here:
- Stop and target inside the same bar. If both levels sit within one bar's range, the emulator has to guess which was hit first. On a 15-minute chart with tight stops, that guess can flatter many trades.
- Limit orders filling on a touch. In live markets, a limit at the exact high or low often doesn't fill.
- Entries at the signal bar's close. With
process_orders_on_close = true, orders fill on the same closing tick that created them. Live, your order arrives after that close.
Check: on Premium or Ultimate plans, set Bar detalization to High in the Properties tab (or use_bar_magnifier = true), which makes the emulator use lower-timeframe bars for fills. If results drop sharply, the original backtest depended on lucky intrabar assumptions. On any plan, export the trades and count those whose Duration is zero or one bar; those are the ones most exposed to the intrabar guess.
3. Repainting or lookahead
A strategy repaints when it behaves differently on historical bars than it did in real time. The most common causes in strategies:
request.security()withlookahead = barmerge.lookahead_onand no[1]offset, which lets each historical bar see the higher-timeframe close before it happenedcalc_on_order_fills = true, which on historical bars can use the bar's final high, low and close before they were known- testing on Heikin Ashi, Renko or other non-standard charts, which TradingView warns "do not reflect actual market conditions by default"
TradingView's repainting documentation describes leaking future information into the past as unacceptable behaviour, not a minor caveat.
Check: search the script for lookahead_on, calc_on_order_fills and varip. Then run the strategy on a live chart for a few days, note the trades it shows, reload the chart and compare. Trades that move or disappear after a reload are repainting. If you test on Heikin Ashi, set the Heikin Ashi mode input to Standard bars, or add fill_orders_on_standard_ohlc = true.
4. Stops filled at prices the market never gave you
The emulator fills a stop at your stop price whenever the bar's range covers it. If price gaps through the level between bars, it fills at the next bar's open instead, which is a fair assumption. Live, fast markets add slippage on top: a stop is a market order once triggered, and in thin or news-driven moments it can fill several ticks beyond the gap.
Check: for live trades that stopped out, compare the fill with the stop price. If the average stop slippage is much bigger than the slippage setting in your backtest, raise the setting, or exclude the times (news releases, the open, rollovers) where it happens.
5. The backtest ran on different data
A backtest on ES1! is not quite a backtest on the contract you hold. Continuous futures splice contracts together, and TradingView's back-adjustment option, which removes the price gap at each roll, is disabled by default. Unadjusted roll gaps can trigger signals that never happened in any tradable contract.
The same applies to CFDs versus futures, one crypto exchange versus another, and a broker's feed versus TradingView's default symbol. Spreads, session hours and even bar timestamps differ.
Check: run the backtest on the exact symbol and feed you trade. For futures, compare results with and without back-adjustment and look for trades clustered around roll dates.
6. Latency and alert timing
If TradingView alerts drive your execution, there's a gap between the signal and the fill. TradingView's documentation notes that strategies run alert() calls only on the close of realtime bars by default, while alerts from order fill events trigger immediately. Each step after that (webhook, bridge, broker) adds time.
Check: log the alert timestamp and the broker's fill timestamp for each live trade. If the median delay is several seconds on a fast intraday strategy, that delay is part of your slippage and belongs in the backtest settings.
7. Overfitting
If the strategy was tuned until the equity curve looked good, the backtest describes the past it was fitted to, not the market. A large study of 888 algorithms on the Quantopian platform found that the backtest Sharpe ratio had almost no power to predict out-of-sample performance (R² below 0.025), and that the more backtesting a strategy received, the bigger the gap between backtest and out-of-sample results (Wiecki et al., "All that glitters is not gold").
Check: sensitivity of the parameters, ablation of filters, and an out-of-sample period. Is my backtest overfit? has the full checklist.
8. The market changed, or it's just early
Strategies that rely on a volatility level, a trend or a session pattern can stop working when that condition changes. And a few weeks of live trading is a small sample: 20 live trades can easily underperform a sound strategy by chance.
Check: break the backtest down by volatility regime and year (see how to analyse a TradingView backtest). If the strategy also lost in past high-volatility stretches and the market is in one now, that's regime, not a broken strategy. For sample size, compare live results against the range of results the backtest produced over periods with the same number of trades; backtest sample size shows how wide that range is.
How to compare live and backtest results trade by trade
Comparing totals tells you there's a gap. Comparing trades tells you where it comes from.
- Run the strategy over exactly the live period, with the same symbol, timeframe and settings, and export the List of Trades.
- Export your live fills from the broker or platform for the same period.
- Match trades on entry time, allowing a window of one bar.
- Label each pair: matched, missed (in the backtest, not live) or extra (live, not in the backtest).
- For matched trades, record entry slippage and exit slippage in ticks, signed so that bad slippage is negative, and the difference in result.
- Add up the gap by cause.
An illustrative example: over three months a backtest made $2,400 and the live account made $900. Breaking down the $1,500 gap:
| Cause | Cost |
|---|---|
| Commission not in the backtest | $420 |
| Entry slippage on matched trades | $380 |
| Exit slippage on matched trades (mostly stops) | $260 |
| Three backtest trades missed live (alert failures) | $440 |
| Total gap | $1,500 |
Here the strategy isn't broken. Costs explain about half the gap, and a reliability problem explains the missed trades. The fix is to put realistic costs in the backtest and repair the alert pipeline, not to redesign the entry.
If a large share of trades are "missed" or "extra", look at repainting and data differences first. If matched trades show consistent bad slippage, look at costs and fills.
How much worse than the backtest is normal?
There's no reliable published figure for how much live results "should" lag a backtest, and numbers quoted online are usually guesses. It depends on the strategy's trade frequency, average trade size relative to costs, and how much tuning went into it. As a matter of judgement:
- Live results somewhat below a backtest that already included realistic costs are expected; the backtest was the best version of the strategy chosen from several.
- A gap that disappears once you add real costs to the backtest isn't degradation. The original backtest was wrong.
- A gap that keeps growing as more live trades come in, after costs, is a warning sign of overfitting or a changed market.
It helps to set the range before the first live trade. If you build the strategy in Tessera's Strategy Lab and run it with Launchpad, the monitoring view draws an expectation curve from the backtest with a 95% band around it, and gives a verdict of within, above or below as live trades come in. A result inside the band is consistent with the backtest; a run below it is the point to pause and investigate. Launchpad can also run a paper version next to the live one, which helps show whether a gap comes from execution or from the strategy.
Where Tessera fits
Tessera imports both sides of the comparison: the TradingView Strategy Tester export, and live history from MetaTrader, NinjaTrader, Tradovate and Hyperliquid by file, or by live sync from Interactive Brokers, OANDA, cTrader and Binance. Seeing both broken down by session, weekday and volatility makes it clear which conditions the gap comes from. Rules you test can then be written into a copy of your Pine Script and re-backtested, which is what the strategies page covers.
Check your backtest first
Upload a Strategy Tester export to the free Entry Analysis report and see where its results come from before you trade it live. No card needed.
Frequently asked questions
- Is the TradingView Strategy Tester accurate?
- It's an accurate simulation of the assumptions you give it, and those assumptions default to optimistic: zero commission, zero slippage, and fills estimated from each bar's open, high, low and close. With realistic costs, high bar detalization on Premium or Ultimate, and no repainting code, it gets much closer to live results.
- Why are my live trades different from the backtest trades?
- The usual causes are repainting or lookahead in the script, signals generated at a bar's close that can't fill until later, alert or execution delays, and differences between the data you backtest on and the market you trade. Match live and backtest trades by entry time to see which trades are missing, extra or filled differently.
- Does Bar Magnifier make backtests match live trading?
- It helps with one problem: guessing the order of prices inside a bar. With Bar detalization set to High, TradingView fills orders using lower-timeframe bars. It doesn't add costs, fix repainting or model latency, so it's one setting among several.
- How long should I forward test before going live?
- Long enough to collect a meaningful number of trades, not a fixed number of weeks. A strategy that trades five times a day gets there in weeks; one that trades weekly needs much longer. Compare live results with the spread of backtest results over the same number of trades. How long to paper trade a strategy works through the trade counts.
- My strategy worked live at first and then stopped. Why?
- Either the early results were luck, or the market changed. Check whether the backtest also had long losing stretches in similar conditions, and whether the recent losses cluster in one session, weekday or volatility level. A strategy that lost in the same conditions in the past is behaving as expected.
Keep reading
 TradingView backtests
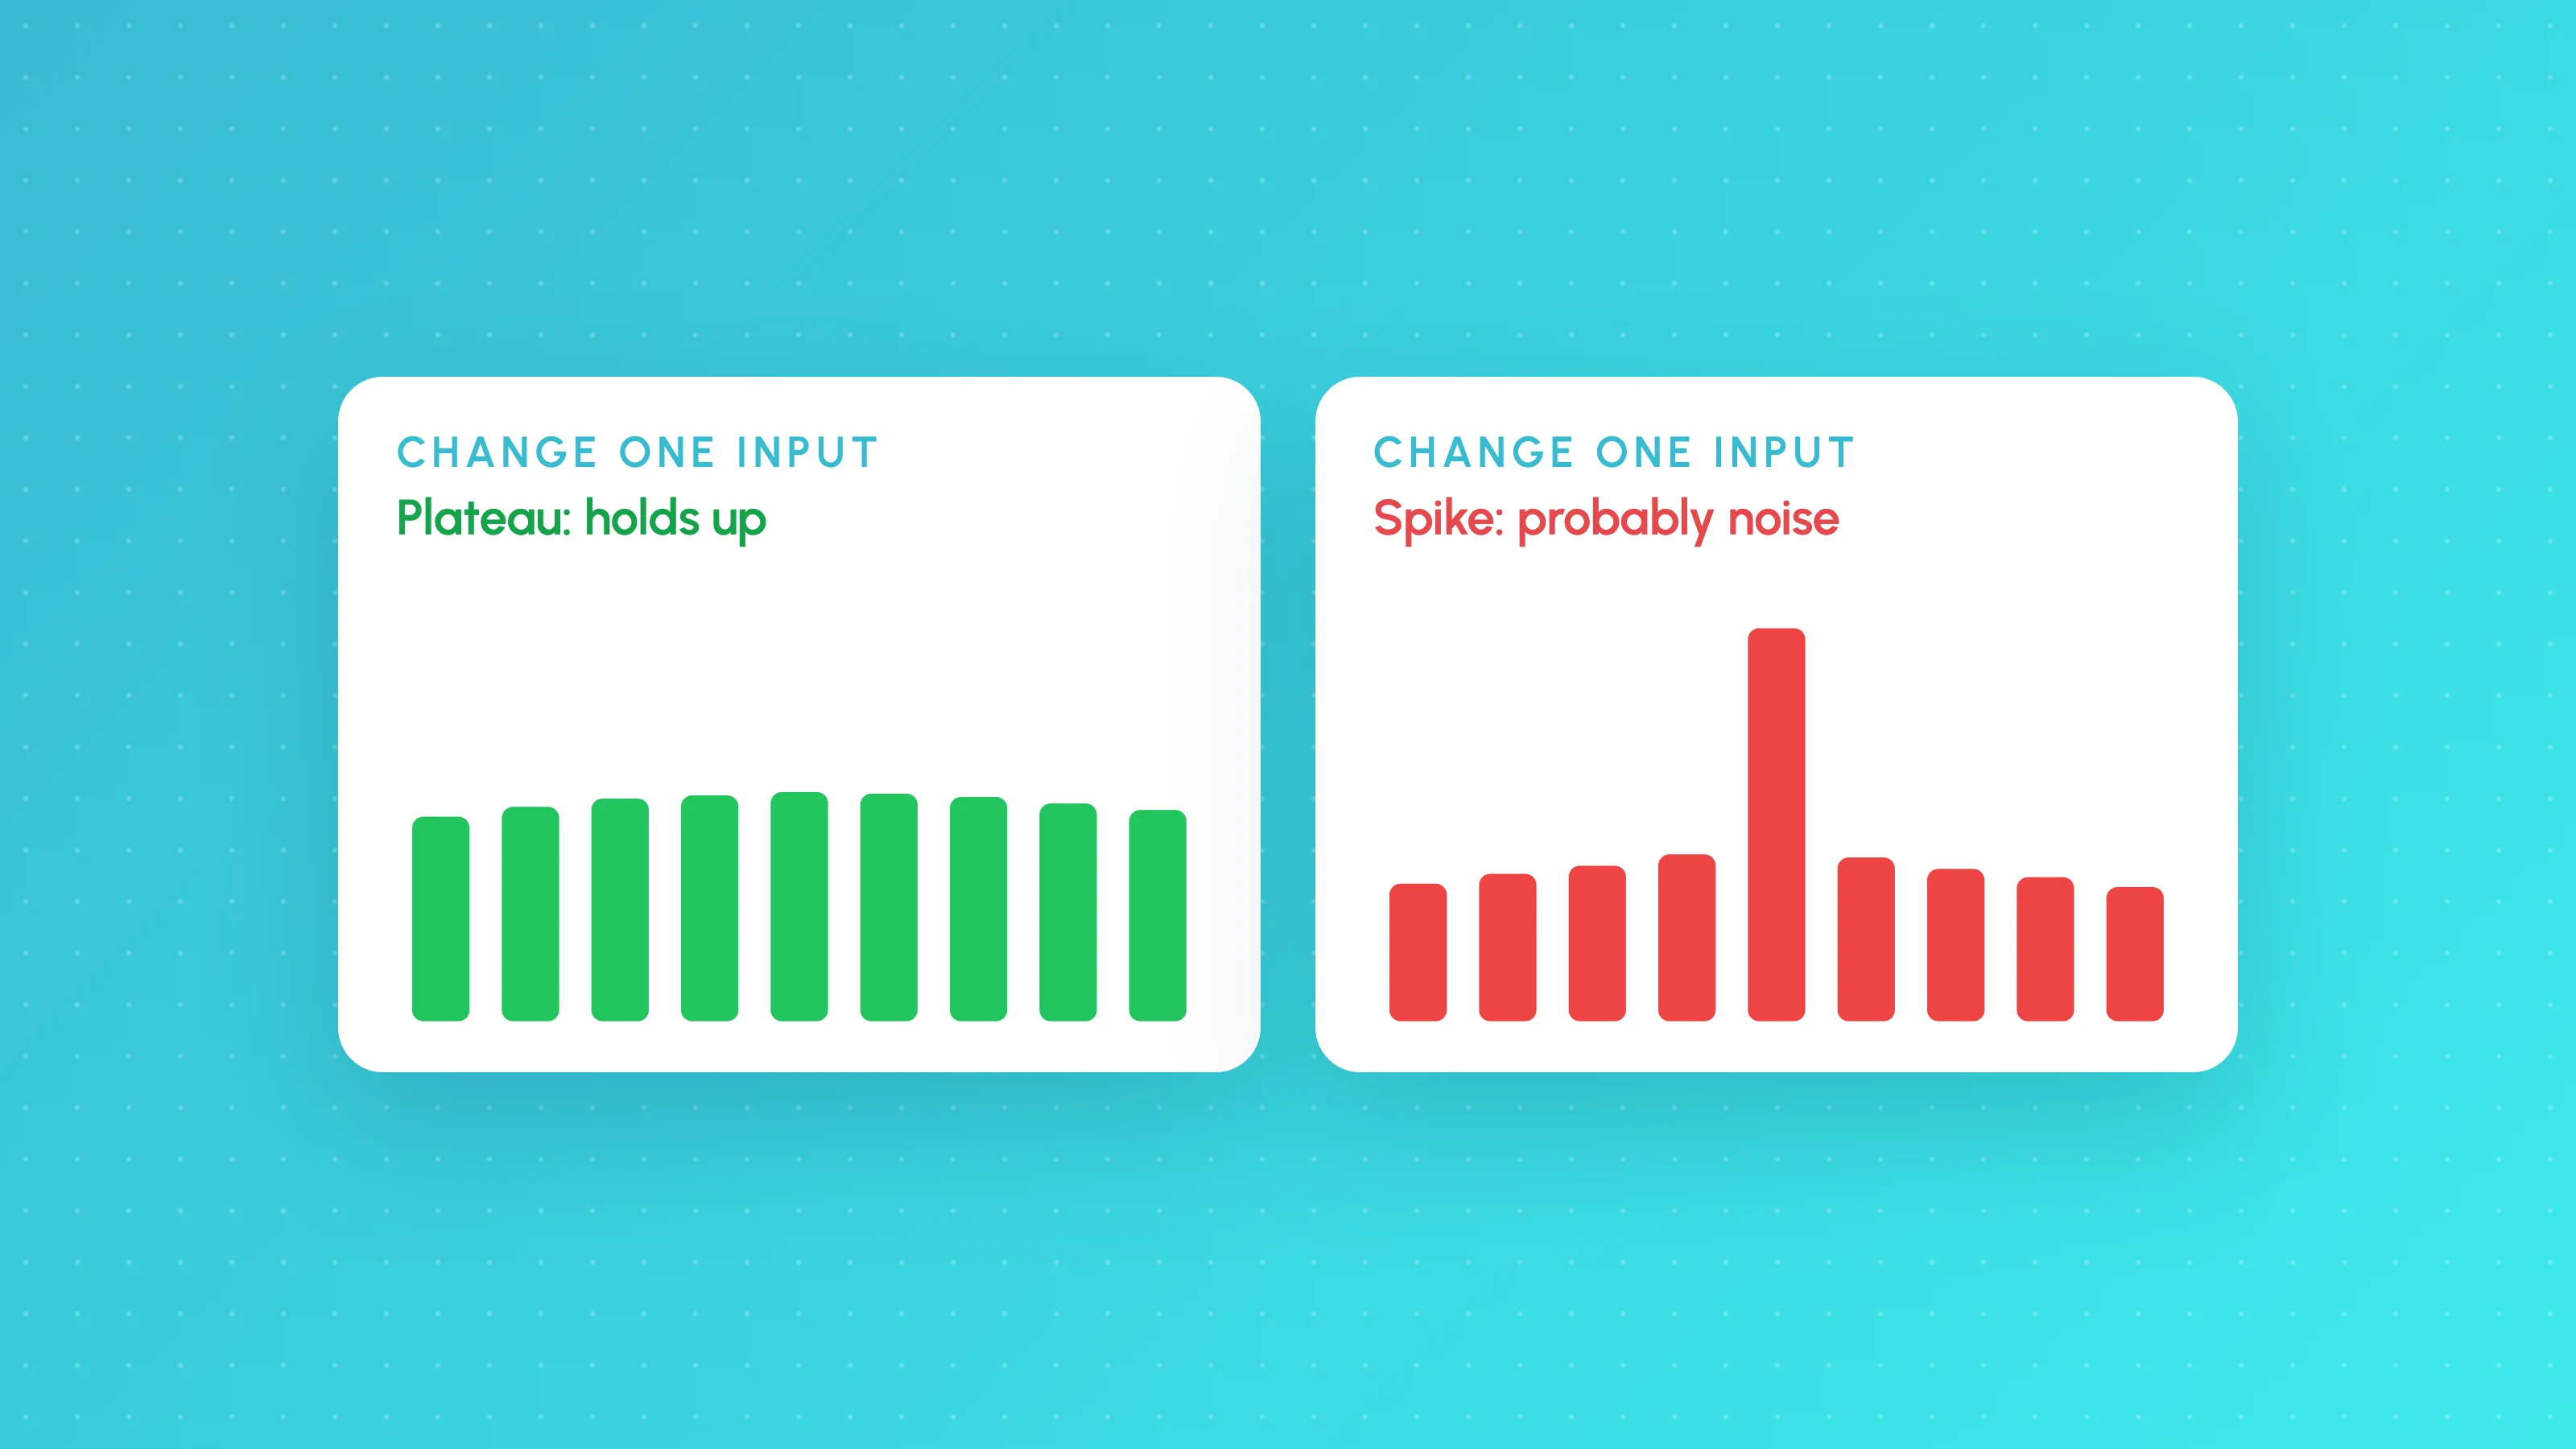
Is My Backtest Overfit? A Practical Checklist for Traders
How to tell if a backtest is overfit: too-good metrics, thin samples, fragile inputs, useless filters, out-of-sample and walk-forward tests, plus a checklist.
 TradingView backtests
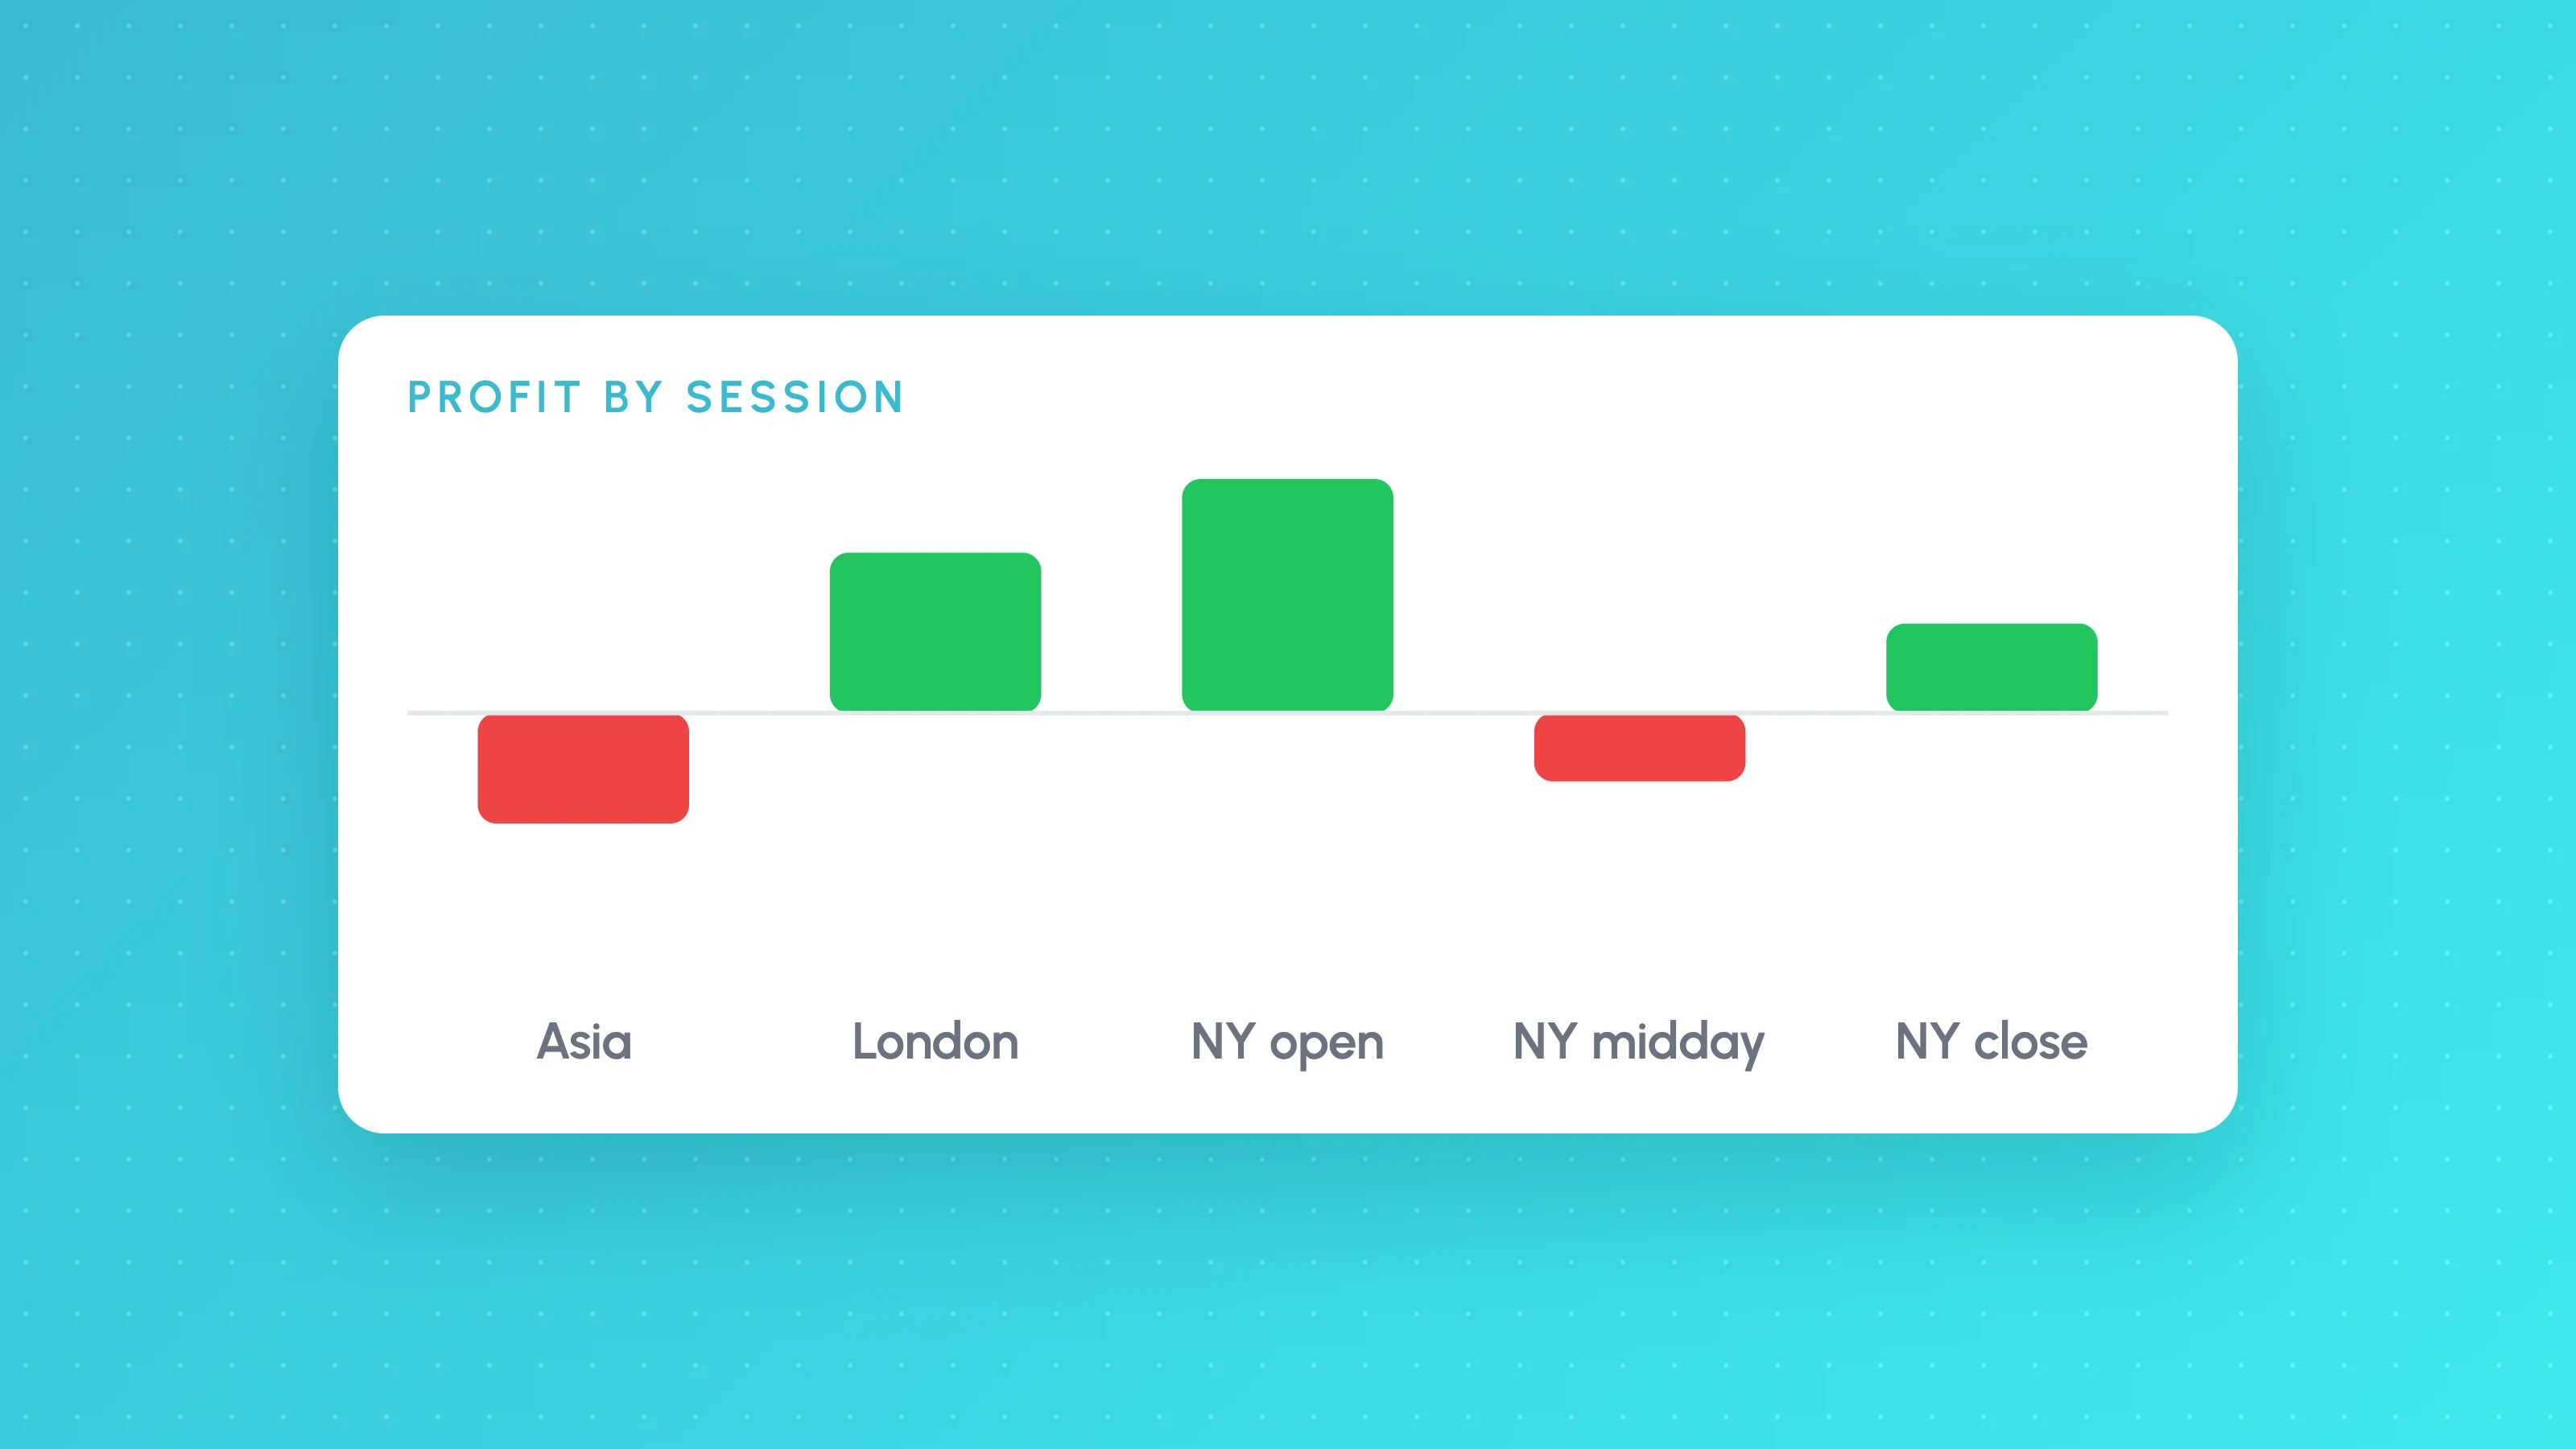
How to Analyse a TradingView Backtest by Session, Weekday and Hour
Analyse a TradingView backtest beyond the summary: split trades by session, weekday, hour, volatility and direction, check sample sizes, then test the rule.
 TradingView backtests
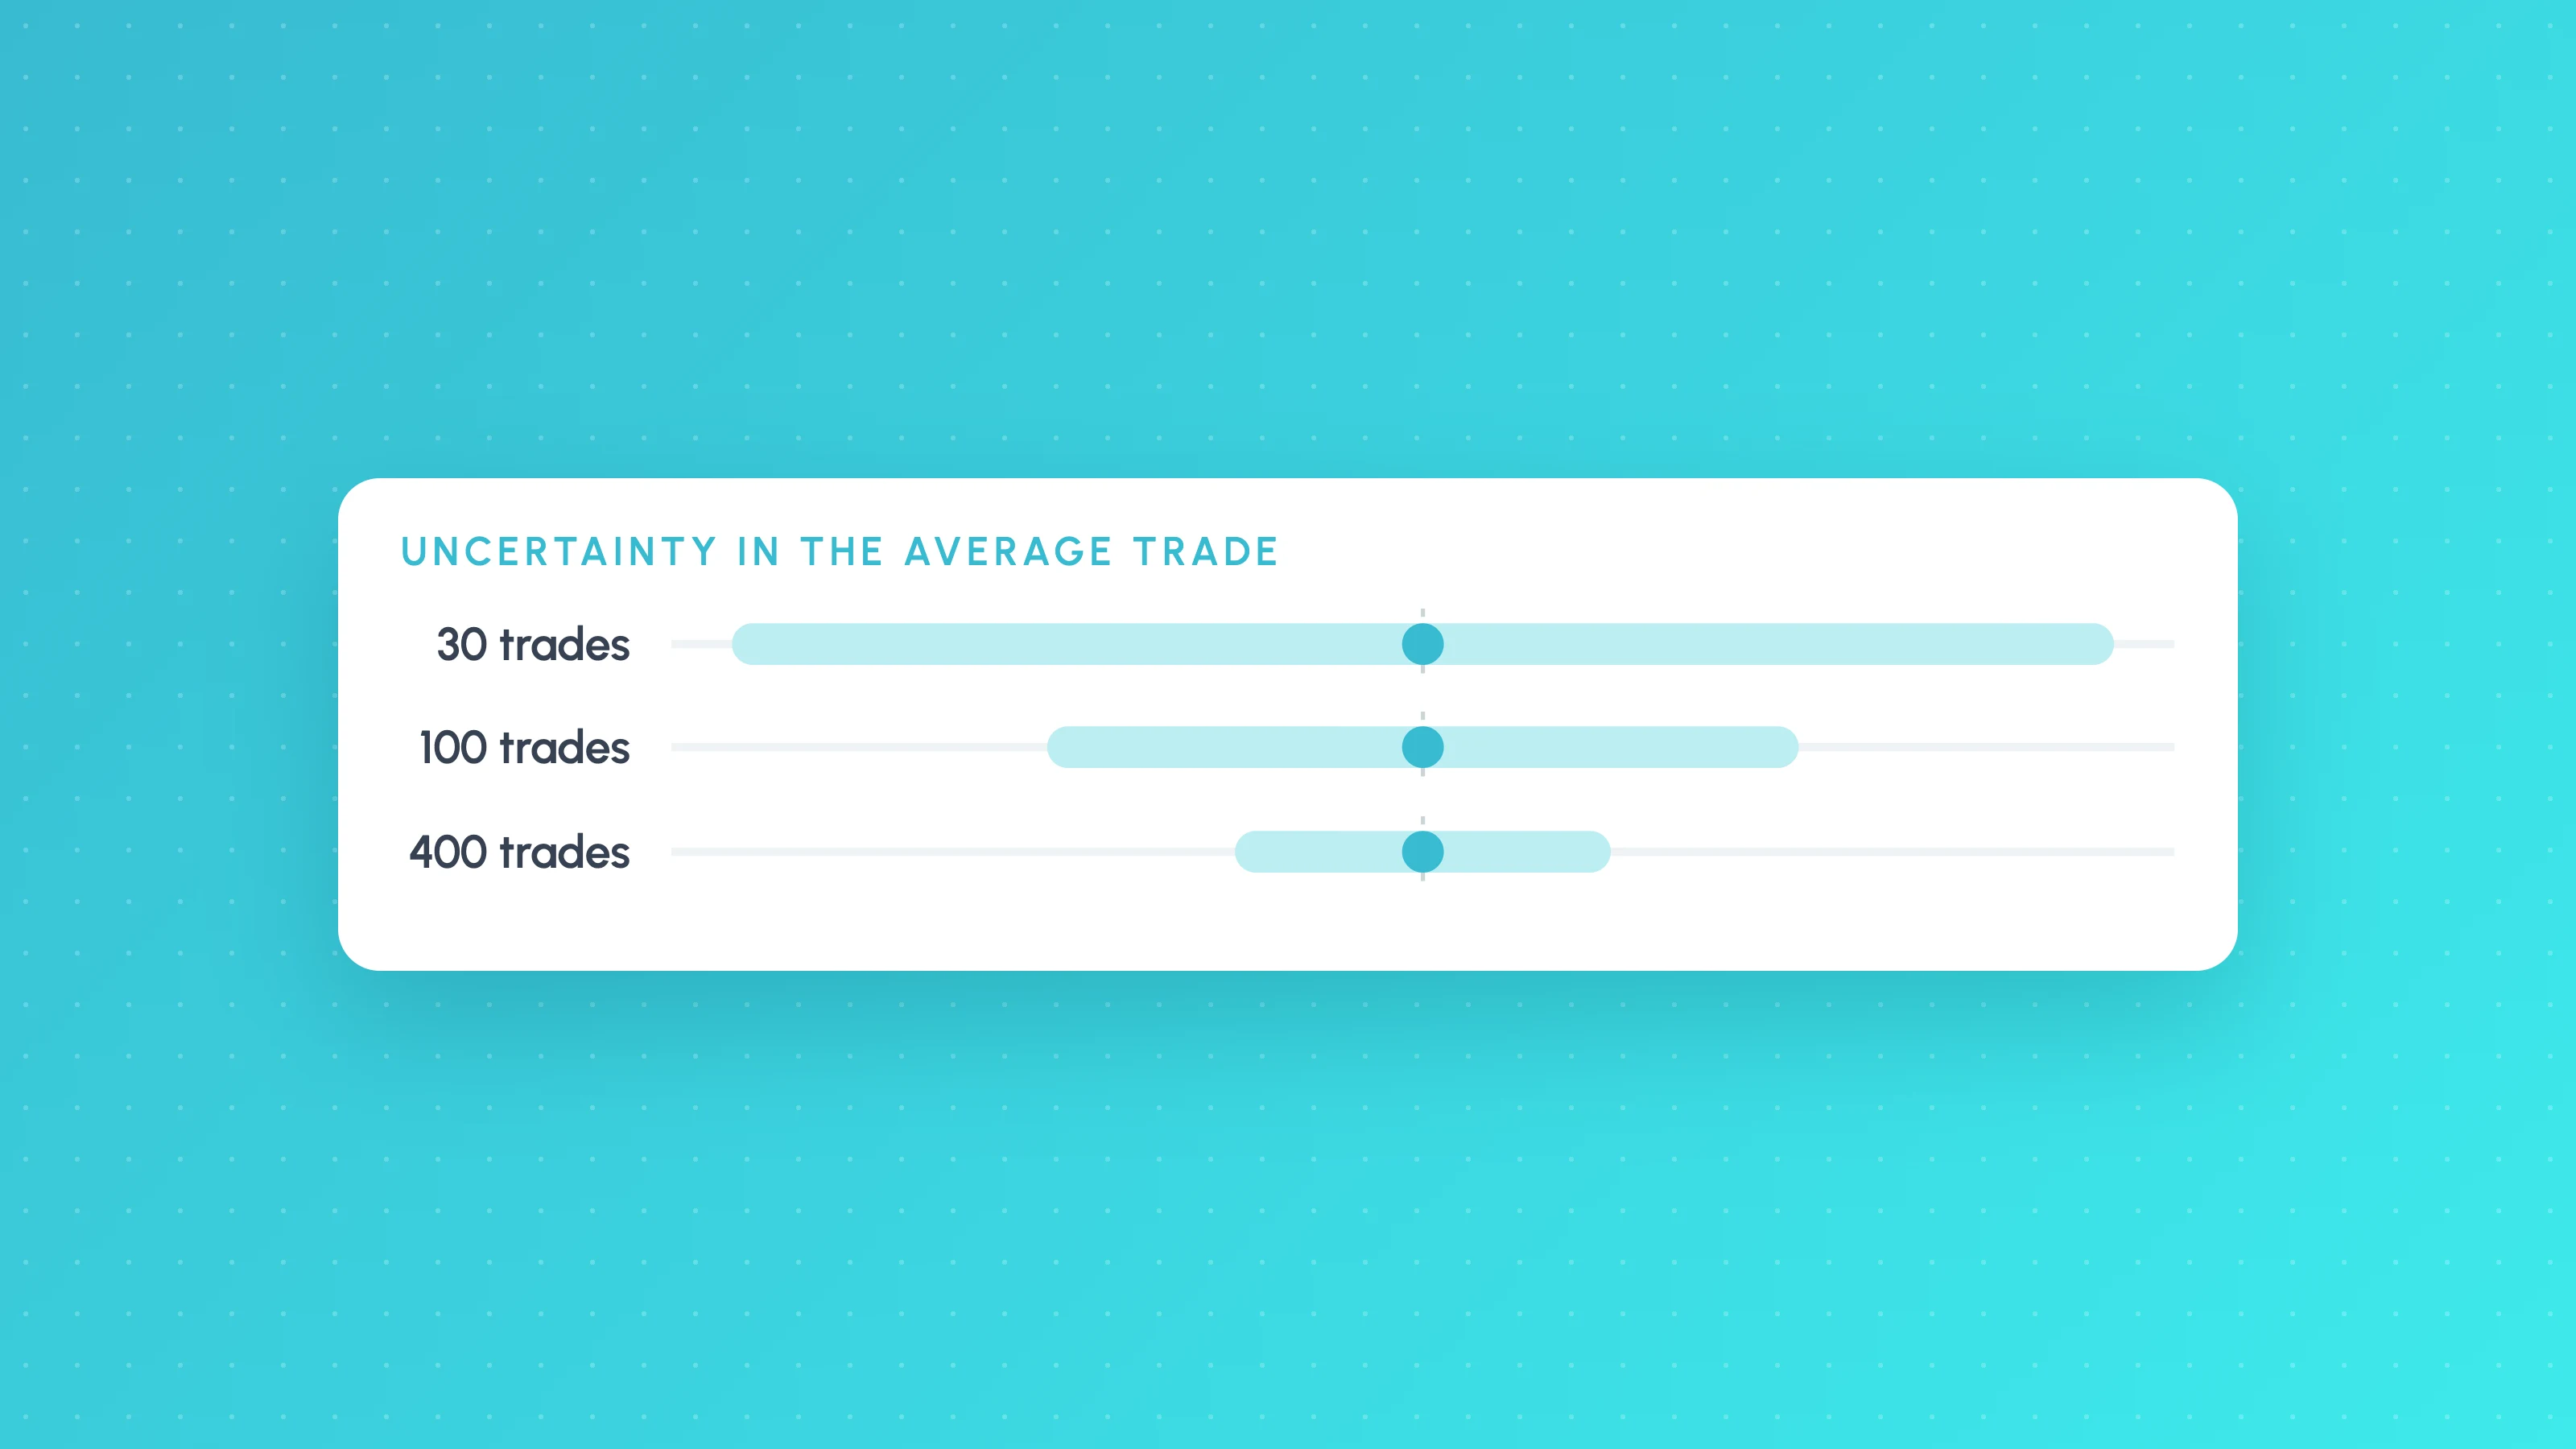
How Many Trades Do You Need for a Valid Backtest?
How many trades a backtest needs: rules of thumb, the t-statistic formula with a worked example, a table by edge size, per-bucket minimums and multiple testing.