

How Long Should You Paper Trade an Algo Before Going Live?
How long should you paper trade before going live? Count trades, not weeks: compare results with the backtest's expected band, then go demo, then small live.
By Tessera Trades · Updated · 8 min read
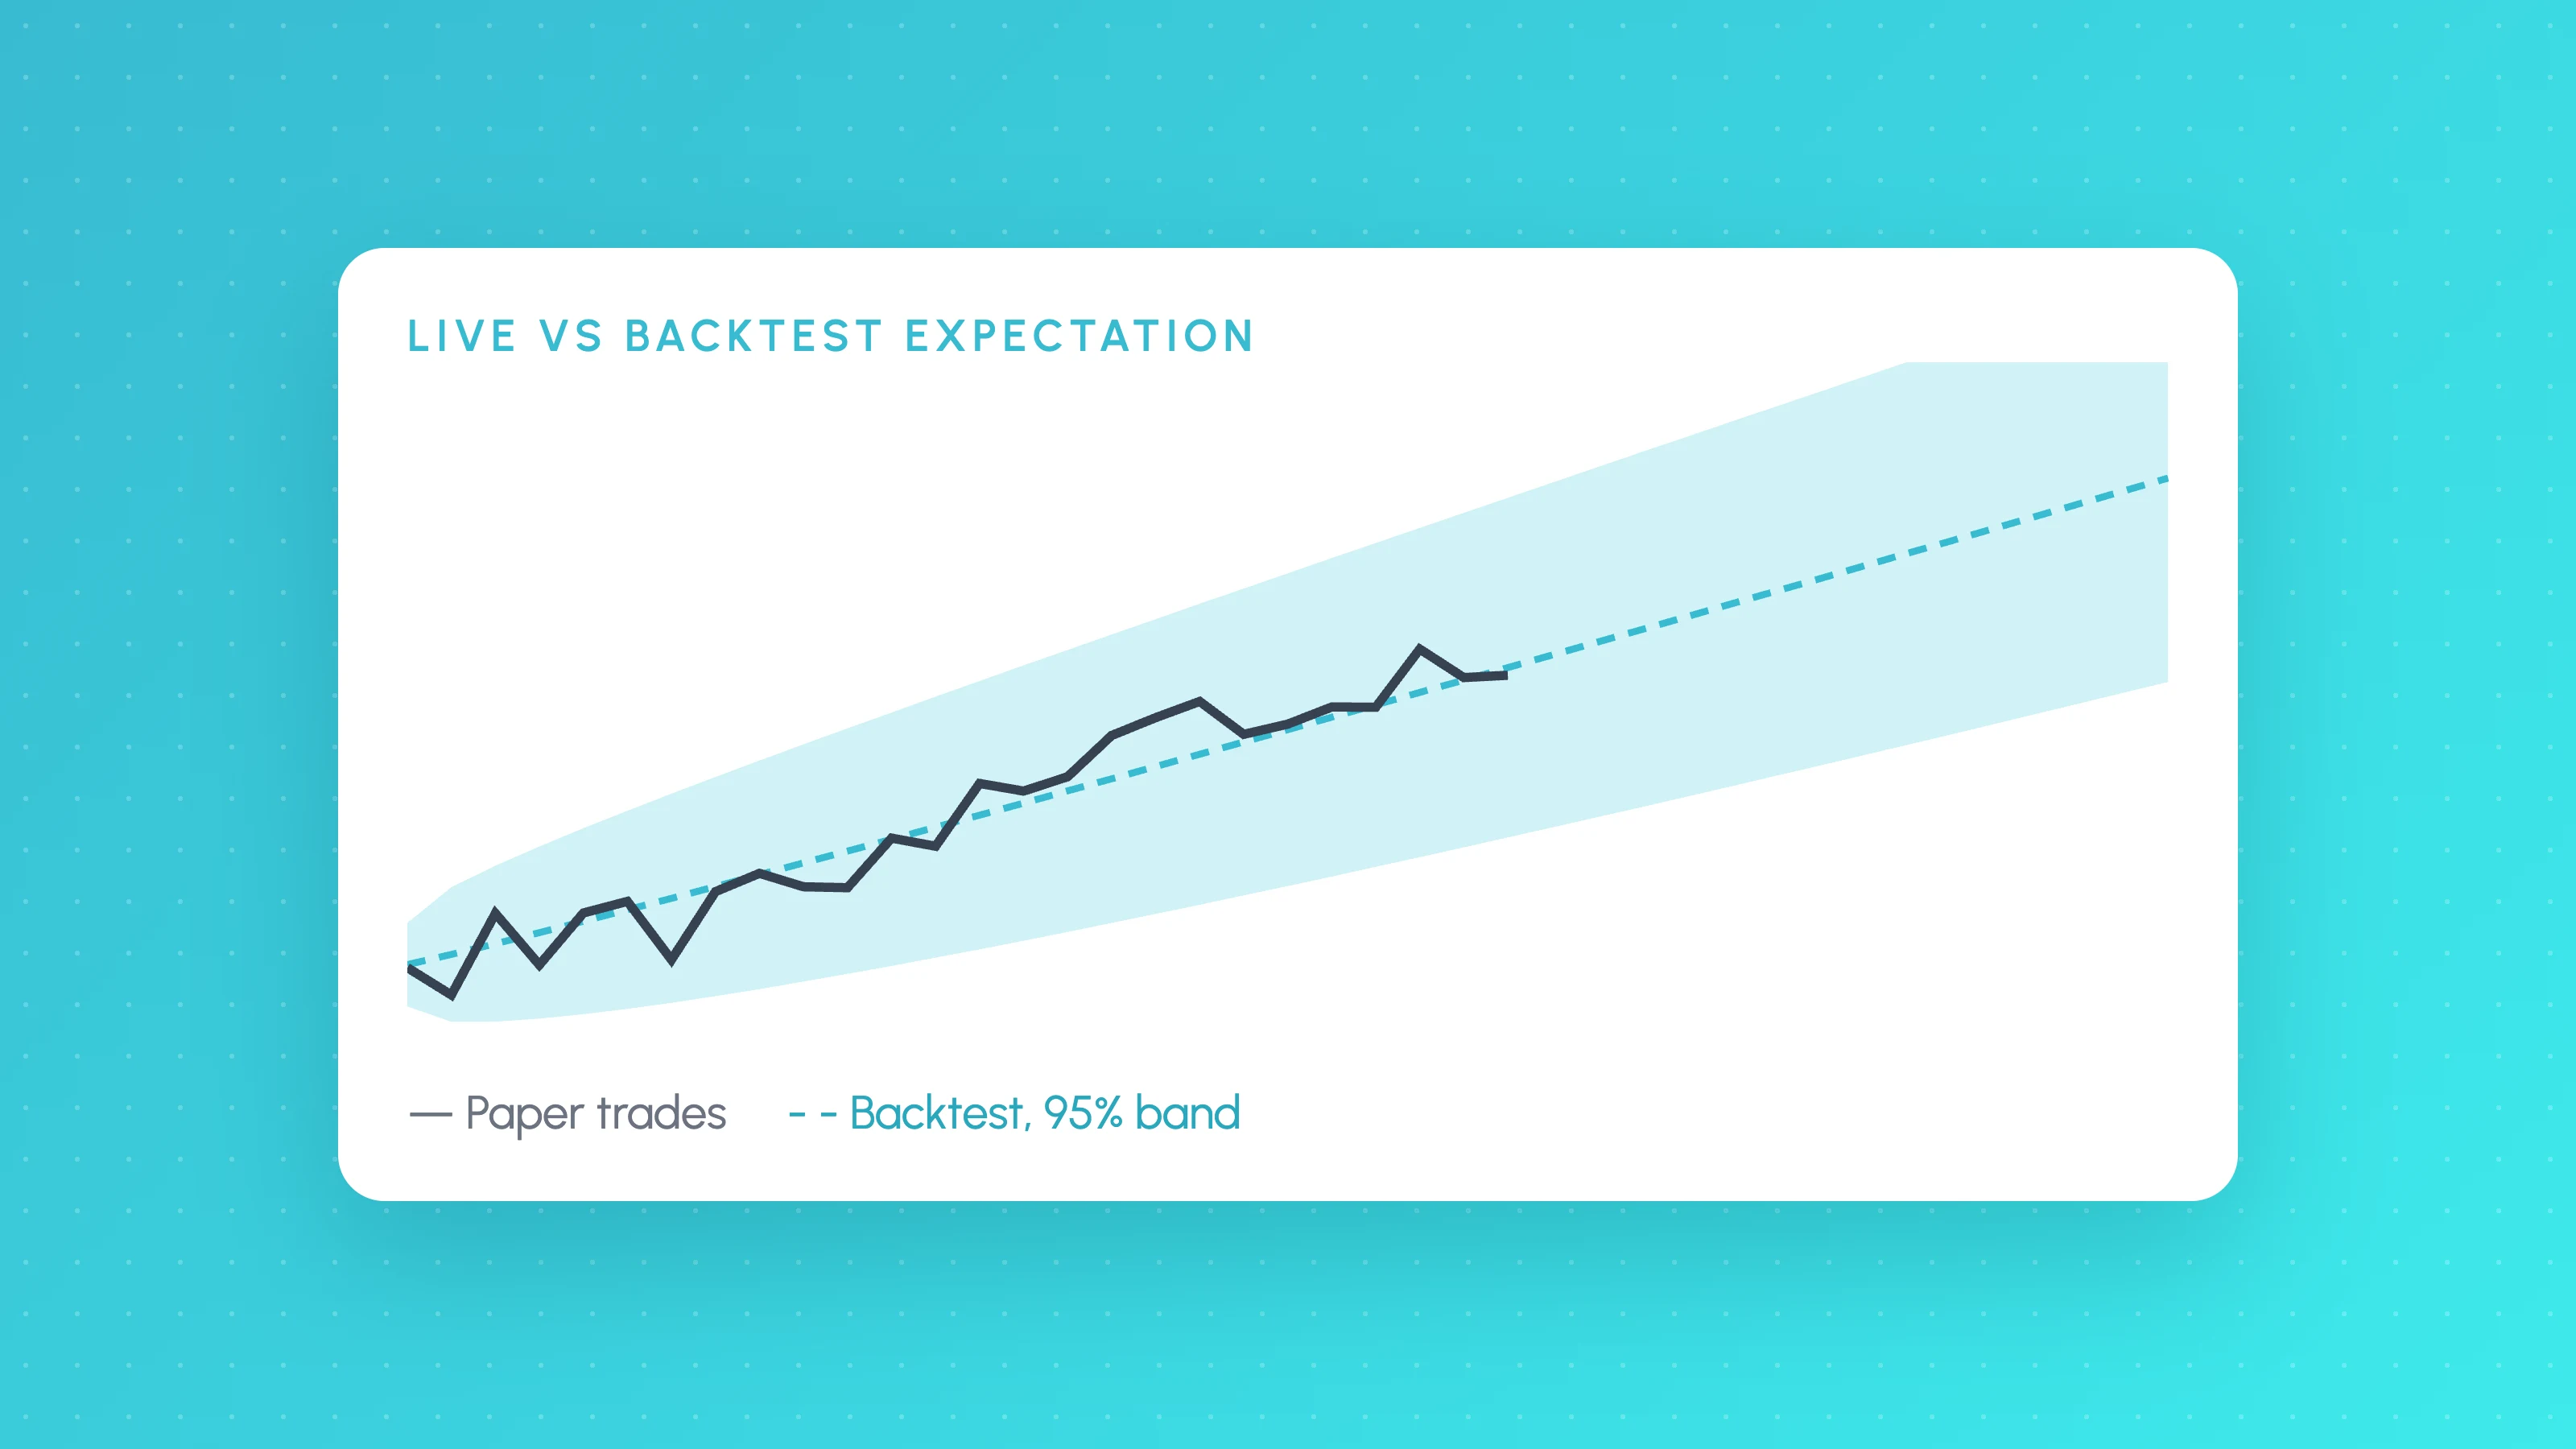
Paper trade an algo until it has taken at least 30 trades and covered every session and weekday it trades, then compare those trades with the backtest's own trades for the same period and with its expected range. The answer is a number of trades, not weeks: a strategy that trades twice a day gets there in three weeks, one that trades twice a week takes about four months. Paper trading can't prove the edge in that time. Its job is to show the bot behaves exactly like the backtest, so you can move on to a demo account and then small live size.
Most advice says "paper trade for a month" or "three months". Neither means anything without the trade count. This guide covers how many trades each stage needs, how to compare live results with the backtest's expectation band, and the step-by-step path from paper to full size.
Count trades, not weeks
| Trades per week | Weeks to 30 trades | Weeks to 50 trades | Weeks to 100 trades |
|---|---|---|---|
| 10 | 3 | 5 | 10 |
| 5 | 6 | 10 | 20 |
| 2 | 15 | 25 | 50 |
| 1 | 30 | 50 | 100 |
Two calendar checks sit on top of the trade count:
- Every condition at least once. The paper run should include every session the strategy trades, every weekday, and a weekly open. If it holds positions overnight, it should cross a rollover, including a Wednesday with triple swap if your market charges one.
- No shortcut for slow strategies. A strategy that trades once a week cannot be checked properly in a month. If that is too slow, a faster strategy or more markets is the fix, not a shorter test.
What paper trading can and can't tell you
It is tempting to treat a paper run as a second backtest that proves the edge. The numbers say it can't.
Take a strategy with a 2R target, a 1R stop and a 40% win rate. Its average trade is 0.2R and the standard deviation of its trade results is about 1.47R (the working is in backtest sample size). After n trades, the expected total is 0.2 × n, and a rough 95% band is two standard deviations of the total either side, where the standard deviation of the total is 1.47 × √n.
| Trades | Expected total | Standard deviation of total | Rough 95% band |
|---|---|---|---|
| 30 | 6R | 1.47 × 5.48 ≈ 8.0R | -10R to +22R |
| 50 | 10R | 1.47 × 7.07 ≈ 10.4R | -11R to +31R |
| 100 | 20R | 1.47 × 10 ≈ 14.7R | -9R to +49R |
| 200 | 40R | 1.47 × 14.1 ≈ 20.8R | -2R to +82R |
After 30 or even 100 trades, a sound strategy can be down and a useless one can be up. Paper results inside the band don't prove anything about the edge. That was the backtest's job, along with out-of-sample and stress tests.
What a paper run can show:
- The bot takes the backtest's trades. Re-run the backtest over the paper period and compare trade by trade: every backtest trade should appear on paper at the same candle, with no missing or extra trades. A mismatch is a bug, a data difference or a repainting rule, and it is cheaper to find on paper than live. Why a strategy works in backtest but not live covers the matching method.
- Management rules work in real time. Break-even moves, trailing stops, partial exits and time exits should fire when the backtest says they would.
- Results are not below the band. Inside the band is no evidence of an edge, but below it is real evidence of a problem. Falling below the lower edge after 30 or more trades means stop and investigate.
Compare live with the expectation band, not with the equity curve
Comparing a paper equity curve with the backtest's curve by eye is misleading, because the backtest is one lucky or unlucky path. Compare against the band instead:
- Within the band: behaving as the backtest predicts. Keep going.
- Above the band: check for a bug before celebrating. Results far better than expected can mean trades are filling at prices the live market wouldn't give you.
- Below the band: stop. Something differs from the backtest: costs, fills, data, a rule that doesn't run live, or a market that has changed.
Decide these rules before the first trade, and write down the trade count at which you will judge each stage.
The path from paper to live
A three-stage path, with a rough trade count for each. These are rules of thumb, not standards. Set your own, and set them in advance.
Stage 1: Paper on live prices (at least 30 trades)
The strategy runs on live candles and nothing is sent to a broker. Pass when trades match the backtest for the same period, management rules fire correctly, and results are not below the band.
Paper fills use assumed prices, so paper mode can't tell you about your broker's slippage, rejections or spreads at the open. That is what stage 2 is for.
Stage 2: Demo account with approvals (20 to 30 trades)
Run the strategy on a broker demo account, approving each signal yourself before it is sent. You see every order go through the broker's own order handling, and you can check fills, spreads and stop and target placement. Demo fills are still not real fills, but they are closer than paper.
Pass when orders arrive with the right size, stop and target, fills are close to the backtest's cost assumptions, and nothing surprising happened between signal and order.
Stage 3: Small live size (50 trades or more)
Go live at a fraction of your intended risk: for example 0.25% per trade if you plan to trade at 0.5% or 1%. Live is the only stage with real slippage. Measure it against the figure you used in the backtest (see how much slippage to assume).
Pass when slippage is no worse than assumed and results remain inside the band. Then step size up gradually, rather than jumping to full risk.
By the end of stage 3 the strategy has around 100 trades on live prices, which starts to say something about the edge as well as the mechanics. It still isn't proof, and the comparison never really ends: keep watching live results against the band for as long as the strategy runs.
When to stop instead of going live
- Trades on paper don't match the backtest and you can't find out why.
- Results fall below the expectation band at any stage after the first 30 trades.
- Live slippage is consistently worse than the backtest assumed, and re-running the backtest with the real figure removes most of the edge.
- The drawdown passes the bad case from your Monte Carlo test, or a limit you set before starting.
A strategy that passes every stage can still lose money. Past and paper results are not future results. The strategy, the settings and the risk are yours, and leveraged products such as CFDs and forex can lose money quickly, including more than you expect in fast markets.
Paper, Copilot and small live in Launchpad
Launchpad runs strategies built in Strategy Lab, and its three modes map onto the three stages. It is available on the Standard, Plus and Pro plans.
- Paper: live prices, nothing sent to a broker, and fills use the backtest's own costs. Because the costs match, any gap between paper and the backtest comes from the strategy's behaviour, not from a different cost model. Launchpad re-runs the strategy's rules within seconds of each candle closing, using the same code as the backtest, and Lab management rules such as break-even, trailing stops, partials and time exits run live.
- Copilot: every signal arrives for approval in the app or by Telegram buttons, with a chart, and you approve or reject it. Use it on a cTrader or Liquid Brokers demo account for stage 2. There are no double orders and no stale approvals.
- Autopilot: trades inside your limits once you are ready for stage 3. Risk is set as a percentage per trade (0.5% by default, 5% at most) or a fixed lot, with a required maximum position size, a daily loss limit (3% by default), maximum open trades and trades per day, and trading hours. Each is checked when the signal fires and again before the order is sent.
At every stage, Launchpad's live versus backtest view draws the expectation curve with a 95% band and gives a verdict of within, above or below. You can run paper next to live, or two versions side by side, and pause, stop or use the kill switch at any time. Telegram sends signals, fills, closes with R and P&L, safety alerts and a daily summary. Closed trades are reconciled with the broker and logged into the trade log, where reports and simulations run on them.
Live bot trading is available on cTrader and Liquid Brokers only, on demo or live accounts. It isn't available on MetaTrader, OANDA, IBKR, Binance, Bybit, Alpaca, TradeLocker, Match-Trader or DXtrade, and TradingView alerts can't start bots. See pricing for plans.
Frequently asked questions
- How long should I paper trade before going live?
- Until the strategy has taken at least 30 trades and covered every session and weekday it trades, and its trades match the backtest's trades for the same period. For a strategy that trades daily that might be six weeks; for a weekly one it can be more than six months. Then move to a demo account and small live size rather than straight to full size.
- What is forward testing a trading strategy?
- Forward testing runs a finished strategy on live prices, on paper or at small size, so the results can't have influenced the rules. It checks that the strategy behaves as the backtest predicts and exposes problems a backtest can only estimate, such as fills, slippage and execution delays.
- Backtest vs forward test: what's the difference?
- A backtest runs the rules over historical data, where you can see the outcome and keep adjusting. A forward test runs the unchanged rules in real time, so it is free of that tuning. A backtest needs many trades to estimate an edge; a forward test mainly confirms the backtest's trades and costs hold up live.
- Is 30 trades enough paper trading?
- It is enough to check the mechanics: that the bot takes the same trades as the backtest and that management rules fire. It is not enough to judge the edge, because after 30 trades a sound strategy can easily be down. Use the backtest's expected band and keep comparing as live trades add up.
- Are paper trading bot results realistic?
- They are only as realistic as the fills they assume. Paper fills don't include your broker's real slippage, rejections or spread spikes, which is why a demo account and then small live size should follow. If paper fills use the backtest's own costs, paper results should track the backtest closely; a gap means the strategy is behaving differently live.
Keep reading
 TradingView backtests
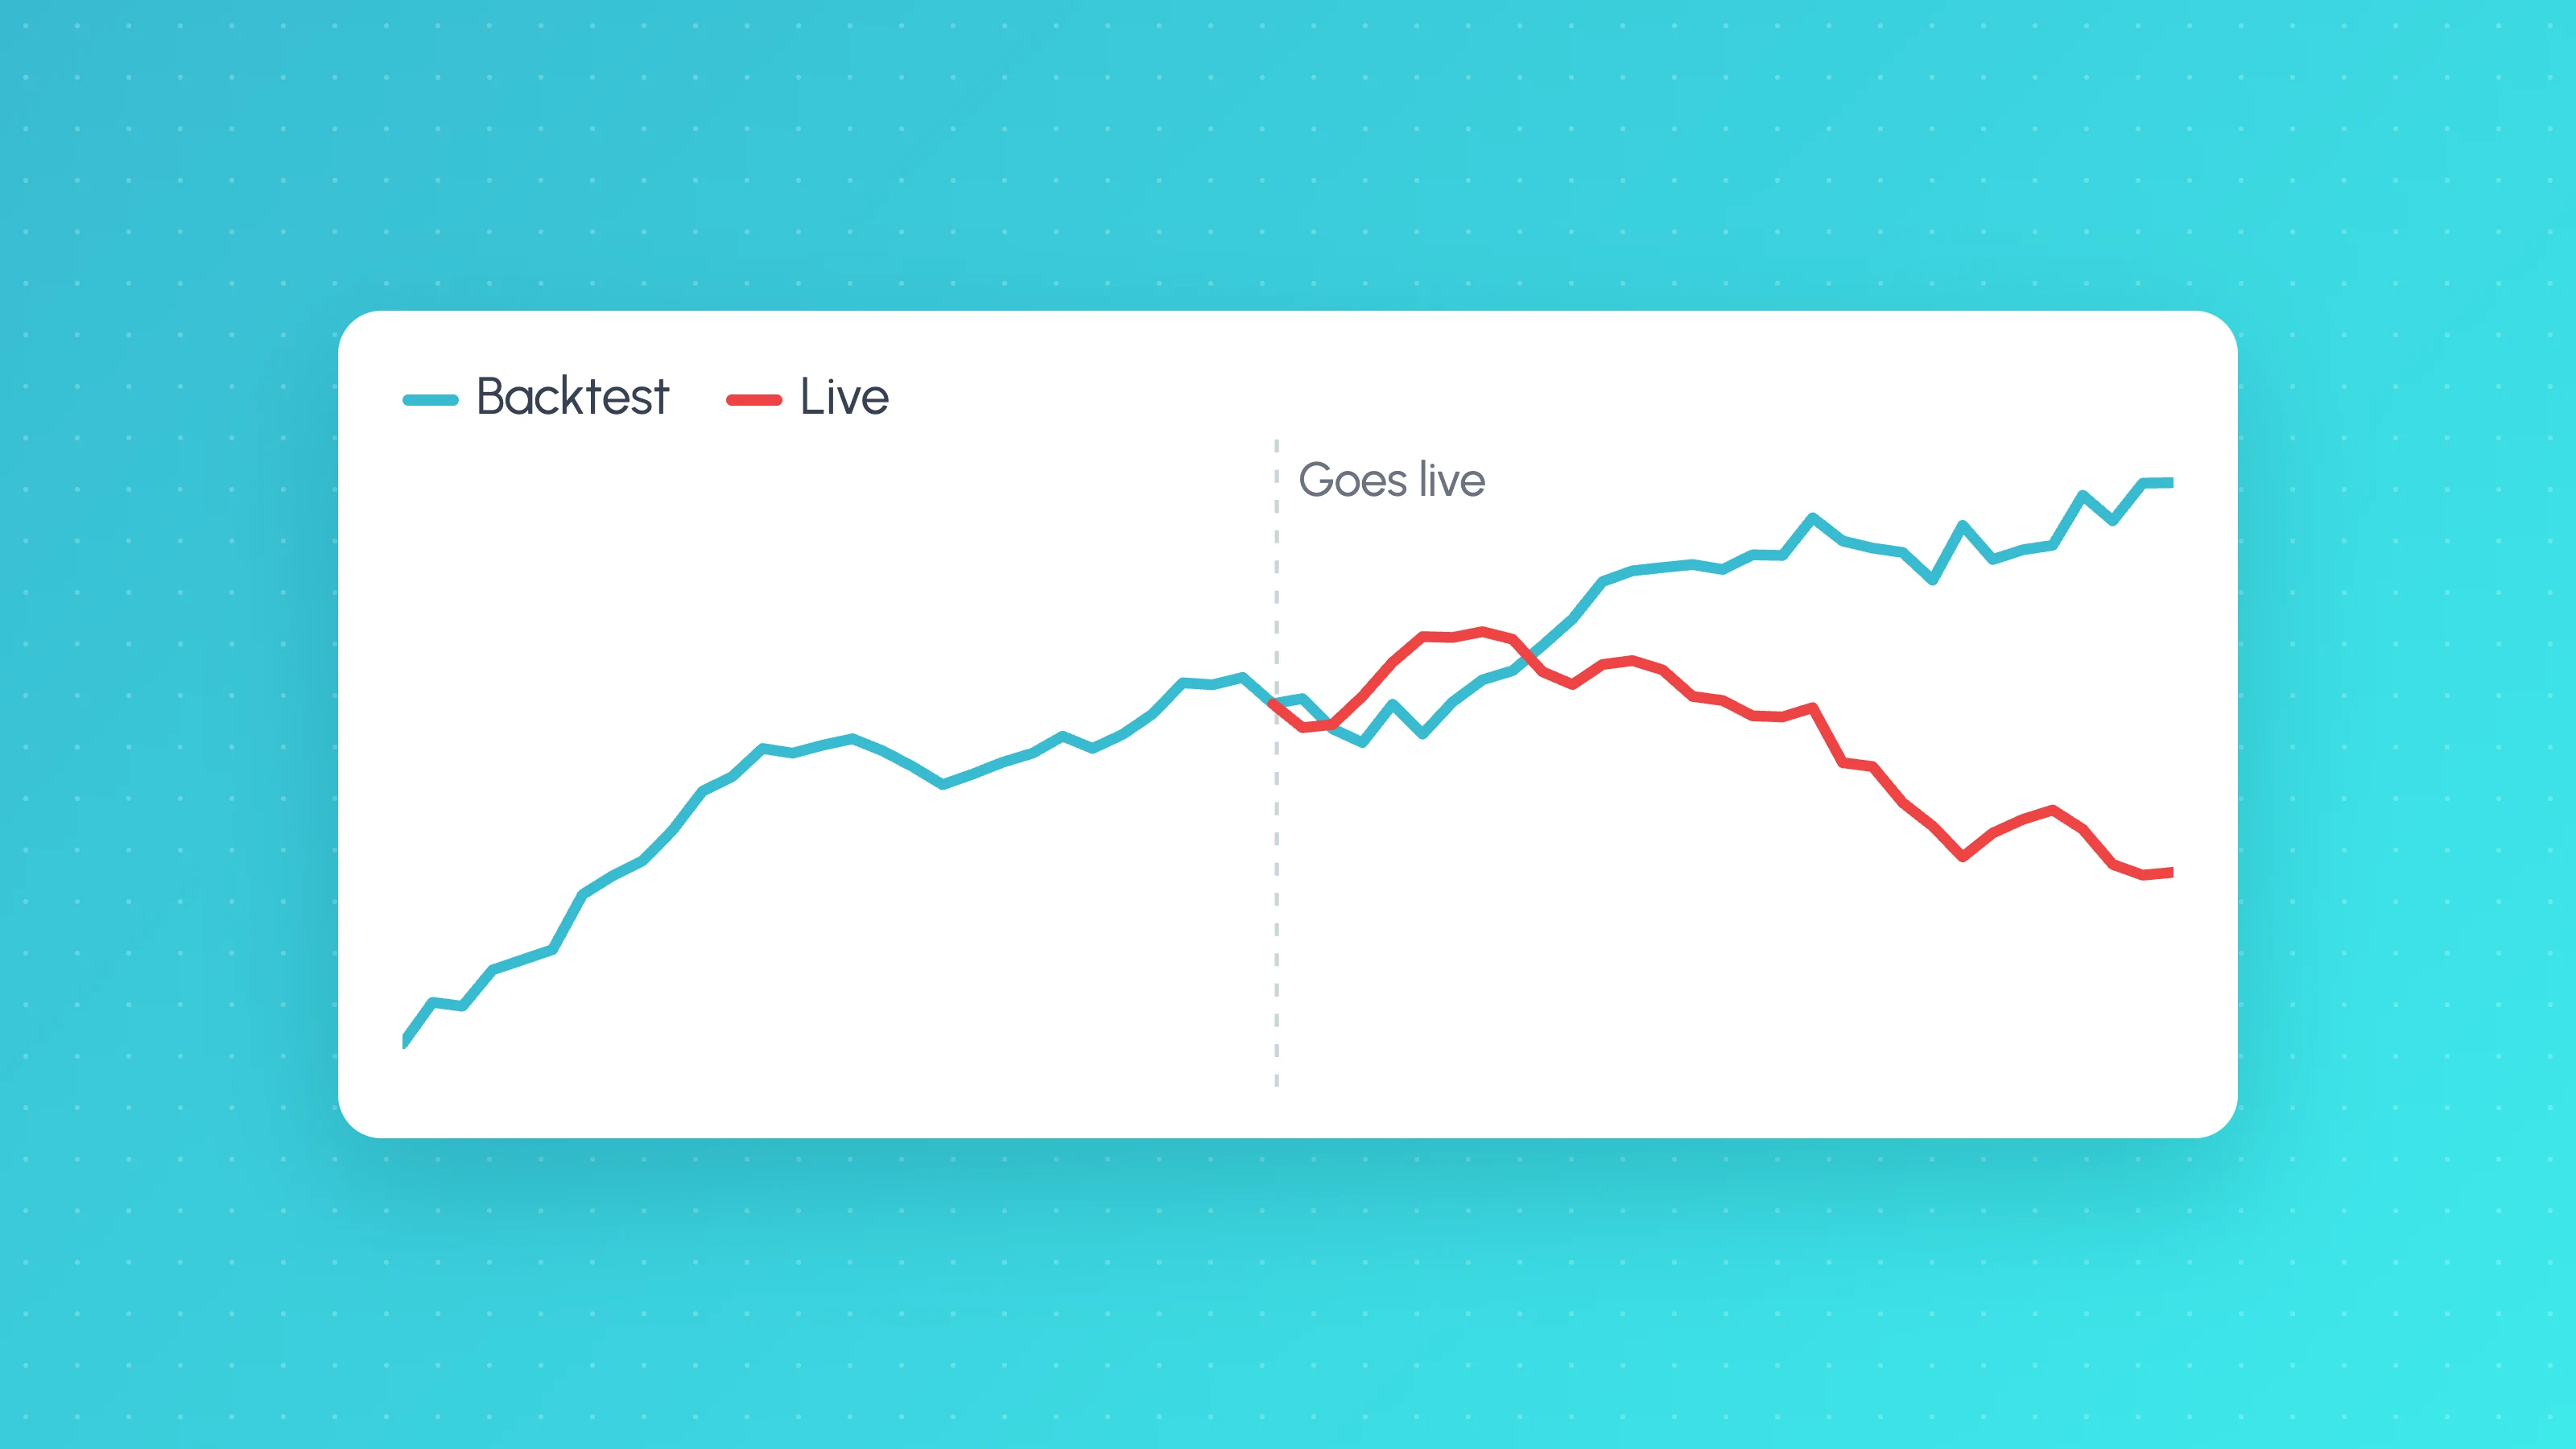
Why Does My Strategy Work in Backtest but Not Live?
Why a TradingView strategy works in backtest but not live: costs, fill assumptions, repainting, gaps, data, alert delays and overfitting, with a check for each.
 TradingView backtests
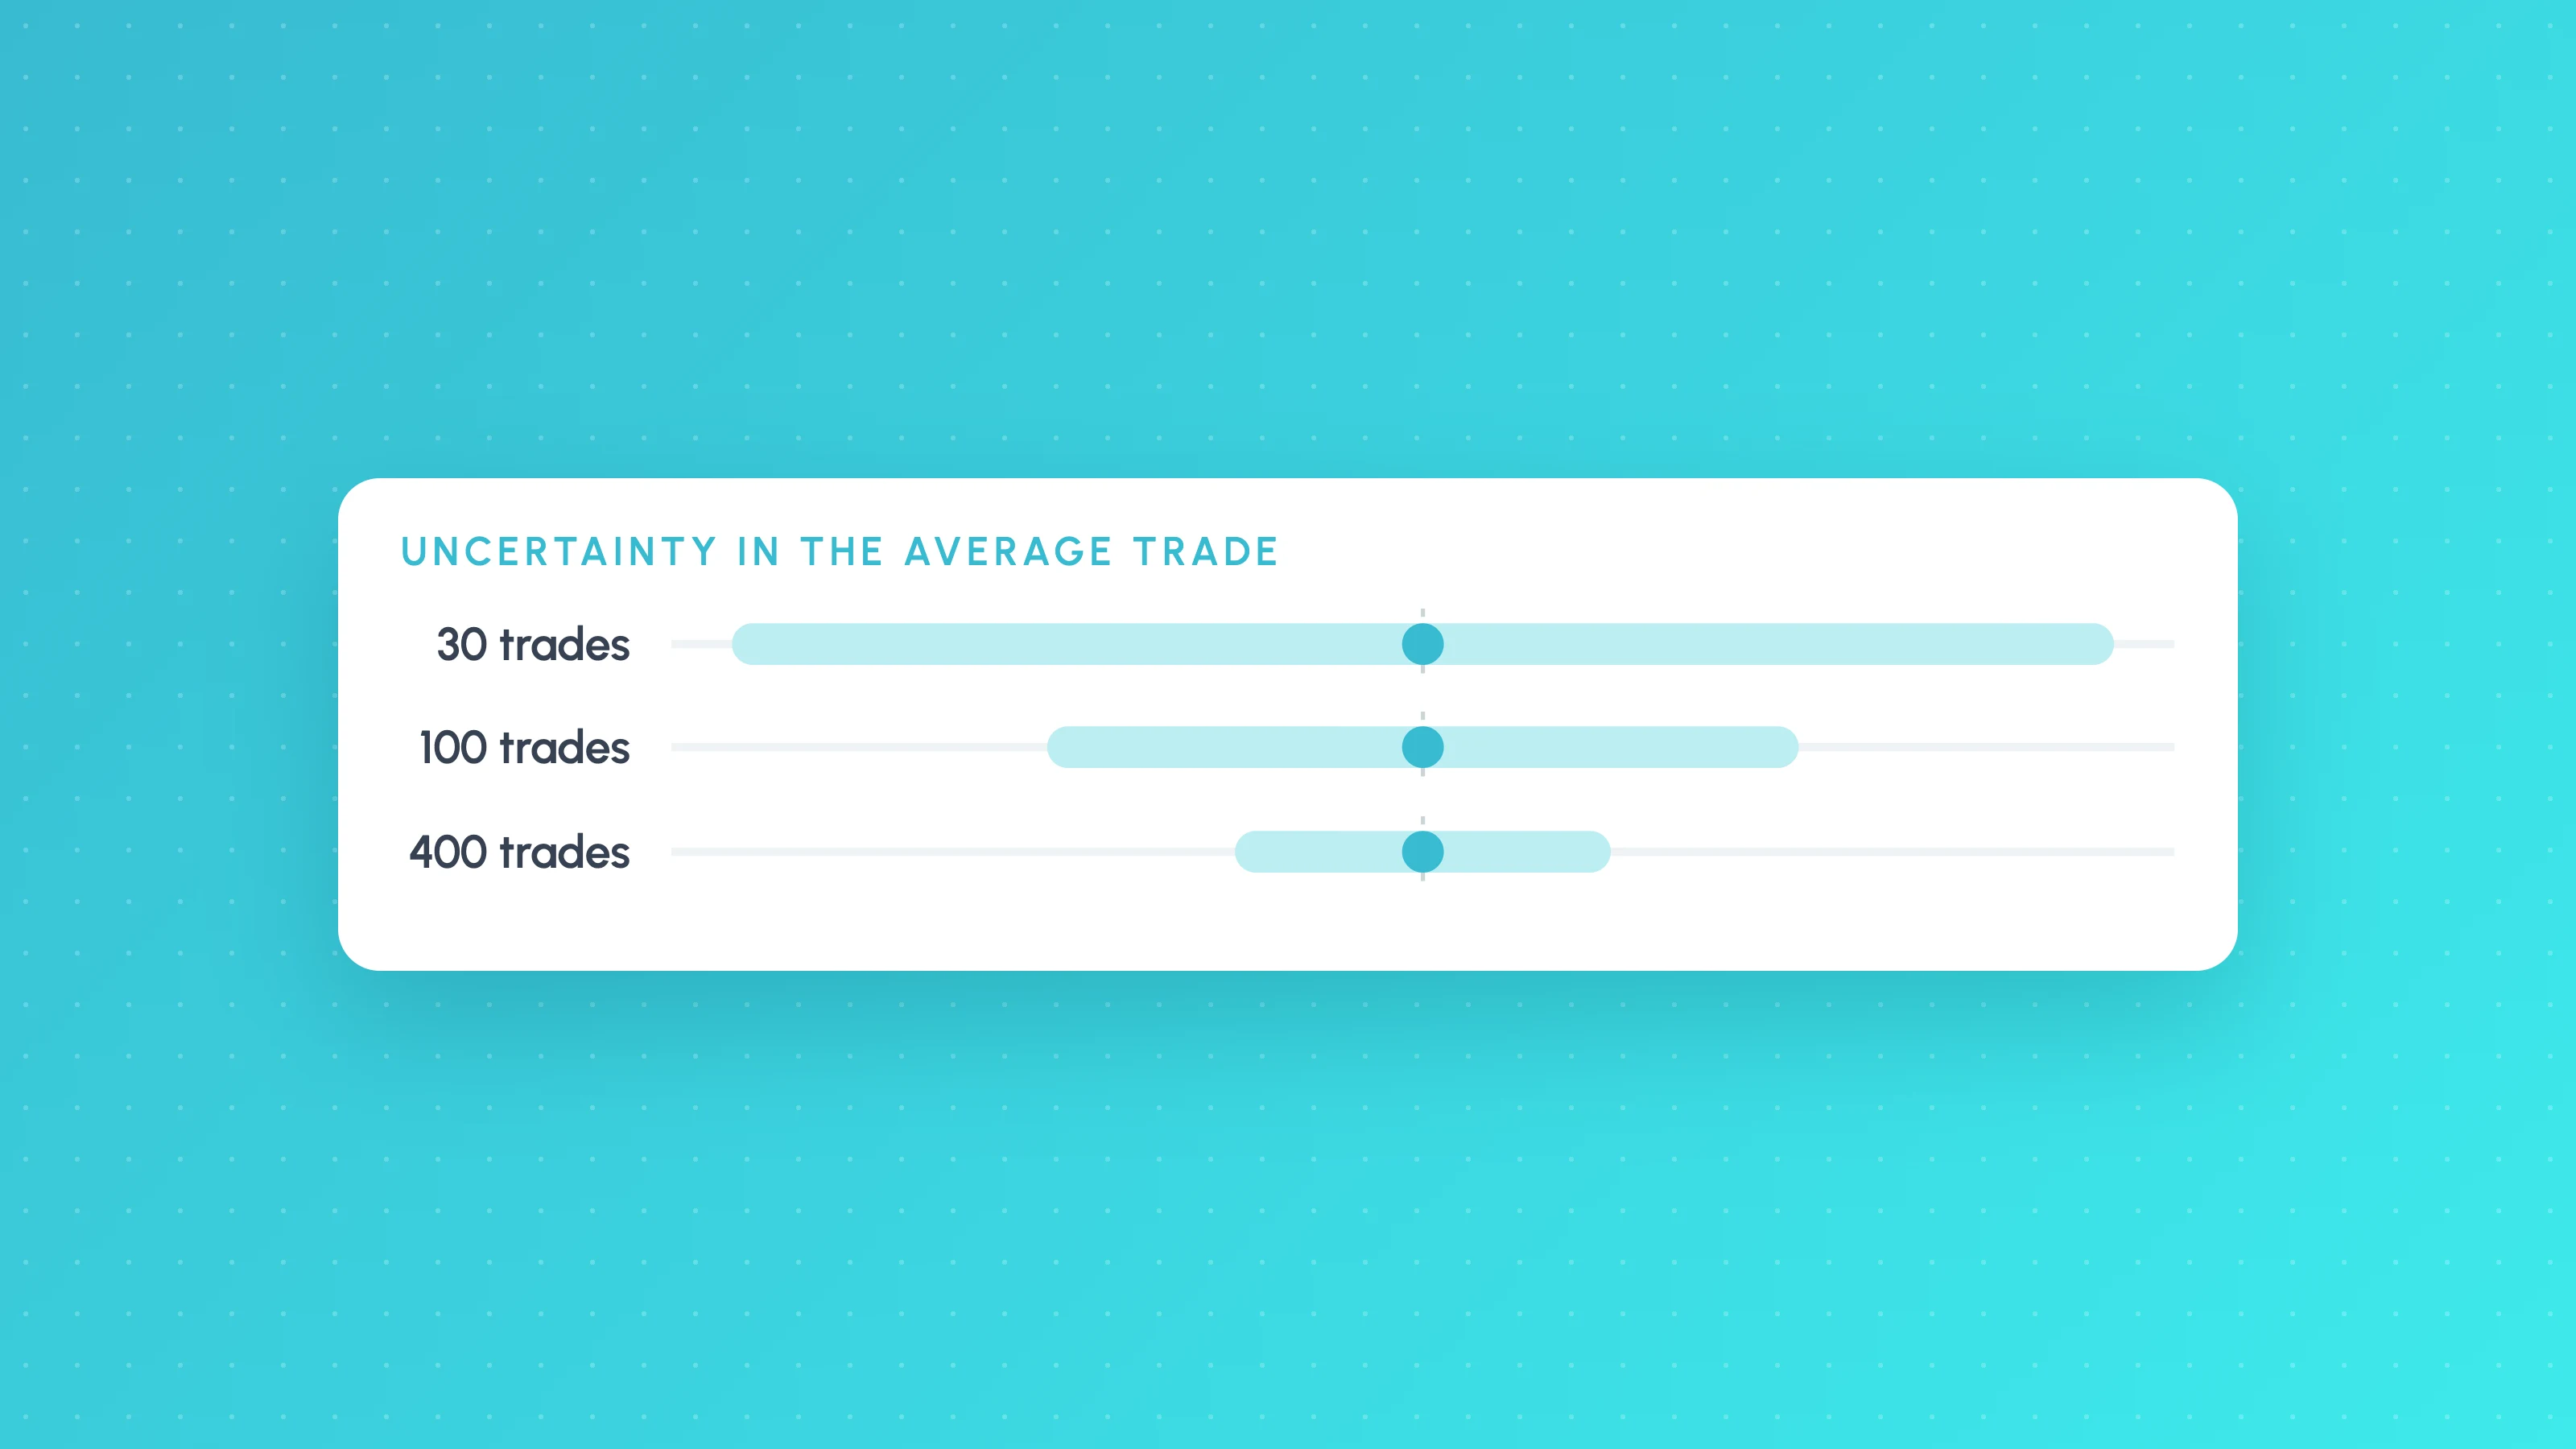
How Many Trades Do You Need for a Valid Backtest?
How many trades a backtest needs: rules of thumb, the t-statistic formula with a worked example, a table by edge size, per-bucket minimums and multiple testing.
 TradingView backtests
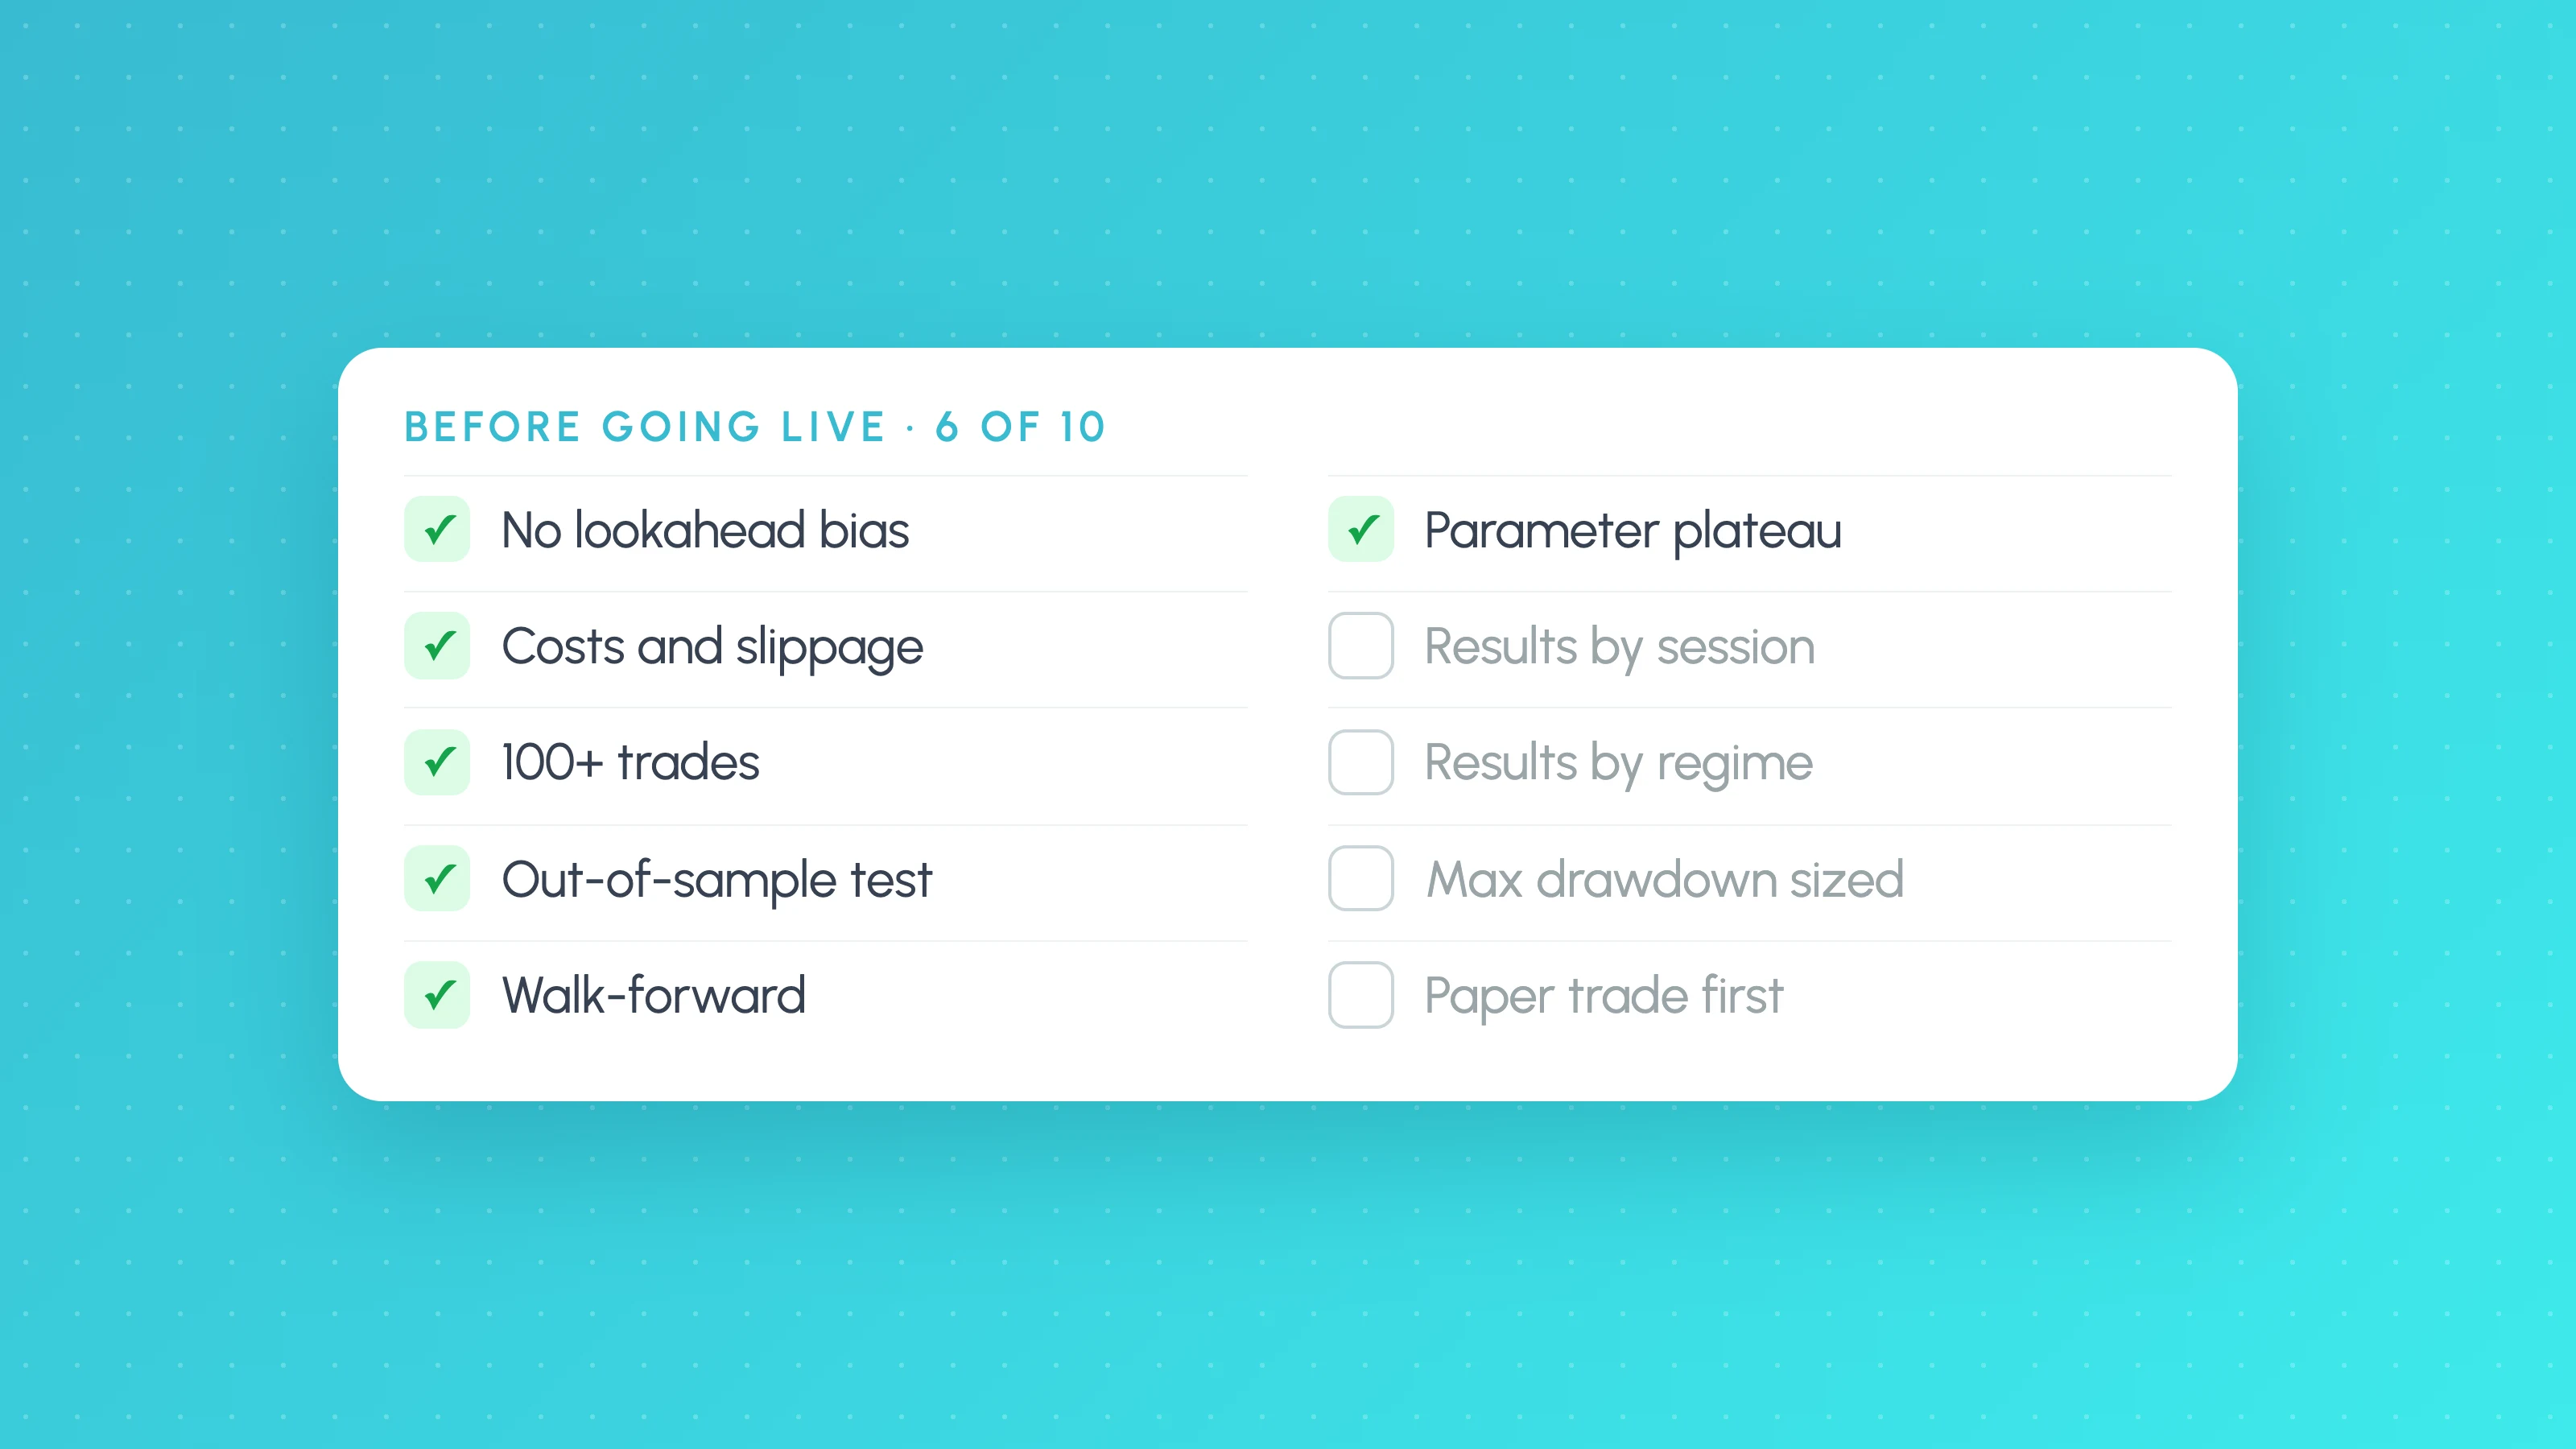
Backtest Validation Checklist: 10 Checks Before You Trade a Strategy Live
A backtest validation checklist: 10 checks to run before going live, from costs, fills and repainting to out-of-sample, Monte Carlo and forward tests.