

How Much Slippage Should You Assume in a Backtest? (and How to Measure It on Live Fills)
How much slippage in algo trading? Start at 1-2 ticks per side on liquid futures, more for stops and news, then measure real fills to replace the guess.
By Tessera Trades · Updated · 12 min read
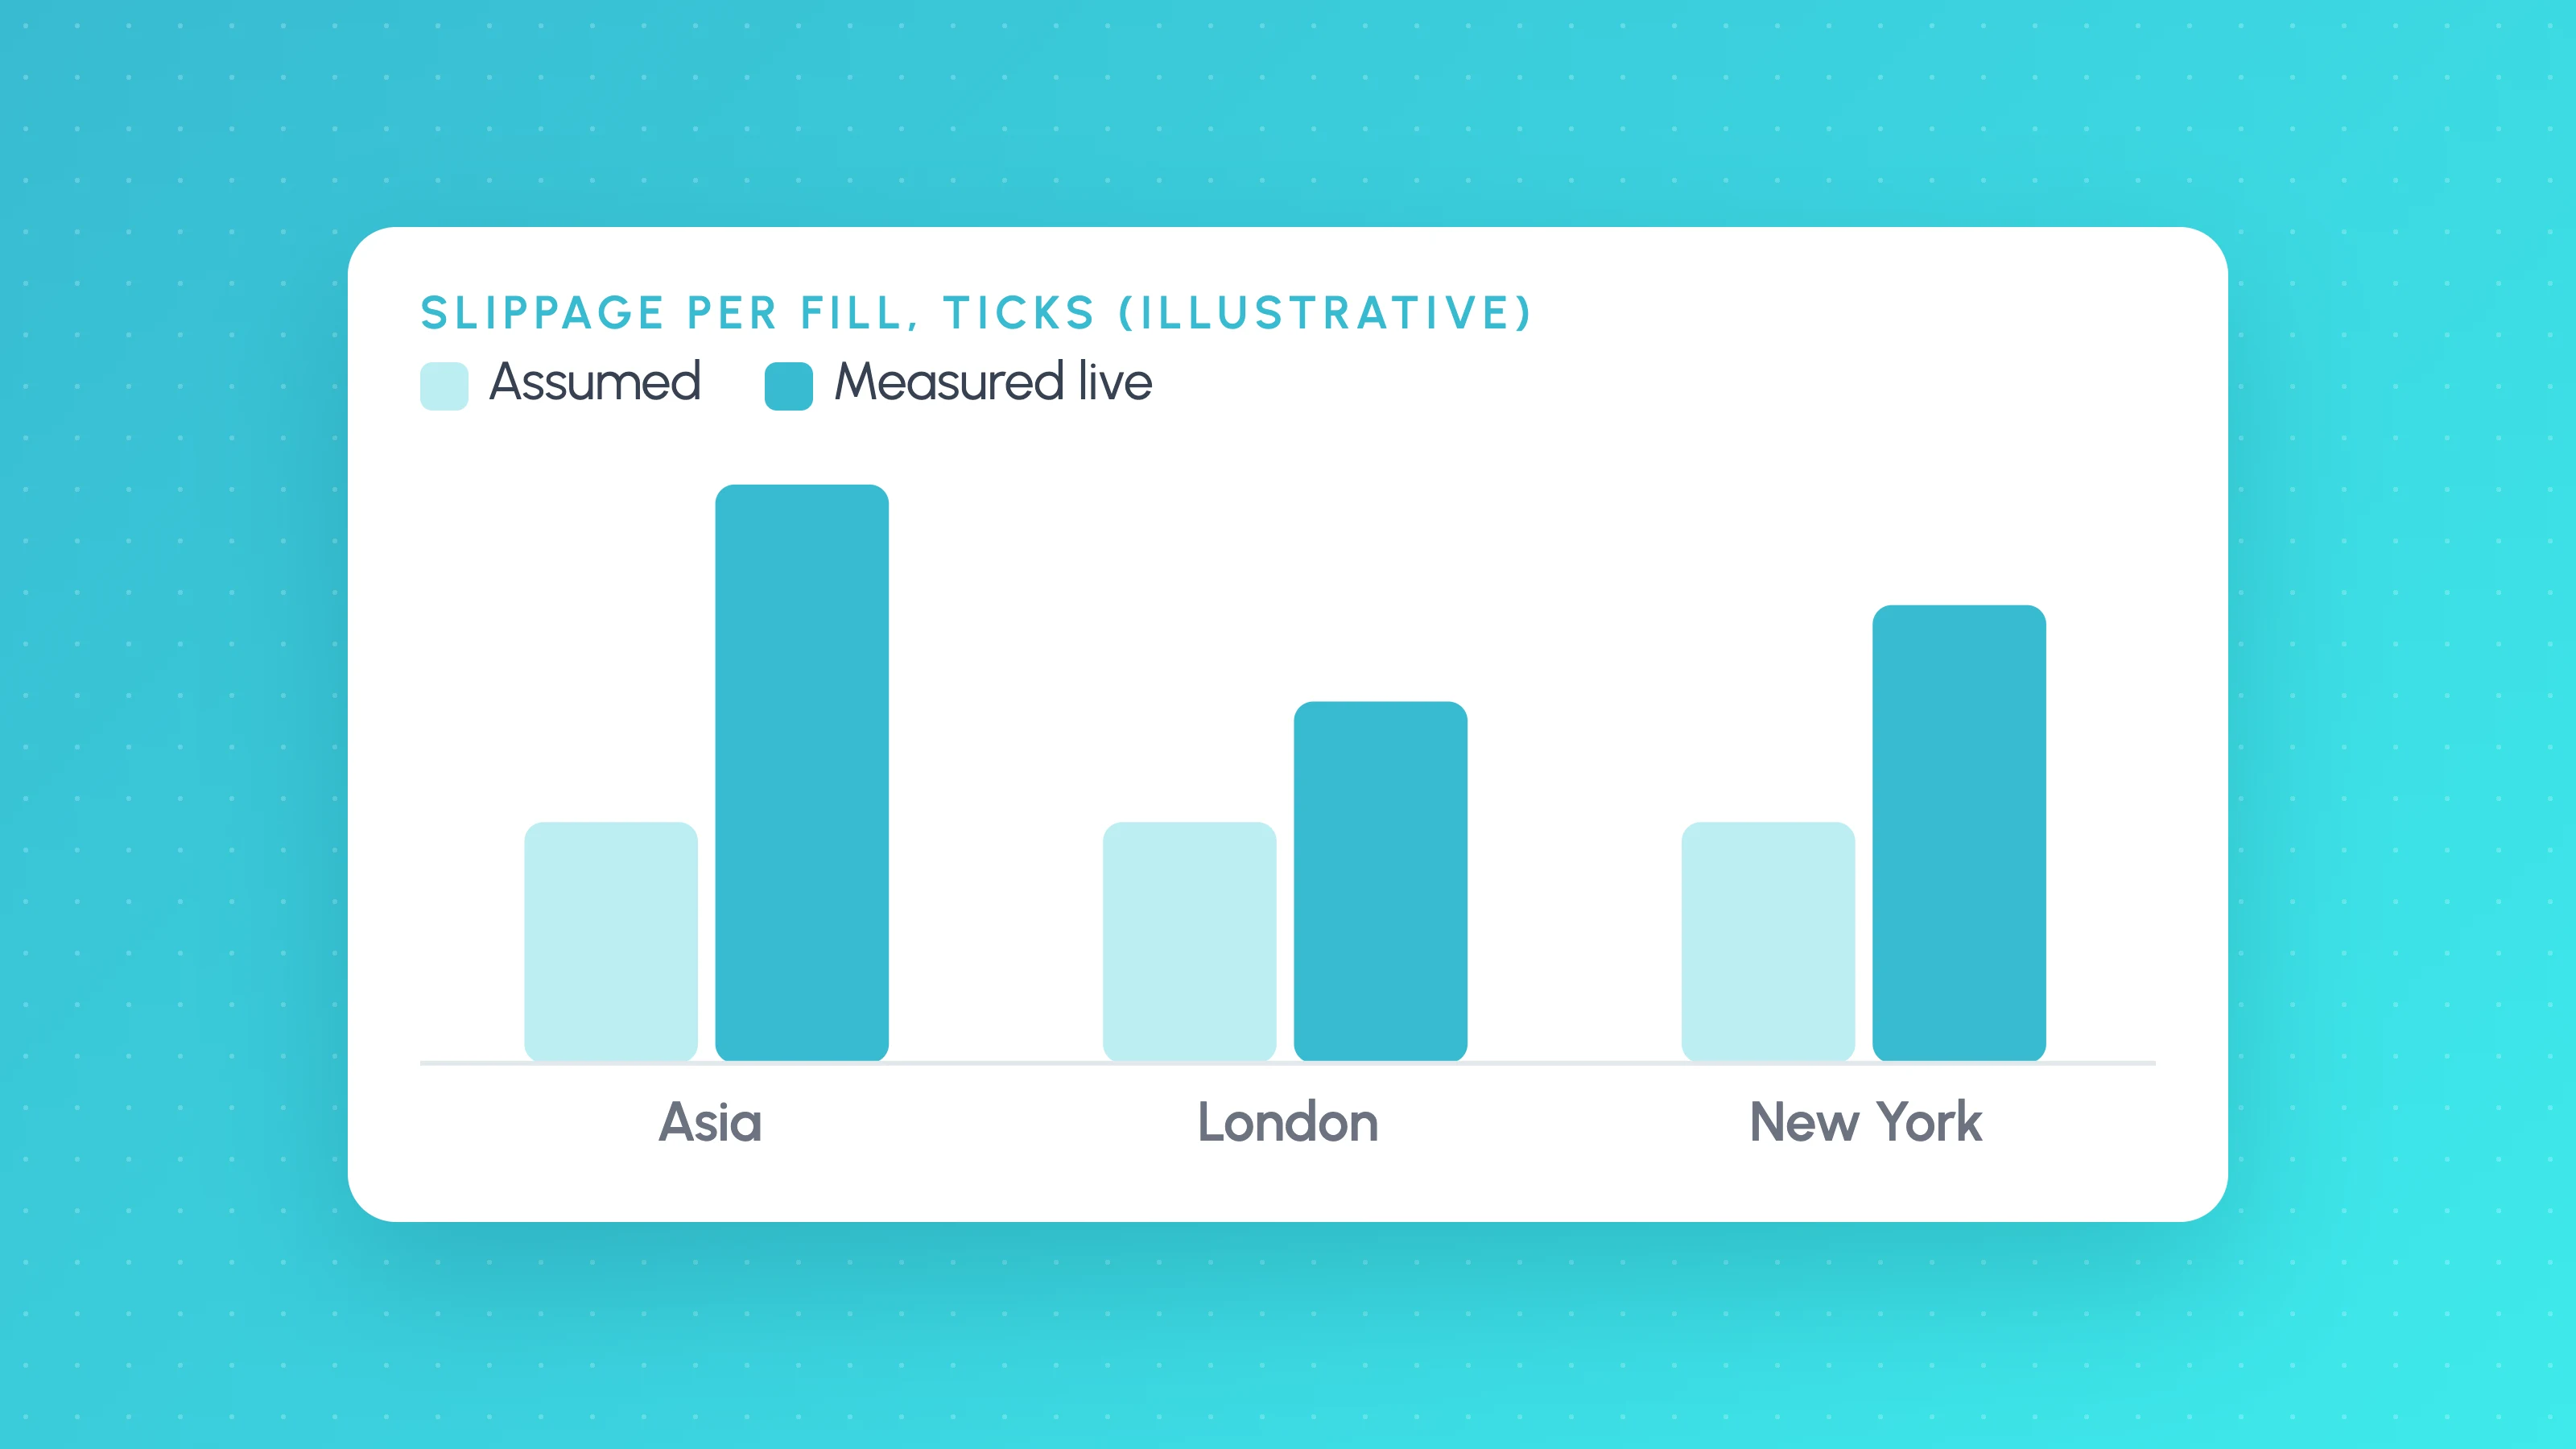
There is no standard slippage figure for algo trading, but a common conservative starting point for market and stop orders on liquid futures is 1 to 2 ticks per side, with more for stops, the open and news releases, and spread plus a margin on top for forex, CFDs and crypto. Treat that number as a placeholder: once you have live trades, measure the gap between the price your strategy intended and the price you were filled at, and put that into the backtest instead.
Slippage matters most for strategies that trade often and make only a few ticks per trade. This guide separates slippage from spread and commission, shows how TradingView and MetaTrader 5 handle it, gives starting assumptions by market type, and walks through measuring it on your own fills. A worked example shows how quickly costs move profit factor.
Slippage vs spread vs commission
These are three different costs, and a backtest needs all three.
| Cost | What it is | Known in advance? |
|---|---|---|
| Commission | The fee your broker and exchange charge per order, per contract or as a percentage | Yes, from your broker's fee schedule |
| Spread | The gap between the bid and the ask. A market buy pays the ask, a market sell receives the bid | Roughly, but it widens at certain times |
| Slippage | The difference between the price you expected and the price you were filled at | No, it varies by order, time and size |
Spread and slippage overlap in practice. If your backtest uses mid or last-trade prices from a chart, crossing the spread shows up as slippage on your live fills. If your backtest already uses bid and ask data, slippage is only the extra movement on top of that.
Order type decides who pays. A stop order is not a guaranteed price: the SEC's investor bulletin on stop, stop-limit and trailing stop orders explains that once the stop price is reached, the order becomes a market order, and the execution price "can deviate significantly from the stop price". Limit orders can't fill at a worse price, but they carry a different cost: they may not fill at all, and one 2024 paper argues that limit order fills tend to coincide with adverse price moves, using a market model and a simulation on Treasury futures (DeLise, "The Negative Drift of a Limit Order Fill"). A backtest that fills every limit on a touch overstates both the number and the quality of those fills.
Why a few ticks decide so many strategies
Costs are a fixed charge on every trade, while the edge is spread thinly across them. If a strategy's average trade is only a few ticks, a tick or two of slippage per side can be most of it.
Two recent public examples show the pattern. On the MQL5 forum, one trader reported in September 2026 rebuilding a published opening range breakout rule on the Nasdaq and getting about +0.13R per trade before costs, which fell to about +0.002R with CFD costs. On Elite Trader, a poster who backtested 37 well-known strategies in June 2026 (106 backtests, about 99,000 trades) said almost none cleared fees once costs were switched on. These are individual traders' results, not studies, but they match what most systematic traders find the first time they add realistic costs.
How slippage works in TradingView
In Pine Script, slippage is set as a fixed number of ticks. The strategies documentation (as of 2026-10) says the slippage argument of strategy() defaults to 0, can be overridden with the Slippage input in the Properties tab, and moves fills by that many ticks in the unfavourable direction: higher for buys, lower for sells. Commission also defaults to none, and can be set as a flat fee per order, a fee per contract or unit, or a percentage of trade value.
//@version=6
strategy("With costs", overlay = true,
     commission_type = strategy.commission.cash_per_contract,
     commission_value = 2.5,
     slippage = 2,
     backtest_fill_limits_assumption = 1)
Three things to know about it:
- It is in ticks, not price. Two ticks on a futures contract is a meaningful amount. On a crypto pair or share CFD whose tick is a tiny fraction of the price, 2 ticks is close to nothing, so convert your intended slippage into ticks for that symbol before you enter it.
- It is constant. The documentation describes slippage as dynamic and impossible to simulate precisely, so a fixed amount per order is an approximation. It also notes that a fixed amount can push some simulated fills outside the bar's range, and that too much slippage makes results unrealistically bad.
- Limit fills are handled separately.
backtest_fill_limits_assumptionsets how many ticks price must move beyond a limit order's level before the emulator fills it. At the default of 0, a limit fills as soon as price touches it. Since the July 2026 update, the Properties tab shows this as the Limit order execution menu, and the parameter sets its default (release notes).
TradingView's newer execution settings, including Bar detalization and order delay, also change fills. Our guide to those settings covers what each one does.
How slippage works in MetaTrader 5
The MT5 Strategy Tester has no fixed slippage setting. Instead, its testing help page (as of 2026-10) offers execution delay modes:
- No delay: orders execute at the requested price without requotes, which the help describes as ideal conditions.
- Fixed delay: you set a delay, for example the ping the terminal measures to your broker's trade server.
- Random delay: a delay of 0 to 8 seconds 90% of the time and 9 to 18 seconds 10% of the time.
With a delay, the price can move between the request and the execution, so slippage comes from the tick data rather than a number you type in. The help notes that for pending orders, delays apply to placing the order but not to its execution. If you run an EA on MT5, test it with a delay that matches your own setup, and compare the result with no delay. A large gap means the strategy depends on speed it may not get.
Starting assumptions by market type
There is no authoritative table of slippage by market, and any single number will be wrong for some symbols, sessions and order sizes. The figures below are conservative starting points to test against, not measurements. The 2-tick figure for liquid futures reflects what traders commonly use; in one Elite Trader thread on backtest slippage from November 2021, the original poster used 2 ticks on market orders in ES, NQ and similar contracts to stay conservative, and one experienced reply called 2 ticks conservative for small orders in those markets. The rest are our suggestions for where to begin.
| Market and order type | Suggested starting slippage | Notes |
|---|---|---|
| Liquid index futures, market orders, small size | 1 to 2 ticks per side | Add commission separately from your broker's schedule |
| Liquid futures, stop orders | 2 ticks or more per side | Stops become market orders in fast moves |
| Thinner futures (smaller contracts, less liquid months) | 2 to 4 ticks per side | Check the typical bid-ask spread first |
| Forex and CFDs, market and stop orders | Your broker's typical spread at your trading hours, plus about half that again | Use the spread at the times you trade, not the advertised minimum |
| Crypto, market orders on major pairs | The quoted spread plus a margin for your order size | Enter the taker fee as commission, not slippage. Convert to ticks for TradingView, since crypto ticks are small |
| Limit orders on any market | No slippage, but require price to trade through | Set backtest_fill_limits_assumption to 1 or more |
| Any market around the open or major news | Double your normal figure, or exclude those minutes | Test both ways |
A more useful test is to find the slippage at which the strategy stops working. Run the backtest at 0, 1, 2 and 4 ticks per side. If the result only holds at 0 or 1, the edge is too thin to trust until your live fills say otherwise.
Worked example: how costs change profit factor
A generic example, not real data. A strategy on a futures contract with a tick value of $5 has 200 trades: 90 winners averaging $400 and 110 losers averaging $250, before any costs. Commission is $4 per round trip. Each tick of slippage per side costs $10 per trade (one tick on entry, one on exit).
| Costs per trade | Gross profit | Gross loss | Profit factor | Net profit |
|---|---|---|---|---|
| None | $36,000 | $27,500 | 1.31 | $8,500 |
| $4 commission only | $35,640 | $27,940 | 1.28 | $7,700 |
| Commission + 1 tick per side ($14) | $34,740 | $29,040 | 1.20 | $5,700 |
| Commission + 2 ticks per side ($24) | $33,840 | $30,140 | 1.12 | $3,700 |
| Commission + 4 ticks per side ($44) | $32,040 | $32,340 | 0.99 | -$300 |
The average trade before costs is $42.50, or 8.5 ticks. Two ticks per side plus commission takes more than half of it, and four ticks per side wipes it out. This is a simplification, since in practice a limit exit at a target doesn't slip (its risk is not filling) while a stop exit does, but the direction is right: the thinner the average trade relative to the tick, the more the slippage assumption decides the result.
How to measure slippage on your live fills
Once a strategy is live, even on a small size, you can replace the assumption with a measurement.
- Record the intended price. For a market entry on a signal, this is the price at the moment the signal fired, usually the bar close the backtest used. For a stop, it is the stop price. For a target, it is the limit price.
- Record the fill price from your broker's execution report, not from the platform's position summary, which may average fills.
- Calculate signed slippage per side in ticks, so that bad slippage is negative:
Long entry slippage  = (Intended price - Fill price) / Tick size
Short entry slippage = (Fill price - Intended price) / Tick size
For exits, reverse the signs: a long exit filled below the intended price is negative.
- Average by order type. Keep market entries, stop exits and limit exits separate. They behave differently, and mixing them hides the problem.
- Average by time of day. Group fills by session or hour. The median is often more useful than the mean, because a few bad fills around news can dominate an average.
You need a reasonable number of fills before trusting the average; 30 or more per order type is a sensible minimum, as with any slice of trade data. Backtest sample size explains why small samples mislead.
If alerts drive your execution, also log the alert time and the fill time. Delay between them is part of your slippage, and it explains a lot of the gap between backtest and live results.
Where slippage clusters
Slippage is not spread evenly through the day. Two windows stand out.
- The open. One broker's market volatility disclosure warns that high volumes at the market open can cause delays and executions at prices significantly away from the quote at the time the order was entered.
- Scheduled news. In a study of the US Treasury market, Fleming and Remolona (1999) found that the bid-ask spread widens dramatically at major macroeconomic announcements and stays moderately wide for a period afterwards. Similar effects are plausible in other markets: a stop that triggers in the seconds after a data release can fill into a thin, moving book.
The practical result is that one slippage figure for the whole day is usually wrong in both directions: too high for quiet hours and too low for the open and news. If your strategy trades through those windows, either use a higher figure for trades in them or test whether excluding them helps. Splitting results by session and hour, as in analysing a TradingView backtest, shows whether those trades earn enough to cover the extra cost.
Tessera can help with this part. Import the Strategy Tester export and your live history (TradingView, MT4/5, NinjaTrader, Tradovate and Hyperliquid by file, or live sync from Interactive Brokers, OANDA, cTrader, Binance and Liquid Brokers), and both are broken down by session, weekday, time of day and volatility, so you can see which conditions the live gap comes from. Tessera reads trades that already happened; it does not generate new fills or place orders.
Putting it into the backtest
Once you have measured slippage:
- Set the TradingView
slippagevalue to your median per-side figure in ticks for the order type that dominates the strategy, usually market entries or stop exits. - If the open or news hours are much worse, test the strategy with those minutes excluded, and compare the result with the full-day version at the higher figure.
- Re-run the stress test at double your measured figure, and repeat the measurement every few months, since liquidity changes with volatility.
A cost stress test asks how much the result depends on that figure. Re-run the backtest at half and at double your expected costs: if the edge disappears at double, it relies on fills you may not get. How to stress test a trading strategy covers cost stress alongside the other robustness checks, and the robustness report in Tessera's Strategy Lab runs it at half, typical and double costs.
The backtest validation checklist puts costs alongside the other checks worth running before a strategy goes live.
Check where your costs hurt most
Run your live fills or backtest trades, from a synced broker, a platform export or any spreadsheet, through the free Entry Analysis report to see results by session, weekday, time of day and volatility, with the trade count behind each slice. No card needed.
Frequently asked questions
- How much slippage should I use in my backtest?
- Start with 1 to 2 ticks per side for market and stop orders on liquid futures, and the broker's typical spread plus a margin for forex, CFDs and crypto. Then run the backtest at several values to see where the strategy stops working. Replace the guess with your measured live slippage as soon as you have 30 or more fills per order type.
- How much slippage is normal?
- It depends on the market, the order type, your size and the time of day, so there is no single normal figure. Spreads widen around the open and major news, and stops become market orders once triggered, so the same strategy can see very different slippage at different hours. The only reliable figure is the one measured on your own fills.
- How do I set slippage in TradingView?
- Open the strategy's Settings, go to the Properties tab and enter a value in Slippage, in ticks. You can also set it in code with the
slippageargument ofstrategy(). It defaults to 0, so a backtest without it assumes perfect fills. - Does slippage apply to limit orders?
- A limit order can't fill at a worse price than its limit, so in that sense it has no slippage. The cost shows up differently: the order may not fill at all, and fills tend to happen when price is moving against you. In TradingView, set
backtest_fill_limits_assumption(or the Limit order execution menu in Properties) so limits need price to trade through before they fill. - Why is my strategy profitable before fees but not after?
- Because its average trade is too small relative to commission, spread and slippage. Divide the average trade by the tick value; if it is only a few ticks, costs take most of it. Reducing trade frequency, avoiding the most expensive hours or targeting larger moves can help, but test any change out of sample.
Keep reading
 TradingView backtests
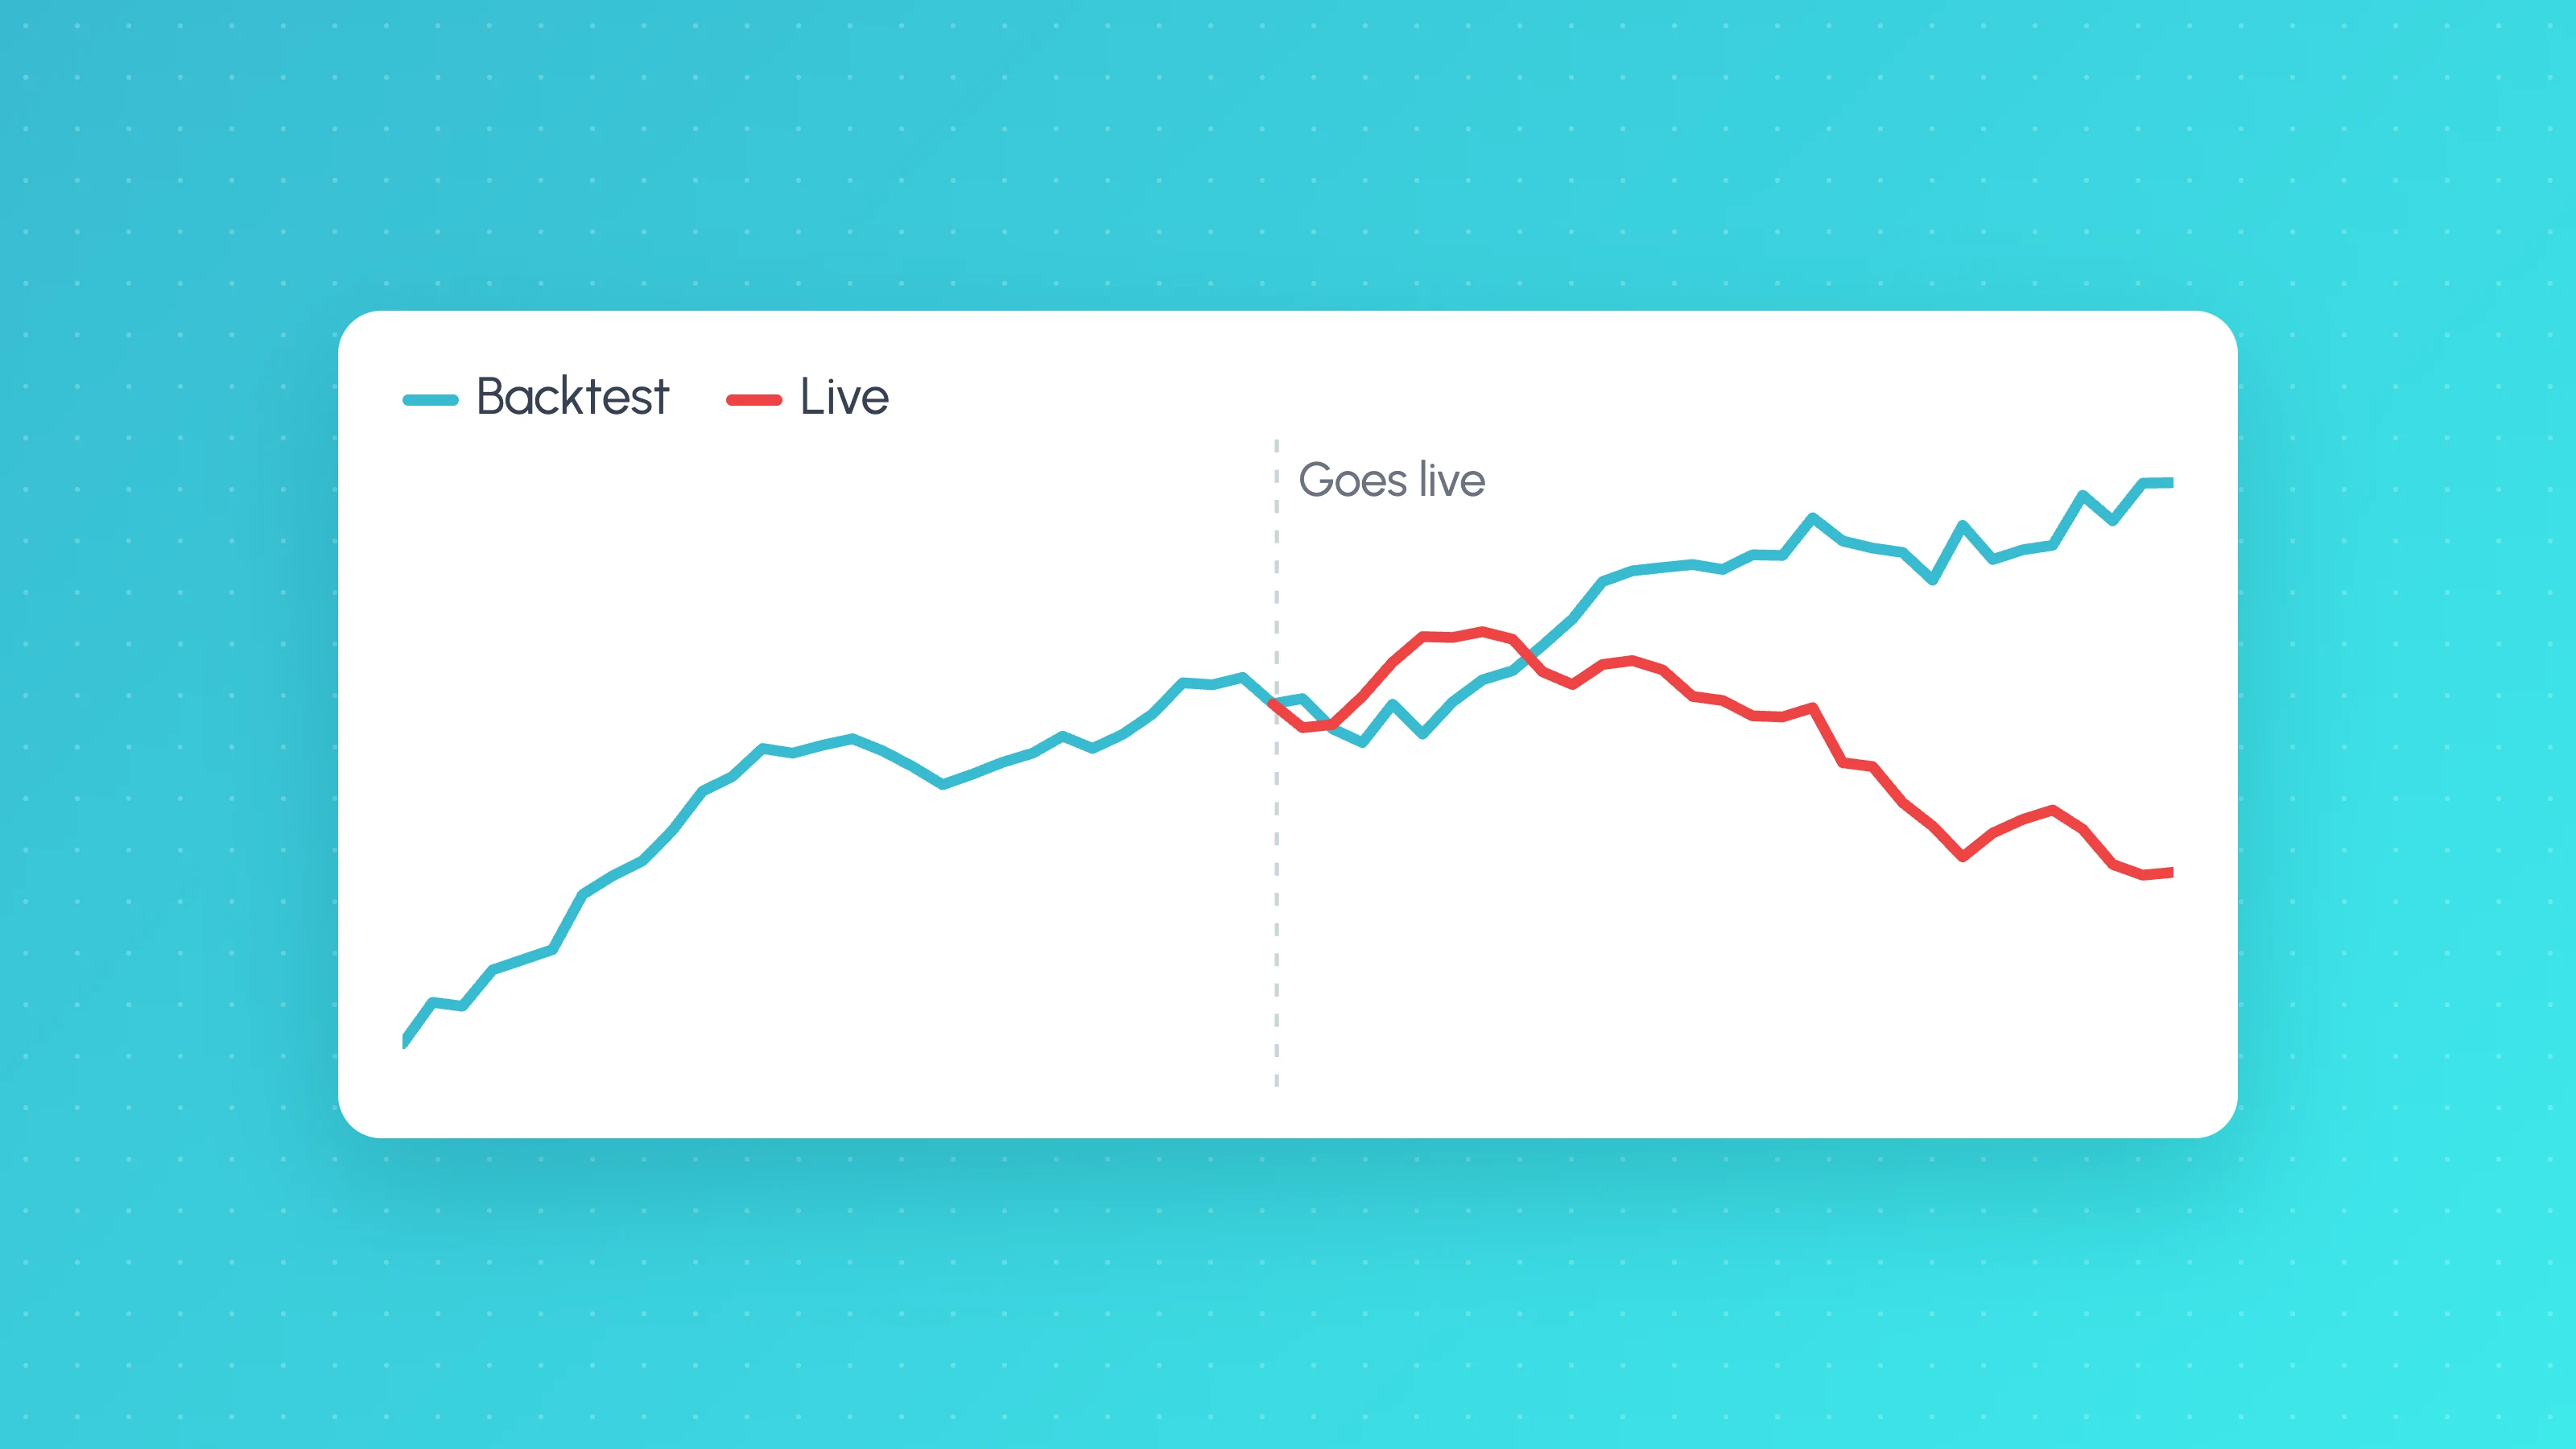
Why Does My Strategy Work in Backtest but Not Live?
Why a TradingView strategy works in backtest but not live: costs, fill assumptions, repainting, gaps, data, alert delays and overfitting, with a check for each.
 Trading metrics
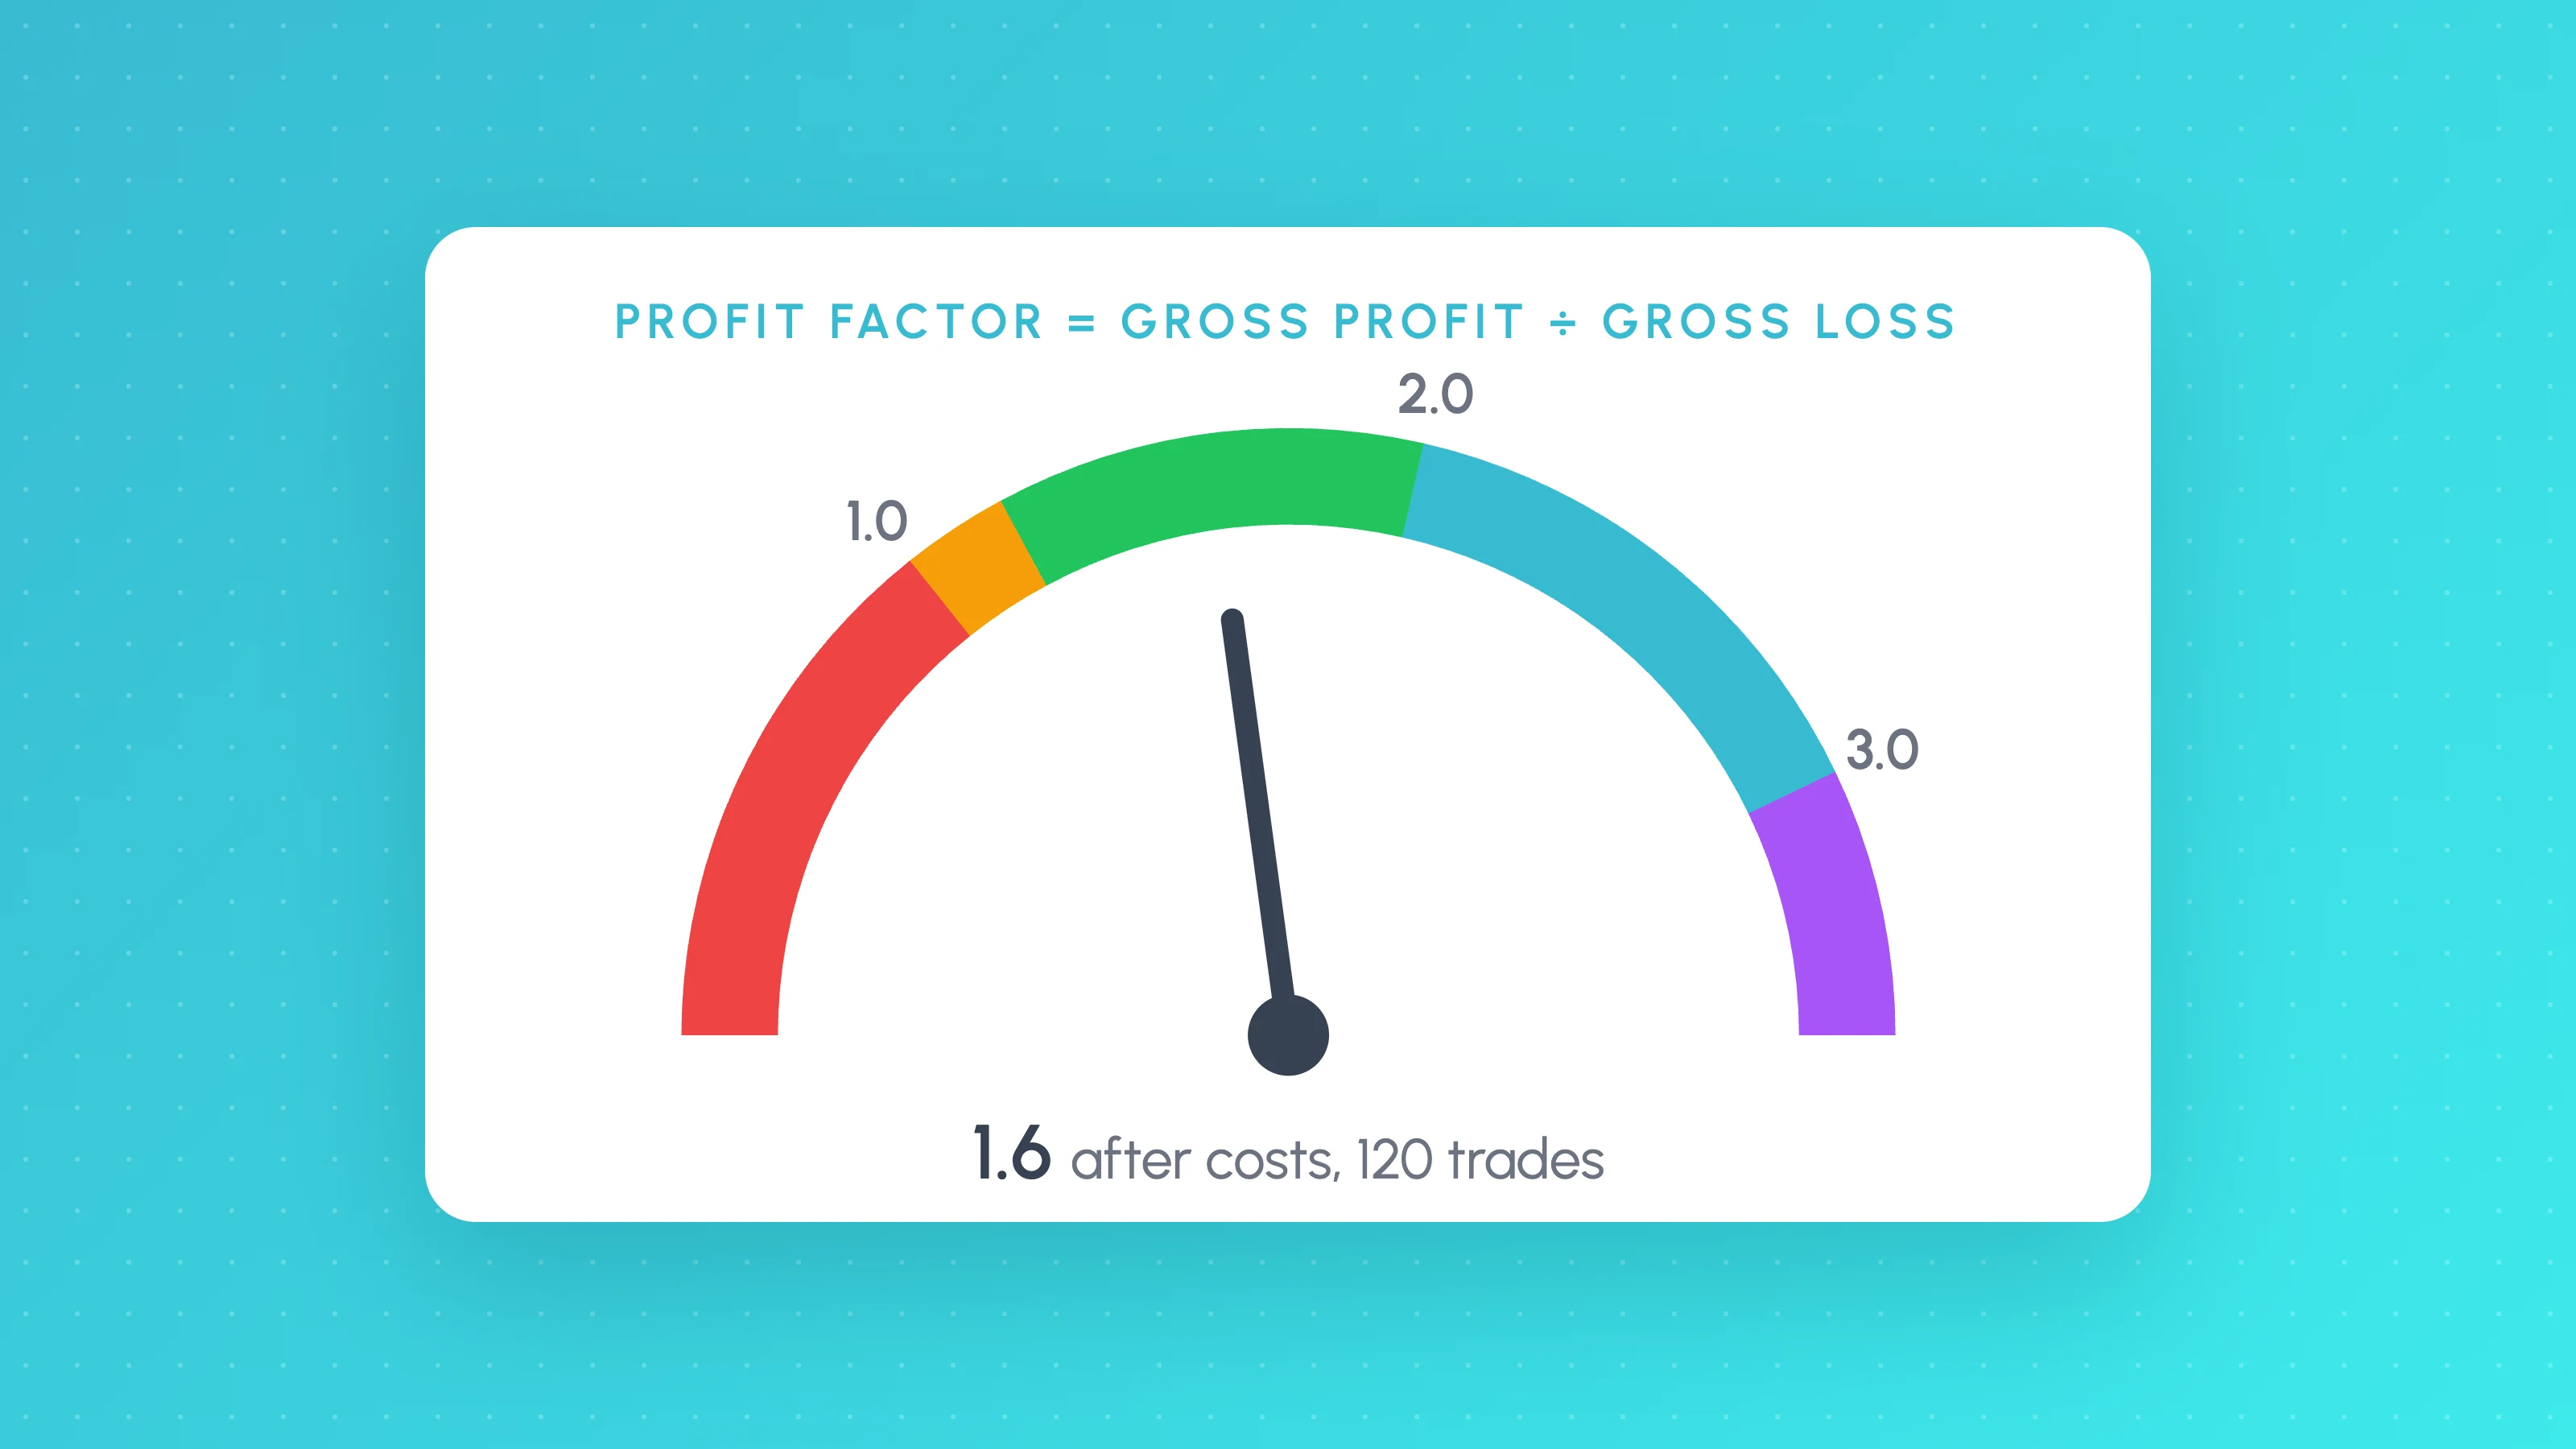
What Is a Good Profit Factor? Formula, Ranges and Red Flags
A good profit factor is usually 1.3 to 2.0 after costs on 100+ trades. See the formula, a worked example, a spreadsheet calculator and why above 3 is a warning.
 TradingView backtests
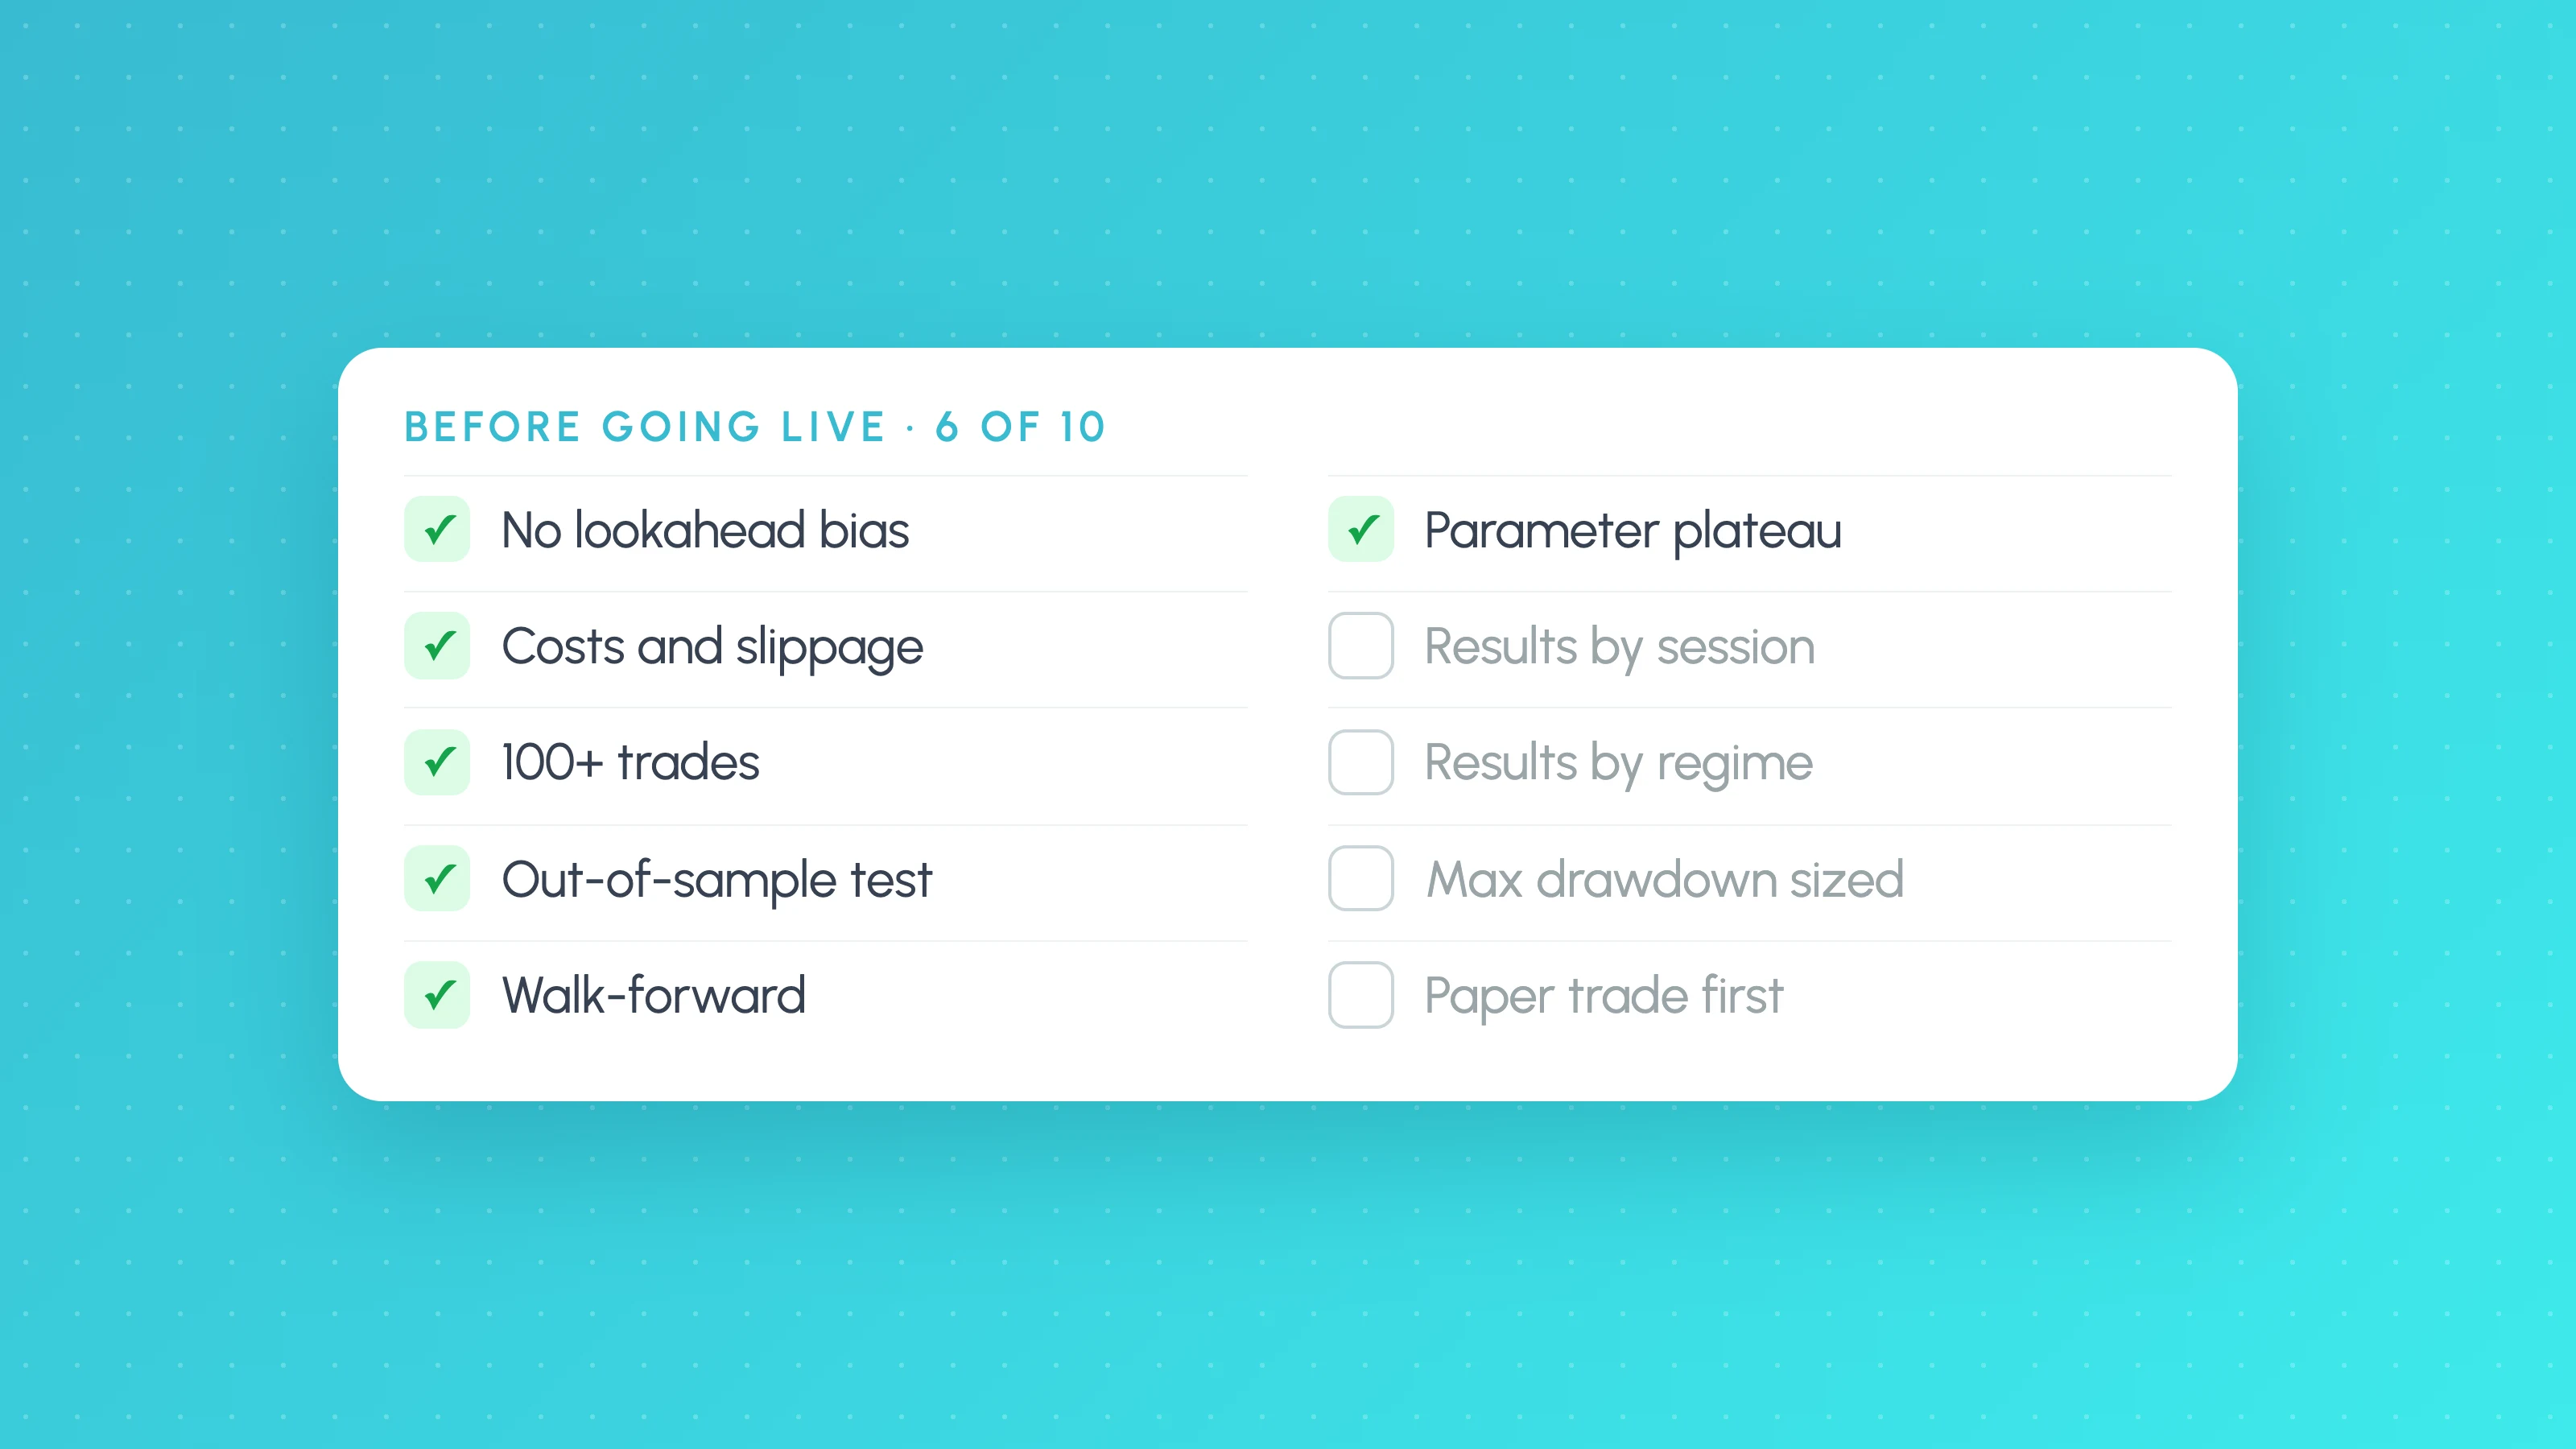
Backtest Validation Checklist: 10 Checks Before You Trade a Strategy Live
A backtest validation checklist: 10 checks to run before going live, from costs, fills and repainting to out-of-sample, Monte Carlo and forward tests.