

Out-of-Sample Testing for Traders: How Big a Hold-Out, and Why You Only Use It Once
Out of sample backtesting for traders: how big a hold-out to keep, in sample vs out of sample, why the test only works once and how multiple testing breaks it.
By Tessera Trades · Updated · 9 min read
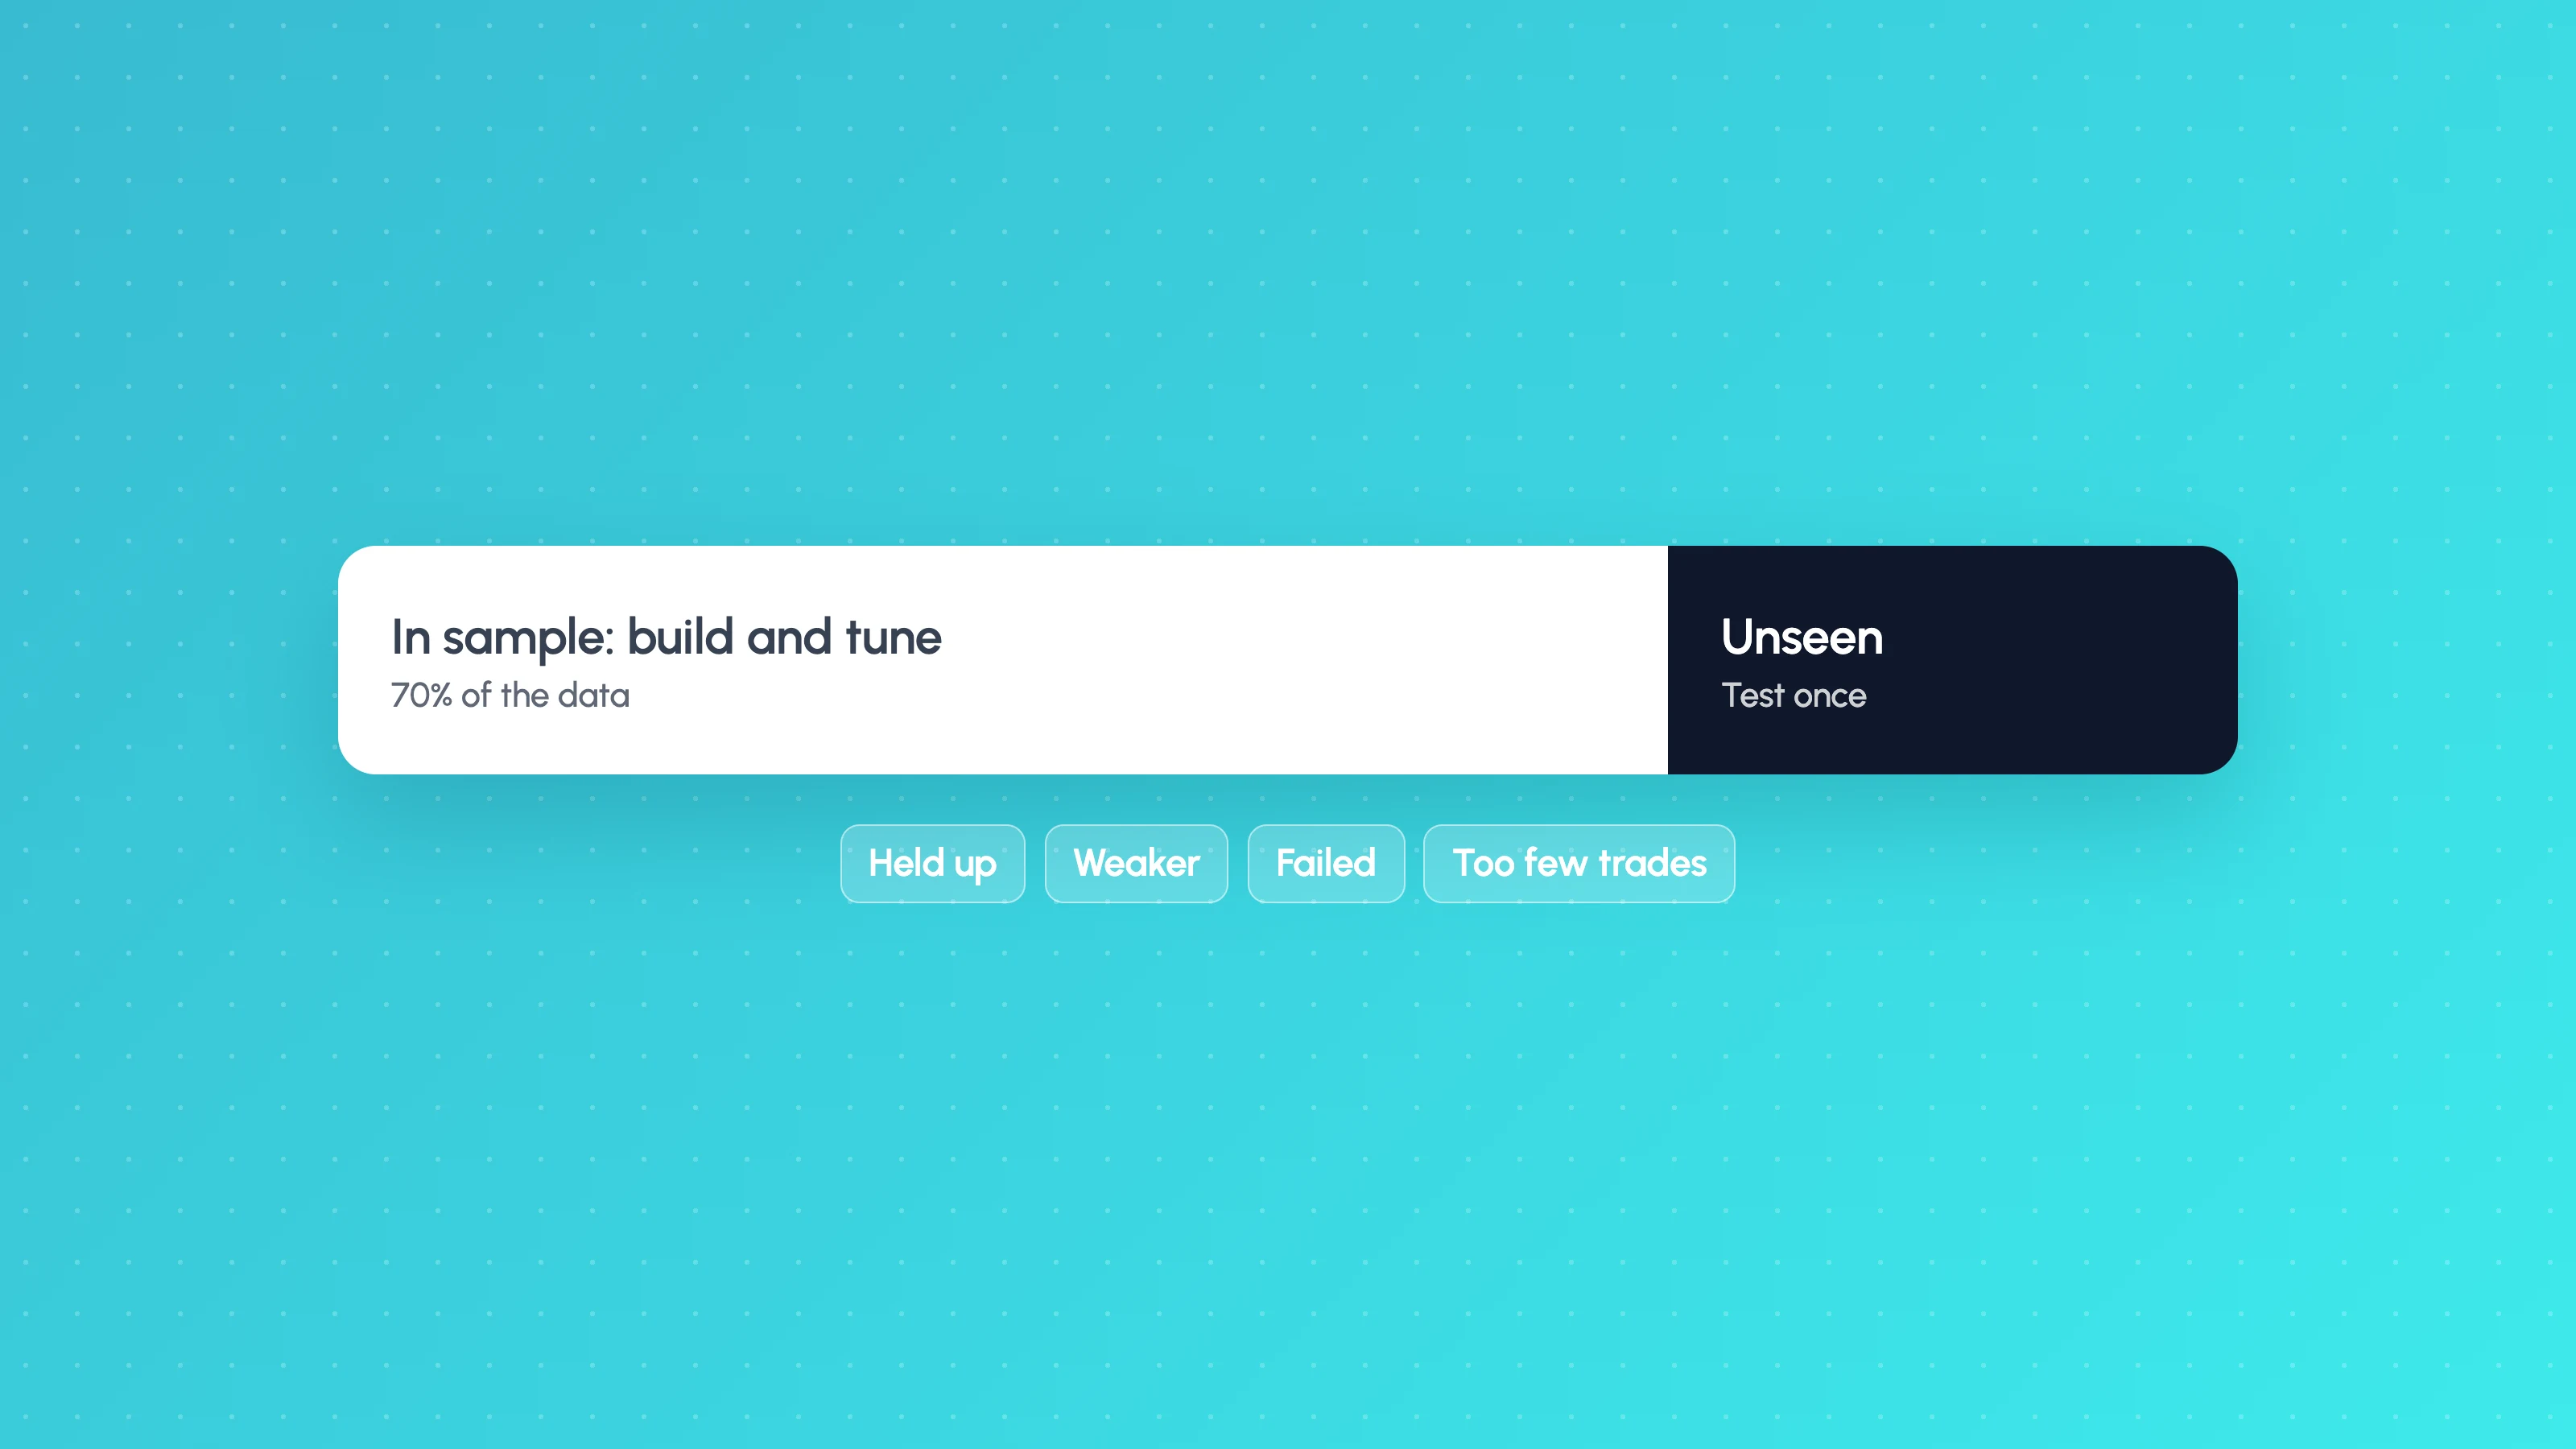
Out of sample backtesting means building a strategy on one part of your price history and then judging it, once, on a later part it never saw. Keep the most recent 20 to 30% of the data as the hold-out, but size it in trades rather than years: it needs enough trades to show a failure clearly, which usually means at least 100. The test only works the first time you look, because every change you make after seeing the hold-out turns it into data you tuned on.
Is my backtest overfit? shows how to set up a hold-out in TradingView with a date window. This guide covers the questions that come after: how big the hold-out should be, how to read a result that is neither clearly good nor clearly bad, and the multiple-testing problem that quietly ruins most hold-outs.
In sample vs out of sample
| In sample | Out of sample | |
|---|---|---|
| Also called | Development, training or optimisation period | Hold-out, test or unseen period |
| What you do there | Build, tune, add filters, try versions | Run the finished strategy once |
| What it shows | The best the rules could have done | What the rules do on data they weren't fitted to |
| Expect | Flattering results | Somewhat worse results |
TradingView's strategies documentation describes this split as a widely used way to reduce overfitting. The idea is simple. The discipline is the hard part.
Where to put the hold-out
Put it at the end. The most recent data is closest to the market you are about to trade, and it keeps time running forwards: you build on the past and test on what came after, which is how live trading works.
A hold-out in the middle of the history can be useful as a second check, but it lets information leak. If you built the strategy on 2019 to 2021 and 2024 to 2026 and tested on 2022 to 2023, your rules were shaped by the market on both sides of the test.
How big should the hold-out be?
Common splits keep 20 to 30% of the data for the hold-out. That is a starting point, but the real constraint is the number of trades the hold-out will contain, not the share of years.
Worked example (hypothetical)
A strategy on 15-minute candles has about 6.5 years of history and takes about 200 trades a year, so roughly 1,300 trades in total.
| Hold-out | Approximate period | Approximate trades |
|---|---|---|
| 20% | 1.3 years | 260 |
| 30% | 2 years | 390 |
Now take a strategy on the same data that takes 50 trades a year: about 325 trades in total, and only about 100 in a 30% hold-out. Same split, a quarter of the evidence.
What a hold-out of a given size can show
Say the in-sample average is 0.2R per trade with a standard deviation of 1.47R (a 2R target, 1R stop and 40% win rate; see backtest sample size for the arithmetic). Even if the edge is exactly unchanged, the hold-out's average will wander by luck. The standard error of the average is the standard deviation divided by the square root of the number of trades, and a rough 95% range is twice that either side.
| Hold-out trades | Standard error | Rough 95% range for the hold-out average, if nothing changed |
|---|---|---|
| 50 | 1.47 ÷ 7.07 ≈ 0.21R | -0.22R to +0.62R |
| 100 | 1.47 ÷ 10 ≈ 0.15R | -0.10R to +0.50R |
| 250 | 1.47 ÷ 15.8 ≈ 0.09R | +0.01R to +0.39R |
| 400 | 1.47 ÷ 20 ≈ 0.07R | +0.05R to +0.35R |
With 50 or 100 hold-out trades, a perfectly sound strategy can show a negative hold-out, and an overfit one can show a positive one. Only from a few hundred trades does the range exclude zero.
The practical rule: aim for at least 100 trades in the hold-out, and more if the strategy's edge is small relative to its swings. If 30% of your data doesn't give you that, you need more history, a lower timeframe or more markets, not a bigger hold-out cut from too little data.
How to read the result
Judge the hold-out by whether it is consistent with the in-sample result, not by whether it is statistically significant on its own. Four outcomes:
| Verdict | What you see | What to do |
|---|---|---|
| Held up | Positive, with at least about half the in-sample average trade | Move on to stress tests and a forward test |
| Weaker | Positive but well under half | Plan on the hold-out's edge, not the in-sample one |
| Failed | Negative with enough trades to matter | The in-sample result was mostly fit. Don't patch it; start again |
| Too few trades | Under about 30 trades | No verdict. Get more data or test other markets |
The half-the-edge threshold is a rule of thumb, not a standard. Write yours down before you run the test.
Why you can only use the hold-out once
The moment you look at the hold-out result and change anything (a setting, a filter, the stop) the hold-out has influenced the strategy. Run it again and you are testing on data you tuned on. It is now in-sample, however you label it.
This catches people in small steps. "The hold-out failed because of one bad month, so I'll add a volatility filter" feels like a fix. It is fitting the strategy to the hold-out. Do it three times and the hold-out result is as optimistic as the in-sample one, while looking independent.
What to do instead when the hold-out fails:
- Accept the verdict for this strategy.
- If you build a new idea, it needs fresh unseen data: a newer period, other markets, or a forward test on live prices.
- Keep a log of every hold-out you have looked at, so you know which data is spent.
The multiple-testing problem
The hold-out guards against fitting one strategy to history. It does not guard against choosing among many strategies using the hold-out.
Suppose you build 10 variants and run each on the hold-out, then keep the best. If no variant has a real edge, each one still has about a 5% chance of looking significant on the hold-out by luck. The chance that at least one of the 10 does:
1 - 0.95^10 ≈ 0.40About 40%. With 90 variants it is 1 - 0.95^90 ≈ 0.99, almost certain. The real figure is lower when variants are similar to each other, because their results move together, but the direction is the same: rank enough candidates on a hold-out and one will look good.
At that point the hold-out has become part of the selection, and the winner's hold-out result is biased upwards, just like an in-sample result. Halbert White's "A Reality Check for Data Snooping" (Econometrica, 2000) was written about exactly this: testing whether the best model from a search is any better than a benchmark once you account for the search. Bailey, Borwein, López de Prado and Zhu's Probability of Backtest Overfitting argues the same point for trading strategies: a single hold-out isn't reliable on its own when many configurations have been tried.
What to do about it:
- Count every variant that touched the hold-out, including ones you discarded or an AI assistant generated.
- Demand more from the winner the more variants you compared. A hold-out that would be convincing for one strategy is weak as the best of 50.
- Confirm on data the selection never saw: other markets with the same rules, and a forward test on live prices.
Walk-forward vs out of sample
A single hold-out gives you one out-of-sample period. Walk-forward analysis repeats the split through history: tune on a window, test on the next, move forward, repeat. You end up with several out-of-sample periods joined together, and you can see whether the best settings stay stable from window to window. The step-by-step method is in is my backtest overfit?.
| Single hold-out | Walk-forward | |
|---|---|---|
| Out-of-sample periods | One | Several |
| Effort | Low | High if done by hand |
| Shows parameter stability | No | Yes |
| Best for | Simple rules with few settings | Strategies you plan to re-tune over time |
Walk-forward has its own trap: if you redesign the method after seeing the walk-forward result, that whole record is now in-sample too. The use-it-once rule applies to every form of out-of-sample test.
After the hold-out: other ways to get unseen data
- First half against second half of the development data, which shows whether the edge was fading before the hold-out even started. See how to stress test a trading strategy.
- Other markets, run without re-tuning.
- A forward test on live prices, the only data that cannot have shaped the rules. How long to paper trade a strategy covers how many trades it needs.
A strategy that passes its hold-out has cleared one hurdle. It is not a forecast. Backtests are not future results, and leveraged products such as CFDs and forex carry a high risk of loss.
Out-of-sample testing in Strategy Lab
Strategy Lab holds out the last 30% of the data automatically on every backtest, on every plan including Free, and gives it a verdict of held up, weaker, failed or too few trades. Each backtest also shows:
- the first half against the second half, and the last 12 months on their own;
- a concentration check that removes the best trades, cost fragility and skipped signals;
- a multiple-testing warning, because the platform counts the searching that went into a result.
That last point matters with TES, the AI strategy coach. TES can run a parameter search (up to 2 settings and 12 combinations) and a strategy search of about 90 variants of library recipes ranked on the unseen period. Ranking on the unseen period is useful for finding candidates, but by the arithmetic above it means the top variant's unseen result is no longer a clean hold-out. Treat it as a shortlist, then confirm the pick with the other-markets test and a forward test. TES proposes each change and you confirm it.
The robustness report card adds Monte Carlo, price noise and cost stress on top. You can build the strategy with TES, the recipe composer or custom rules, without code. See pricing for plan limits, and Launchpad when a strategy is ready for a paper run on live prices.
Frequently asked questions
- What is out of sample testing in trading?
- It is running a finished strategy on a period of price data that was not used to build or tune it. Because the rules could not have been fitted to that period, the result is a fairer estimate of how the strategy behaves on new data than the in-sample backtest.
- How much data should be out of sample?
- Commonly 20 to 30% of the history, kept at the most recent end. What matters more is the trade count: aim for at least 100 trades in the hold-out, because with fewer a sound strategy and an overfit one can produce the same result by luck.
- Can I reuse my out-of-sample data?
- Not for the same strategy after you have changed it. Once you look at the result and adjust anything, the hold-out has shaped the rules and becomes in-sample. For a genuinely new test you need data the strategy has never influenced: a newer period, other markets or a forward test.
- Is walk-forward better than out of sample testing?
- Walk-forward gives several out-of-sample periods instead of one and shows whether the best settings stay stable, so it is more informative for strategies you will re-tune. It is also more work, and it is spoiled in the same way if you redesign after seeing the result.
- What if my strategy fails the out-of-sample test?
- Accept the verdict rather than adding filters until it passes, because those filters would be fitted to the hold-out. A failed hold-out usually means the in-sample result was mostly fit. Start a new idea and give it fresh unseen data.
Keep reading
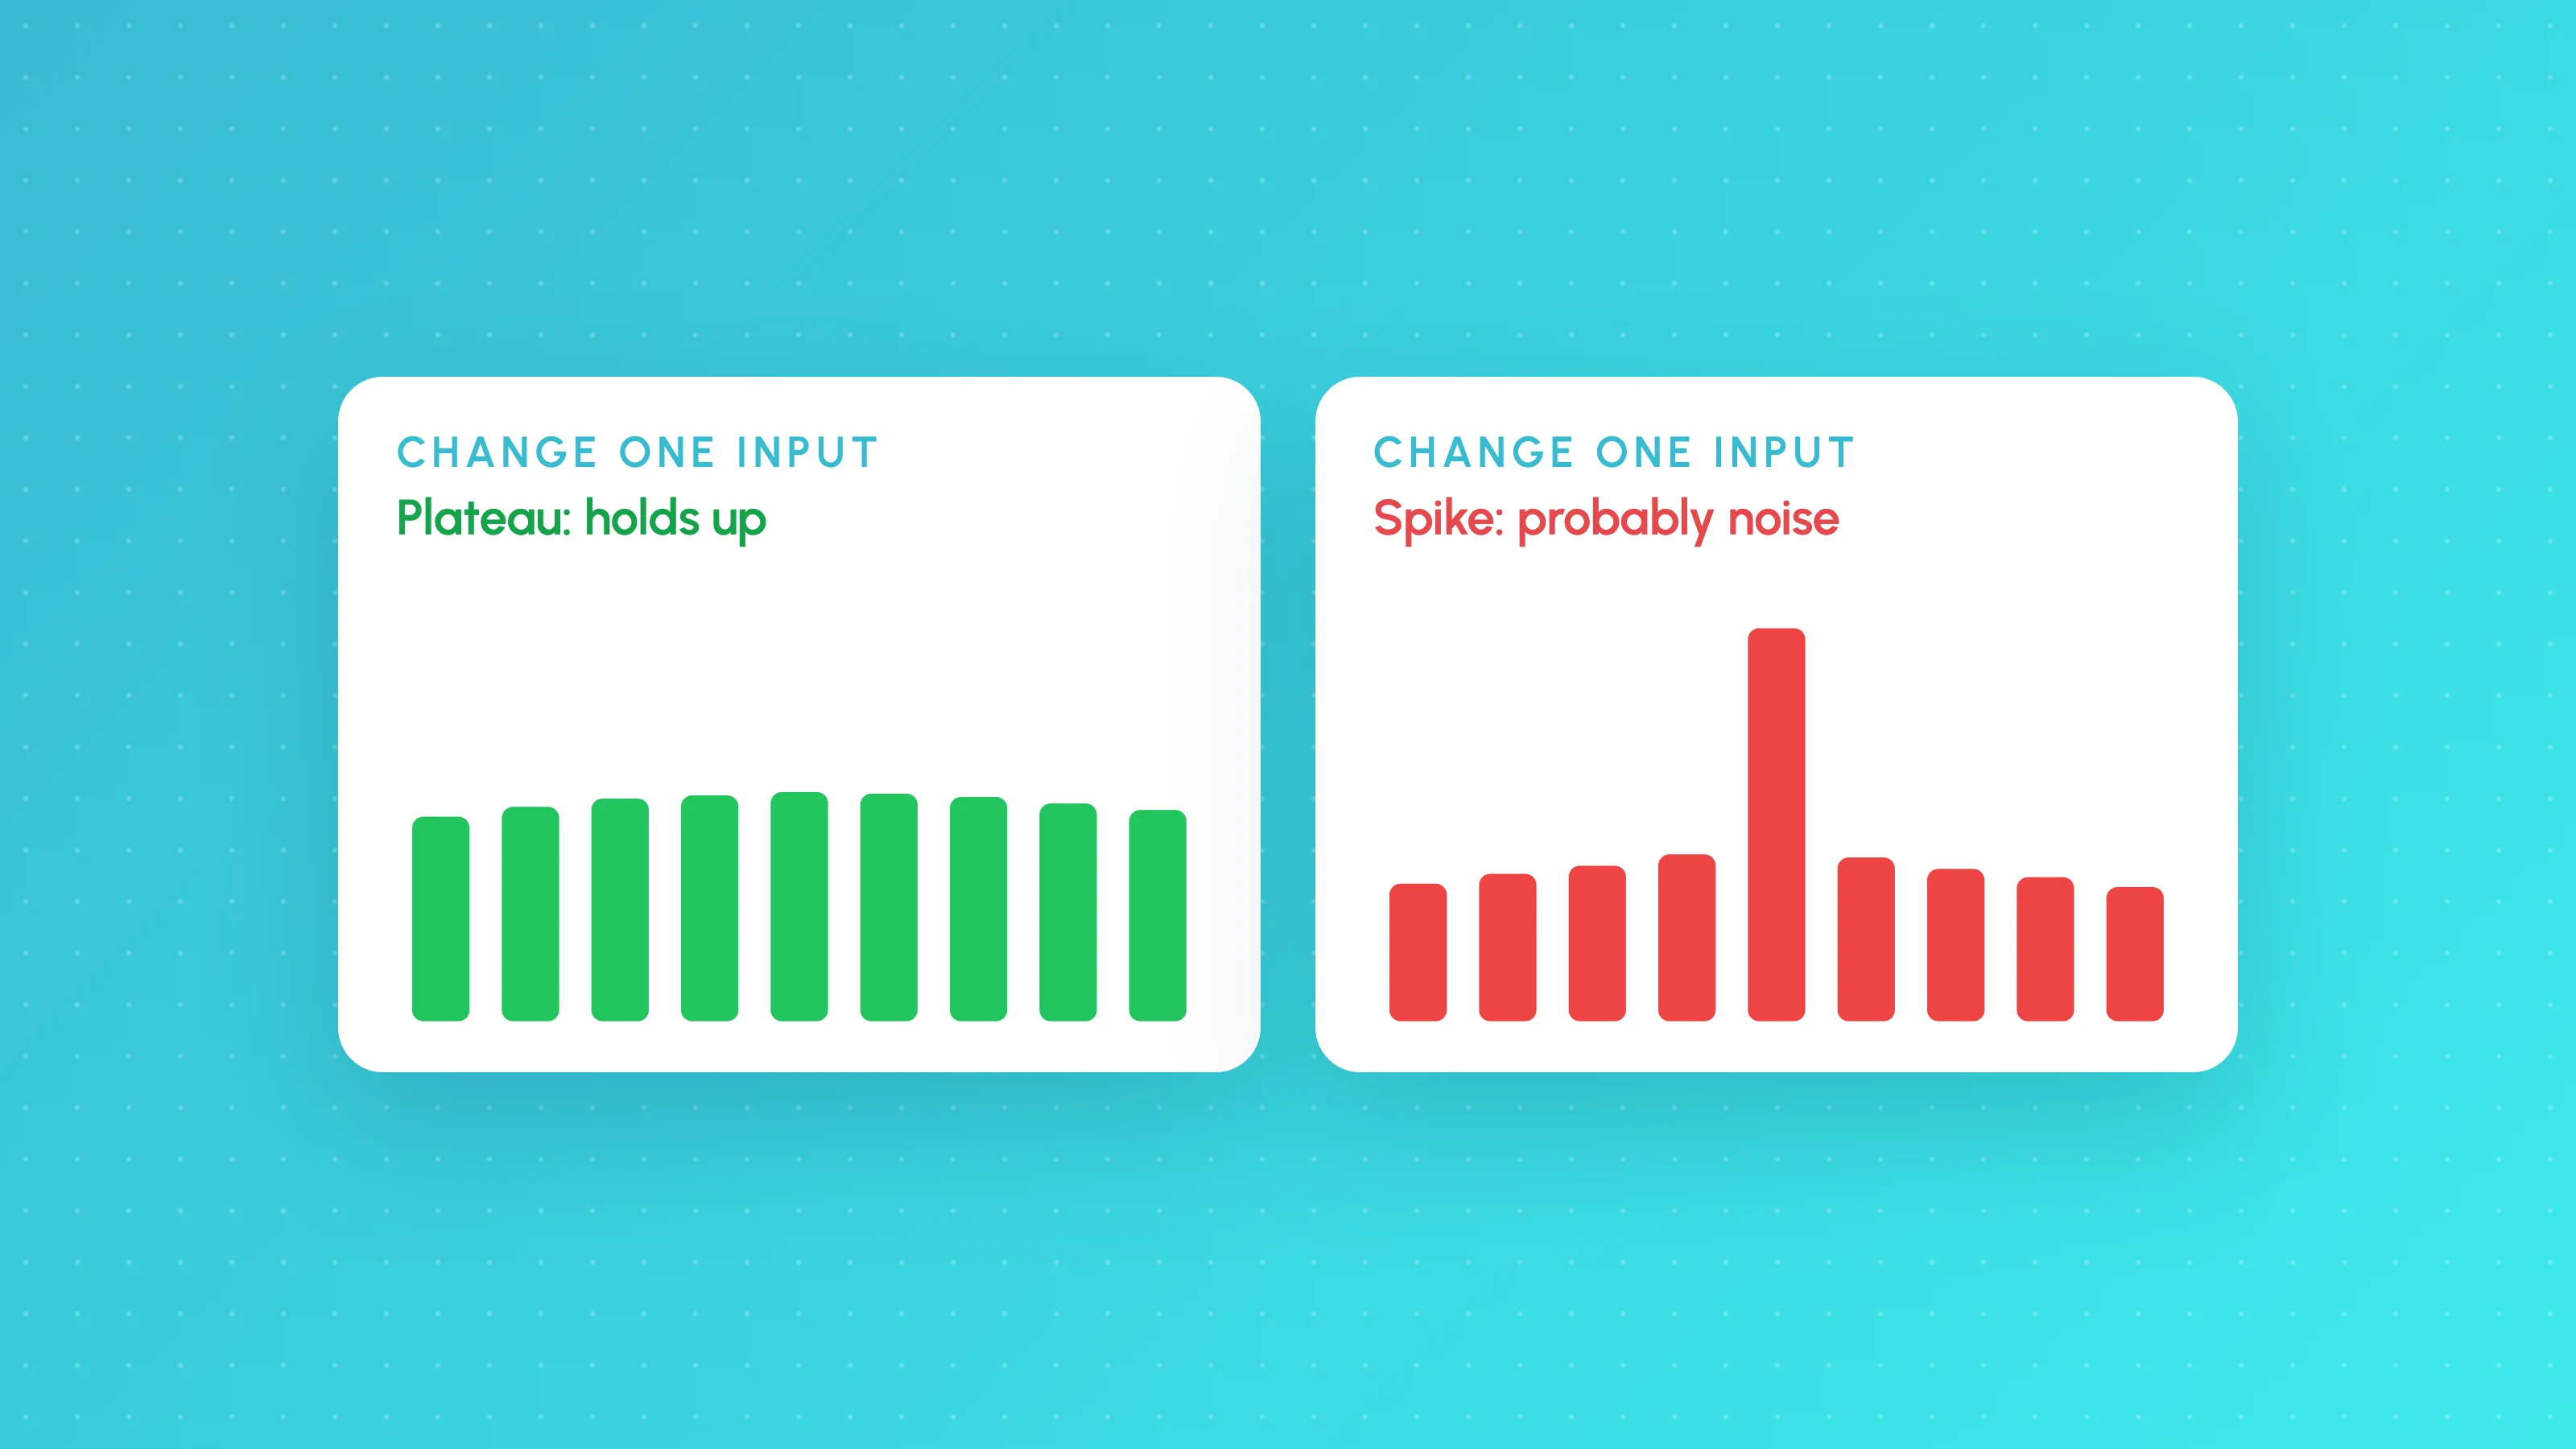 TradingView backtests
Is My Backtest Overfit? A Practical Checklist for Traders
How to tell if a backtest is overfit: too-good metrics, thin samples, fragile inputs, useless filters, out-of-sample and walk-forward tests, plus a checklist.
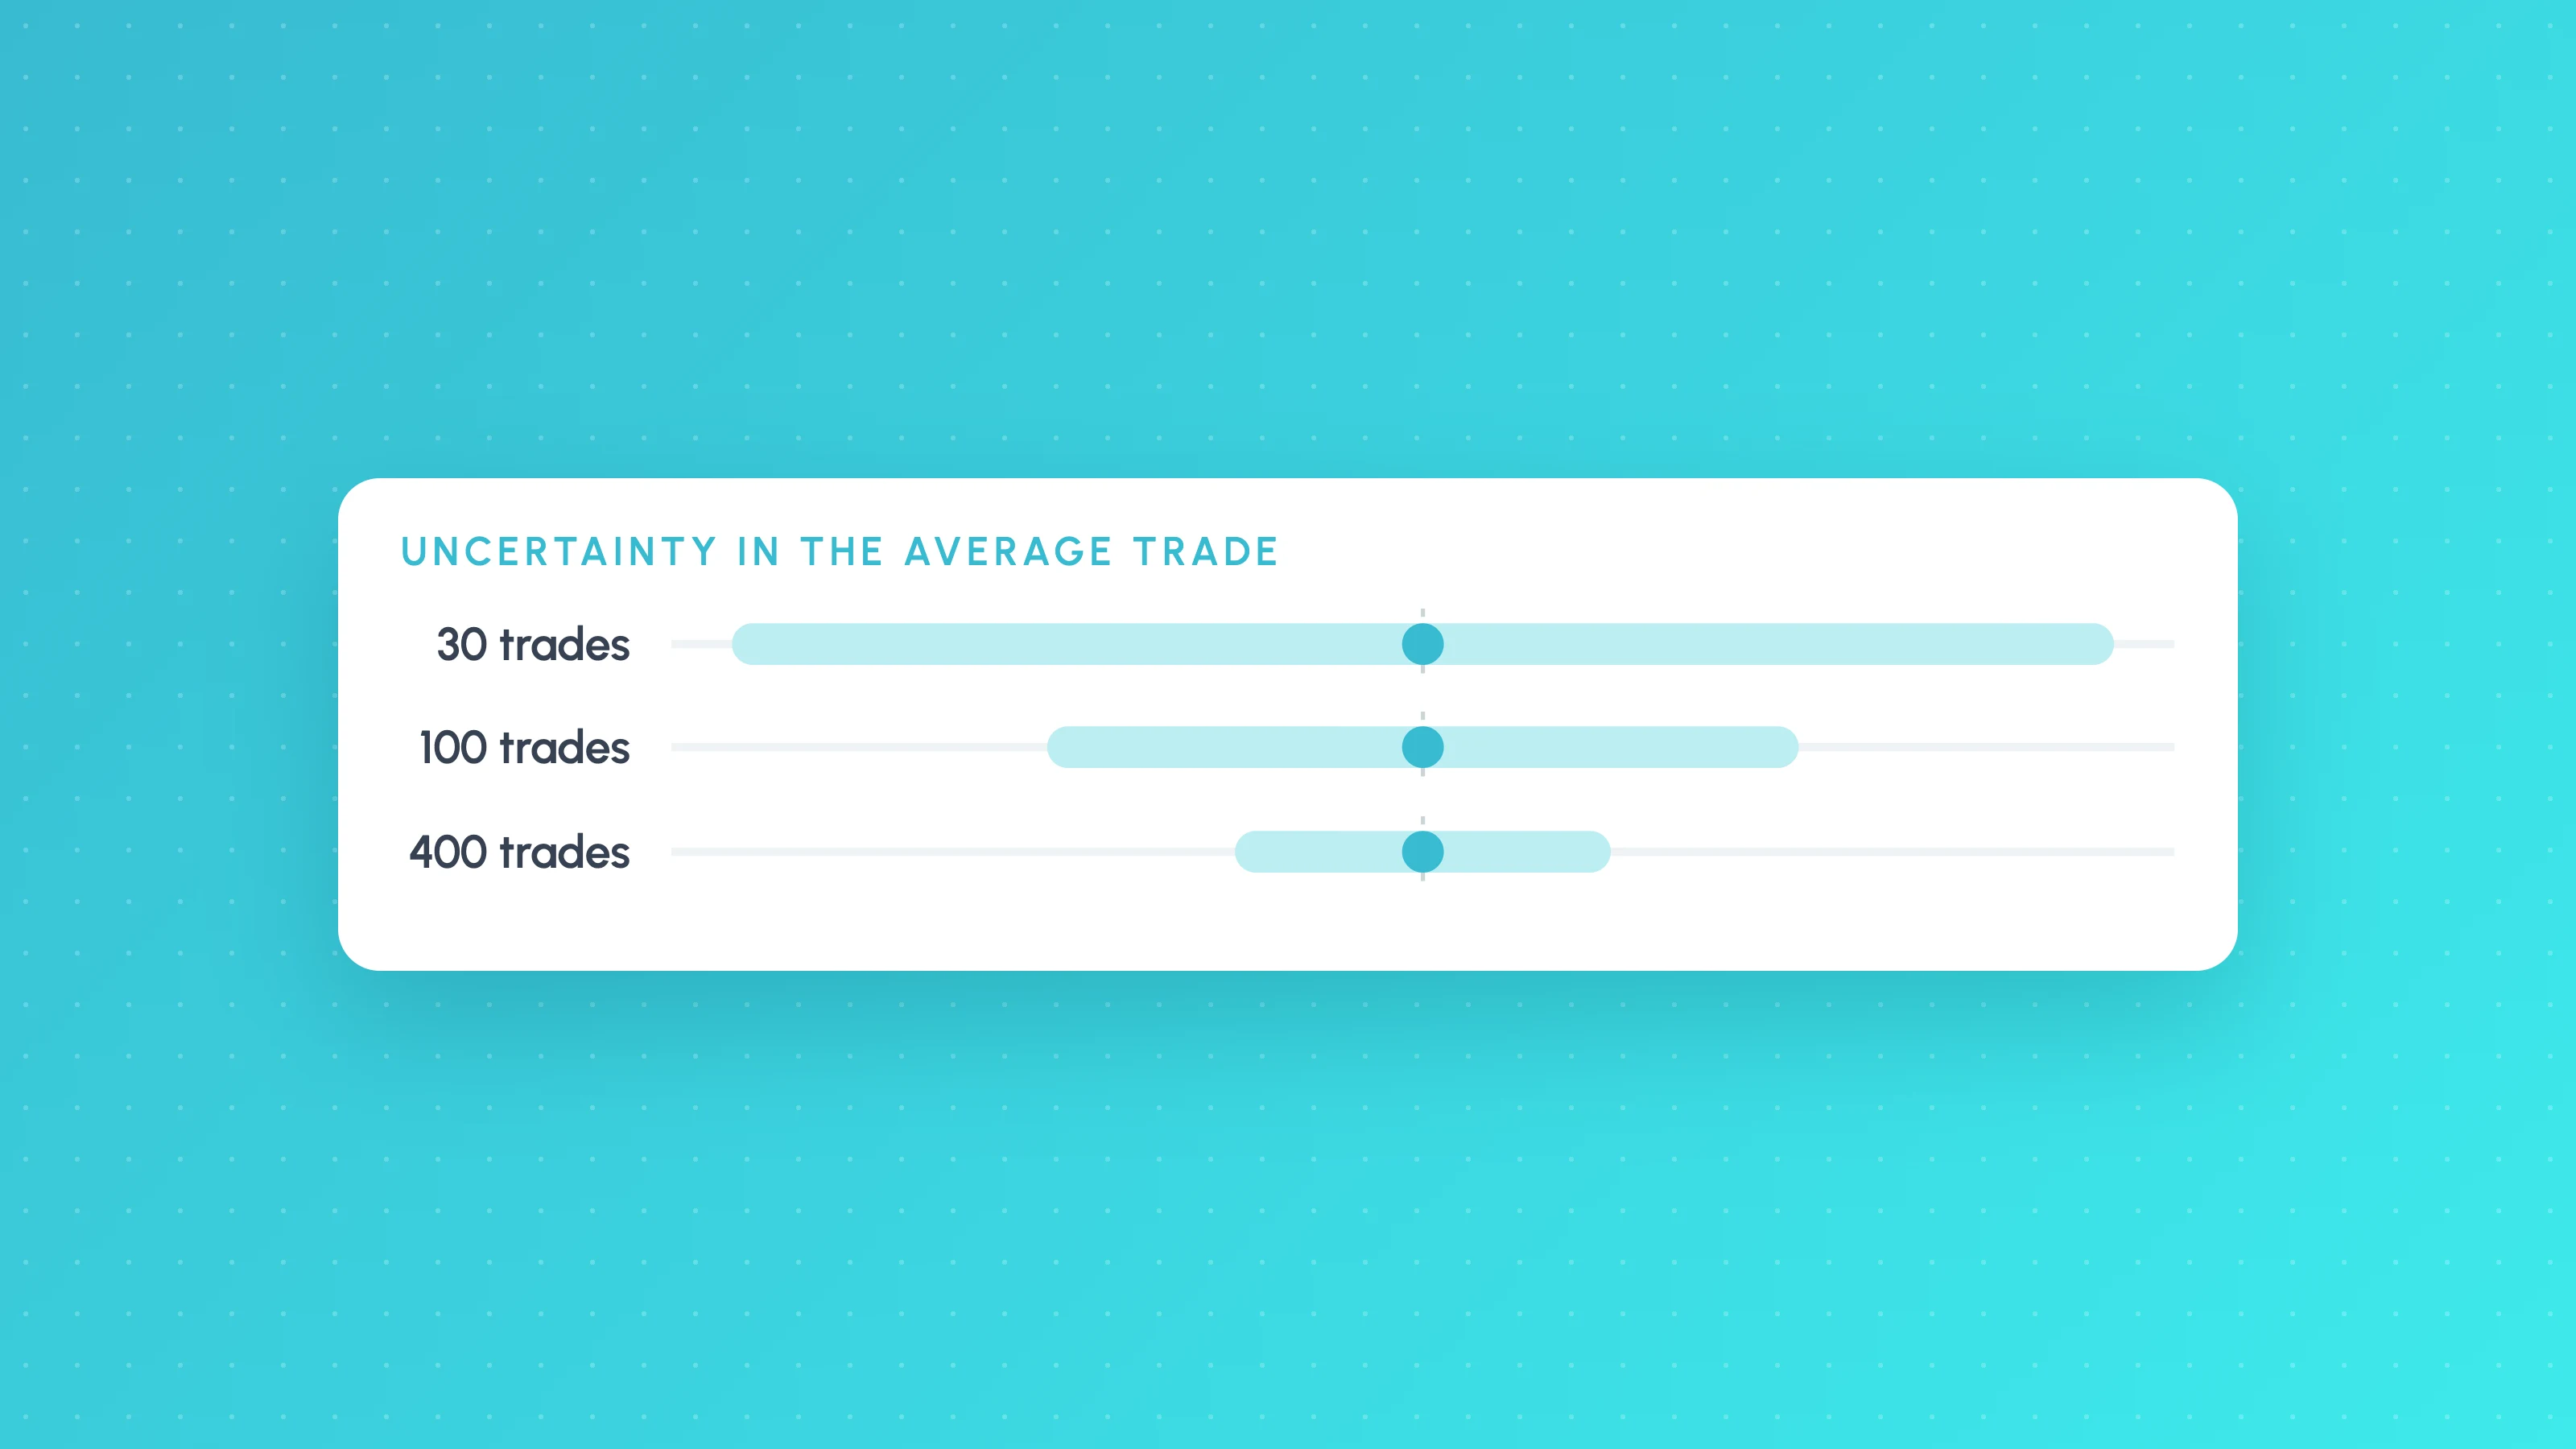 TradingView backtests
How Many Trades Do You Need for a Valid Backtest?
How many trades a backtest needs: rules of thumb, the t-statistic formula with a worked example, a table by edge size, per-bucket minimums and multiple testing.
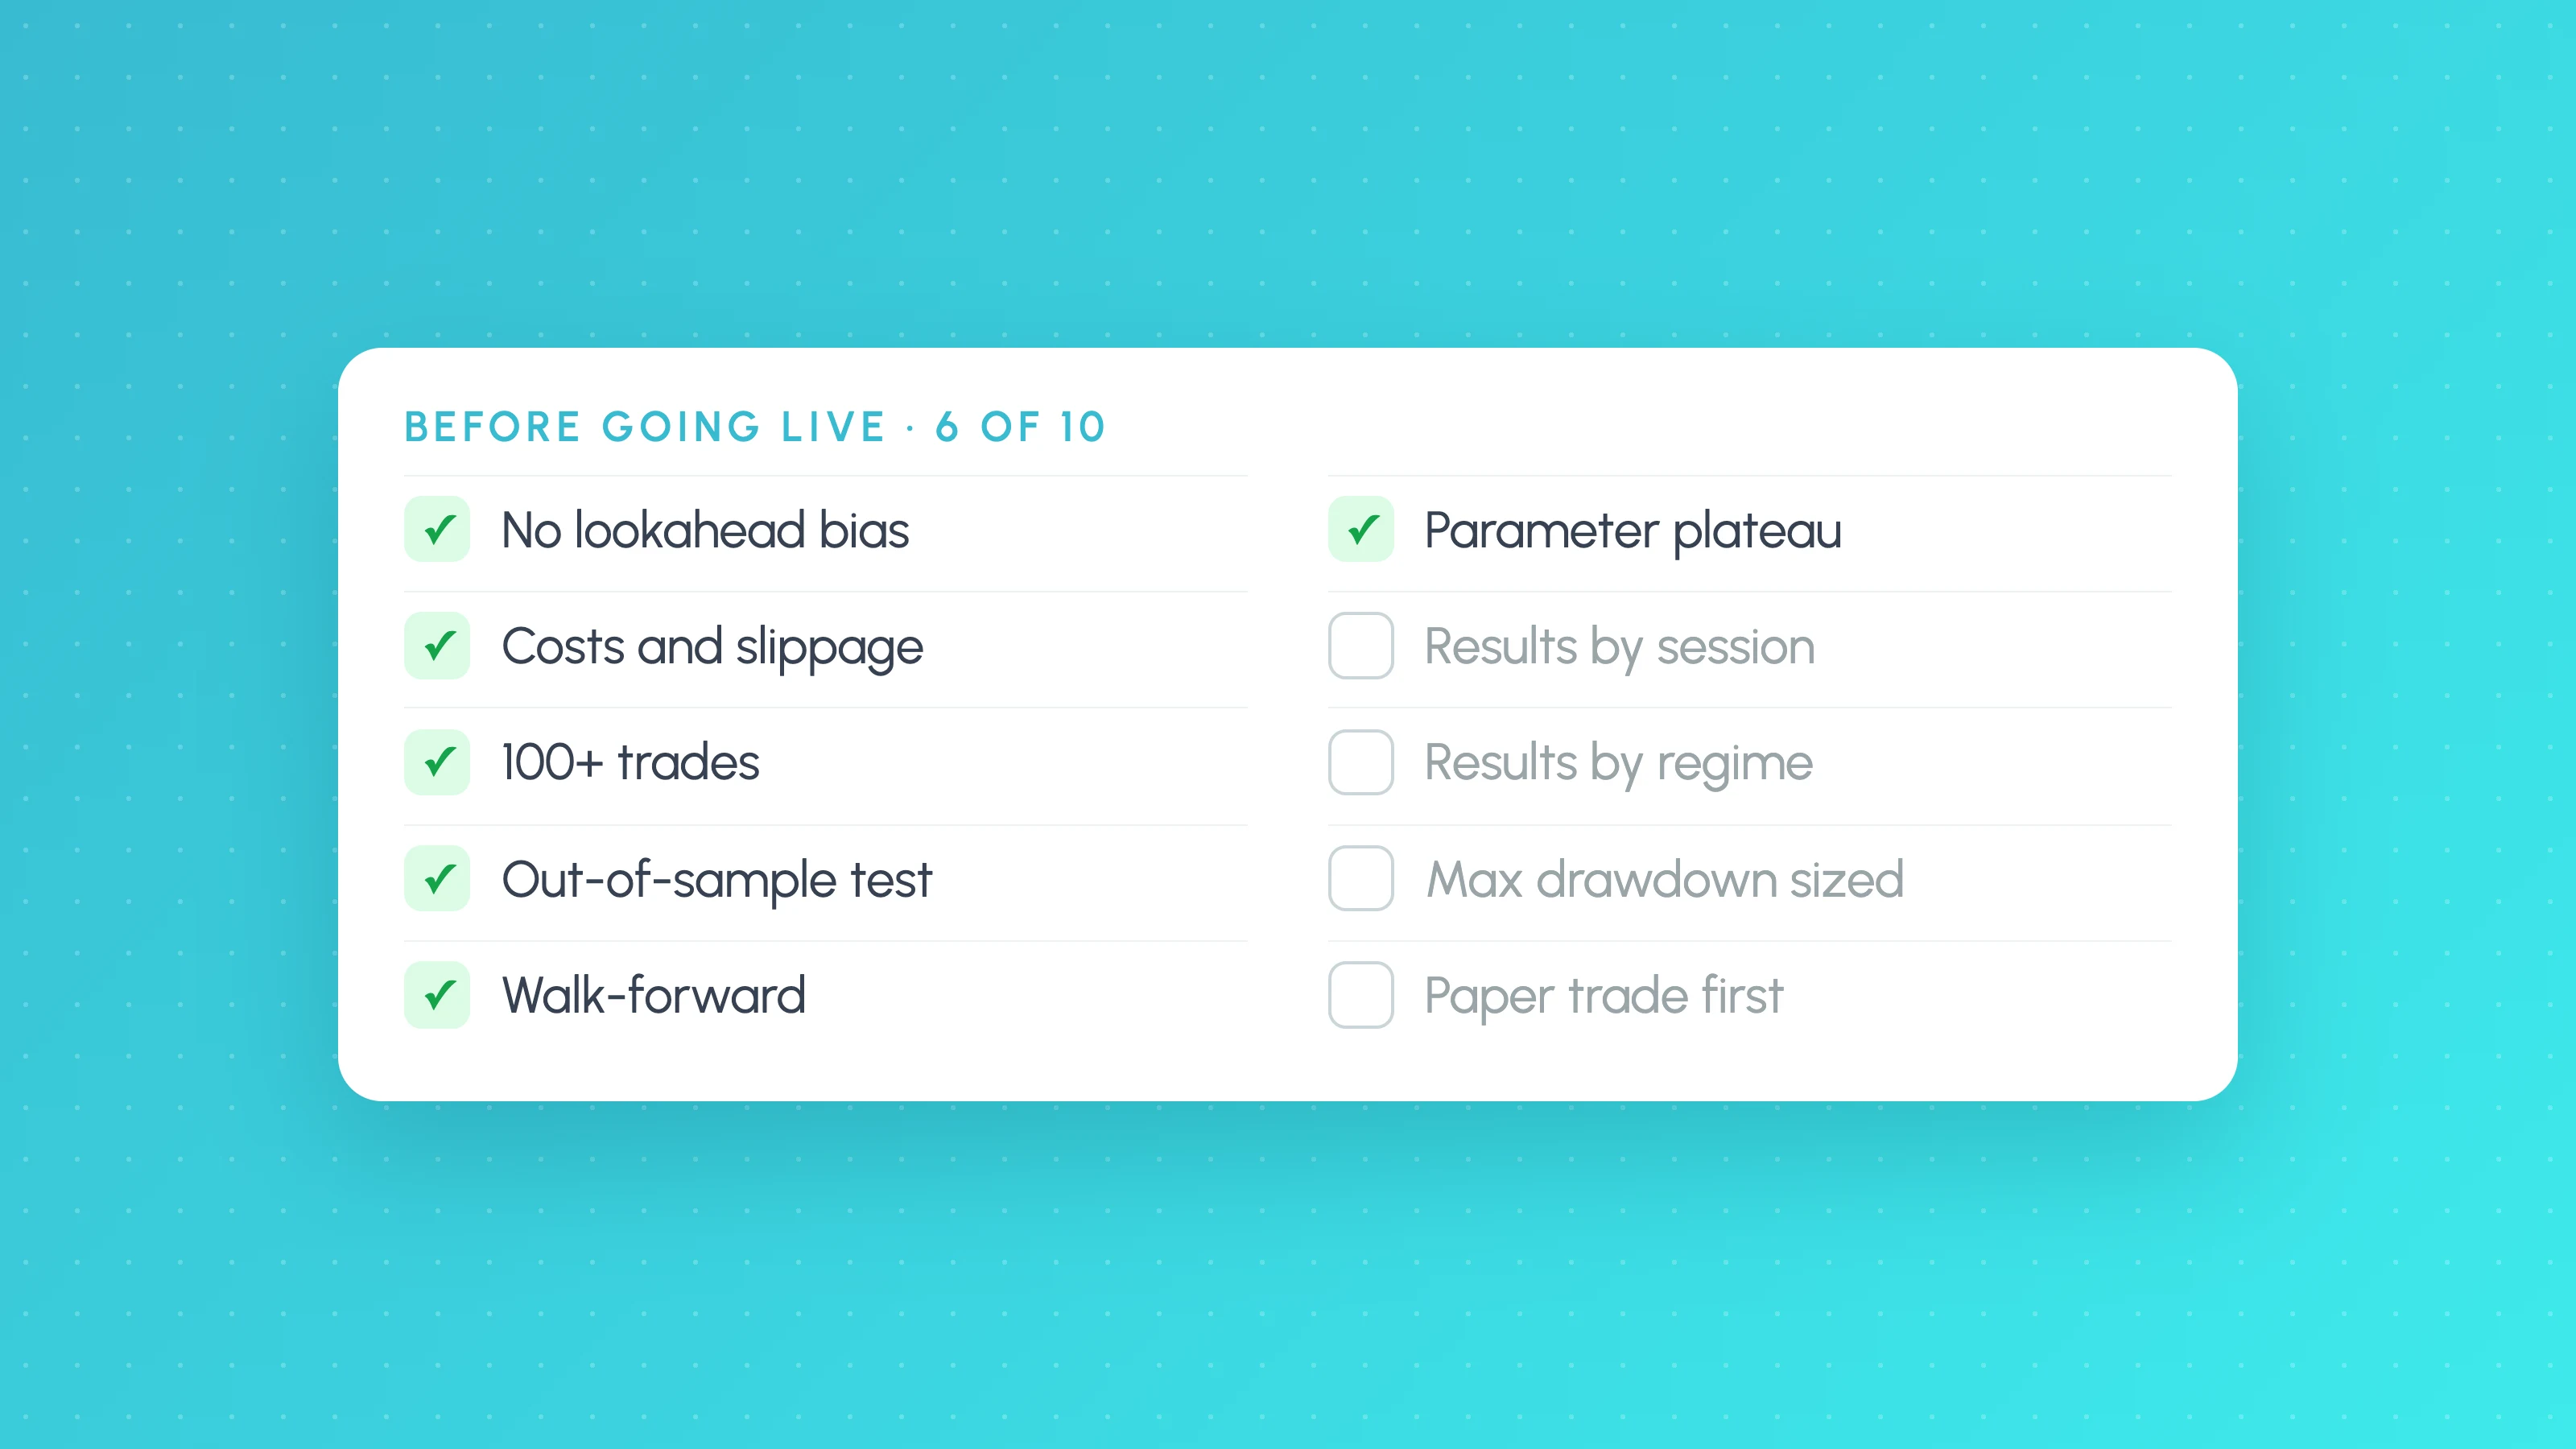 TradingView backtests
Backtest Validation Checklist: 10 Checks Before You Trade a Strategy Live
A backtest validation checklist: 10 checks to run before going live, from costs, fills and repainting to out-of-sample, Monte Carlo and forward tests.