

Monte Carlo Backtesting Explained: What It Tells You and What It Doesn't
Monte Carlo backtesting explained: trade shuffling vs block bootstrap, why to plan at half the edge, drawdown odds, minimum trade counts and what it can't show.
By Tessera Trades · Updated · 9 min read
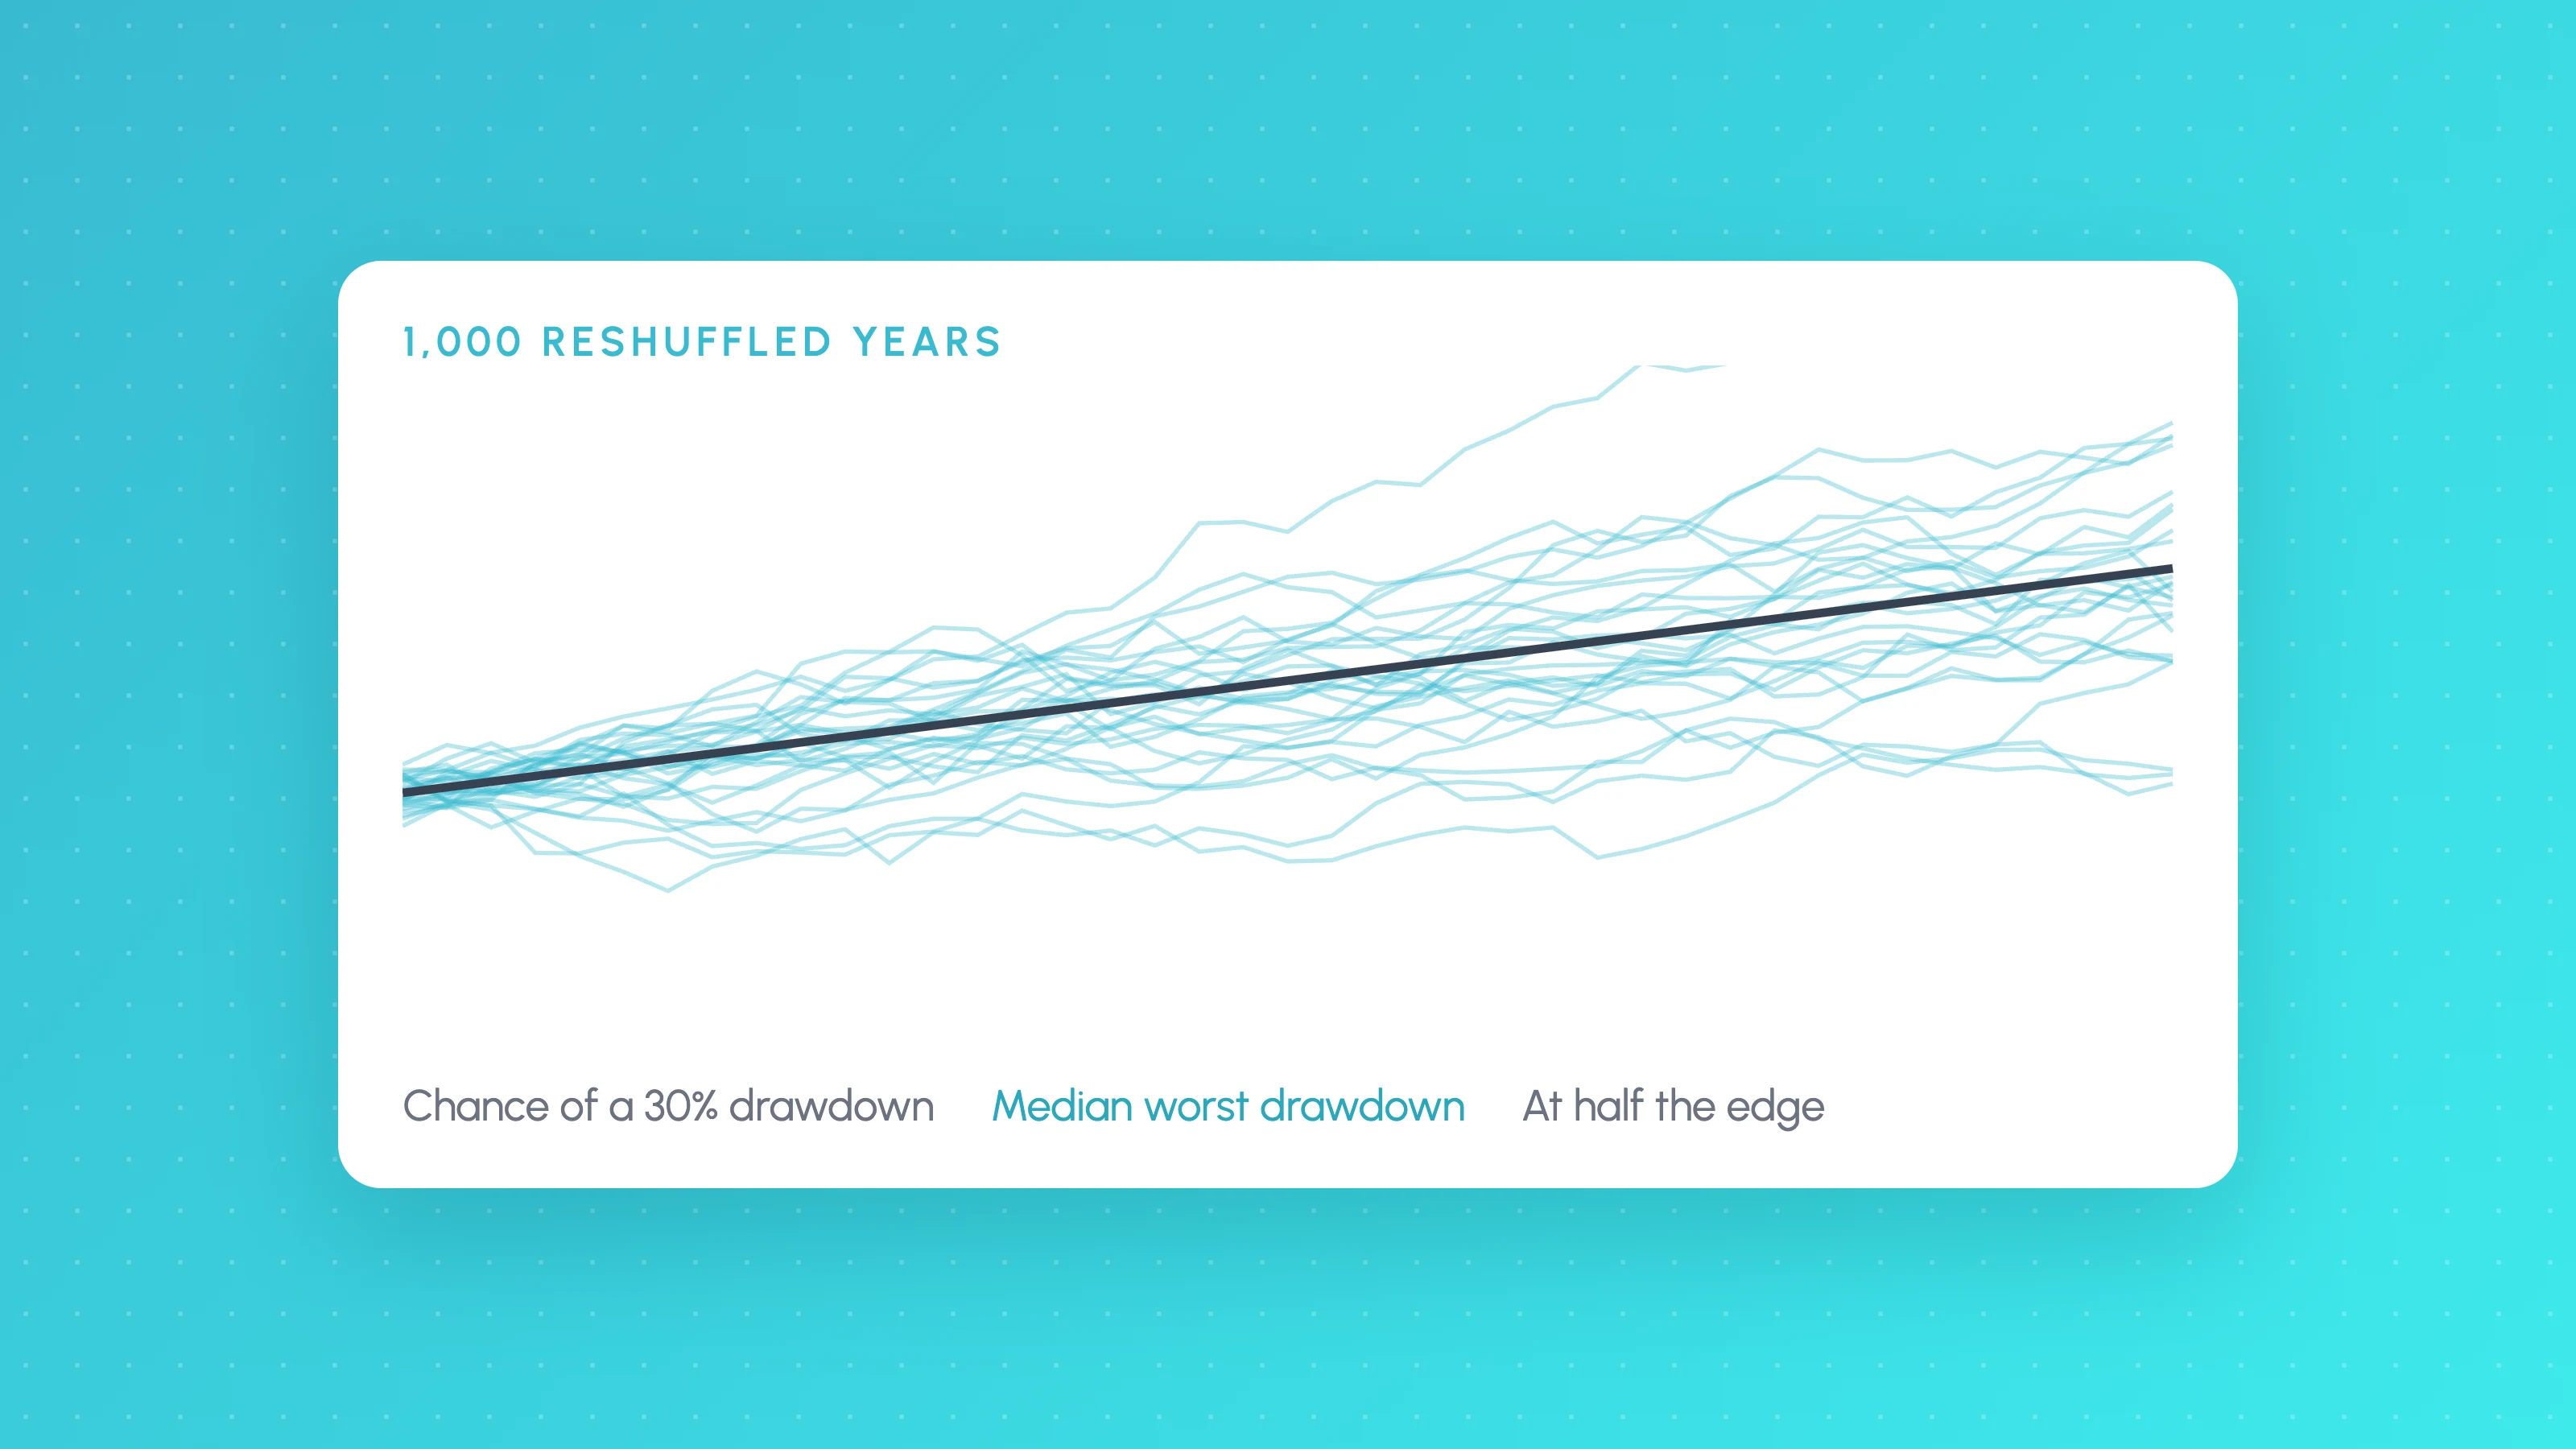
Monte Carlo backtesting takes the trades from a backtest and rebuilds them into thousands of alternative sequences, so you see a range of drawdowns, losing streaks and returns instead of the single path the backtest happened to produce. It tells you how bad things could plausibly get with the edge you measured. It does not tell you whether that edge is real, so it belongs after the tests for overfitting, not instead of them.
A backtest report shows one maximum drawdown. That number depends on the order the trades arrived in, which was partly luck. Monte Carlo answers "if the same strategy had dealt its trades in a different order, how deep could the drawdown have been?", which is the question that decides your position size.
Monte Carlo vs backtesting
| Backtest | Monte Carlo | |
|---|---|---|
| Input | Price history and rules | The backtest's trade list |
| Output | One path: one return, one drawdown | A distribution: ranges and probabilities |
| Answers | What would these rules have done? | How lucky or unlucky was that path? |
| Can detect overfitting | Partly, with out-of-sample tests | No |
| Can detect lookahead or bad fills | Only if you check | No |
The two are not alternatives. Monte Carlo is a second step that only makes sense once you trust the trade list it is built from.
Three ways to resample trades
Most Monte Carlo tools use one of three methods. They give different answers, so it is worth knowing which one you are looking at.
1. Trade shuffling (permutation)
Every trade is used exactly once, in a random order. The final profit is identical in every run; only the path changes. This shows how much of your backtest's drawdown was down to the order of trades, but it cannot show a year where the strategy had fewer winners than it did in the backtest. The backtest validation checklist includes a short Python script for this version.
2. Resampling with replacement (bootstrap)
Each simulated run draws trades at random from the list, and the same trade can be drawn more than once. Now the final result varies too, because some runs draw more of the losers. This gives a range of returns as well as drawdowns. The free Monte Carlo simulator works this way: paste your trade list, or enter a win rate and payoff, and it shows the range of final balances, drawdowns and the chance of hitting a ruin level.
3. Block bootstrap
Both methods above treat every trade as independent. Real trades are not: losses cluster in choppy or high-volatility stretches, and a strategy that loses on one Monday often loses on the next. Shuffling single trades breaks those clusters apart and spreads the losses out, which makes drawdowns look shallower than they are.
A block bootstrap resamples runs of consecutive trades instead of single ones, so a bad stretch stays together inside each block. The method comes from statistics for dependent data: Künsch introduced the moving block bootstrap in The Annals of Statistics in 1989, and Politis and Romano's stationary bootstrap (1994) uses blocks of random length.
| Method | Final profit varies? | Keeps losing streaks together? | Best for |
|---|---|---|---|
| Shuffling | No | No | Seeing how lucky the drawdown was |
| Bootstrap | Yes | No | Quick ranges of returns and drawdowns |
| Block bootstrap | Yes | Yes | Honest drawdowns for strategies with clustered results |
If your strategy's results depend on market conditions (and most do), prefer the block bootstrap for sizing decisions.
Why plan at half the edge
Monte Carlo takes the backtest's average trade as given. That average is almost always too high:
- You picked this strategy because its backtest looked best out of the versions you tried. The best of several is biased upwards, even if every version had the same true edge.
- Live costs and slippage are usually worse than the backtest's.
- Markets change, and an edge that existed in the past can shrink or disappear.
So run Monte Carlo twice: as tested, and with every trade's result reduced so the average is half the backtest's. Then size the strategy on the half-edge run. If it is still acceptable at half the edge, you have room for the backtest to be wrong.
Worked example (hypothetical)
A strategy wins 40% of trades, winners make 2R and losers lose 1R, so the average trade is 0.4 × 2 - 0.6 × 1 = 0.2R. It takes 150 trades a year and risks 1% of the starting balance per trade. Half the edge is 0.1R a trade, which for the same 2R and 1R payoff means a win rate of about 36.7%.
We simulated 20,000 years of each with independent trades, on round hypothetical figures. These numbers describe this made-up strategy only:
| As tested (0.2R) | Half the edge (0.1R) | |
|---|---|---|
| Median 12-month return | +30% | +15% |
| 5th to 95th percentile return | 0% to +60% | -15% to +45% |
| Losing years | about 4% | about 17% |
| Median worst drawdown | about 9% | about 12% |
| 95th percentile worst drawdown | about 19% | about 26% |
| Chance of a 20% drawdown | about 4% | about 14% |
| Chance of a 30% drawdown | under 1% | about 2% |
Three things stand out:
- The median return halves, but the bad cases worsen by more. The 5th percentile year goes from flat to -15%, and losing years go from about 1 in 25 to about 1 in 6.
- The 95th percentile drawdown rose from about 19% to about 26%. If your account has a 10% maximum loss, 1% risk per trade is too much for this strategy even as tested.
- The backtest's own drawdown is just one draw. If the backtest showed a 9% maximum drawdown, that was the median case, not the worst one.
Because these trades were drawn independently, a block bootstrap on a real strategy with clustered losses would show deeper drawdowns still.
How to read drawdown probabilities
Monte Carlo output usually comes as percentiles or as probabilities of crossing a level. Use them like this:
- Median worst drawdown: what a typical year looks like. Expect to see it.
- 95th percentile worst drawdown: a bad year that will still happen about one year in 20. Size so you could sit through it without abandoning the strategy.
- Chance of a 30% or 50% drawdown: a ruin check. At reasonable size these should be small at half the edge. If the chance of a 50% drawdown is meaningful, cut the size.
- Losing years: how often you would finish 12 months behind. Decide in advance how many losing years you would tolerate before stopping.
One rule of thumb, not a standard: choose your risk per trade so the half-edge 95th percentile drawdown is no more than about half of the largest drawdown you, or your account's rules, can tolerate. For a 10% limit, that means sizing until the bad case is around 5%. The risk of ruin calculator shows the same trade-off from a different angle.
The minimum trade count
Monte Carlo can only recombine the trades you give it. With 15 trades, every simulated year is built from the same 15 results, so the output looks precise while being almost entirely guesswork. Rough guidance:
| Trades in the backtest | What Monte Carlo can tell you |
|---|---|
| Under 20 | Nothing reliable. Don't run it. |
| 20 to 100 | A rough sense of path risk, at best. The edge itself is unproven. |
| 100 to 300 | Useful drawdown ranges, if the trades cover varied conditions. |
| Several hundred or more | Reasonable estimates, especially with a block bootstrap. |
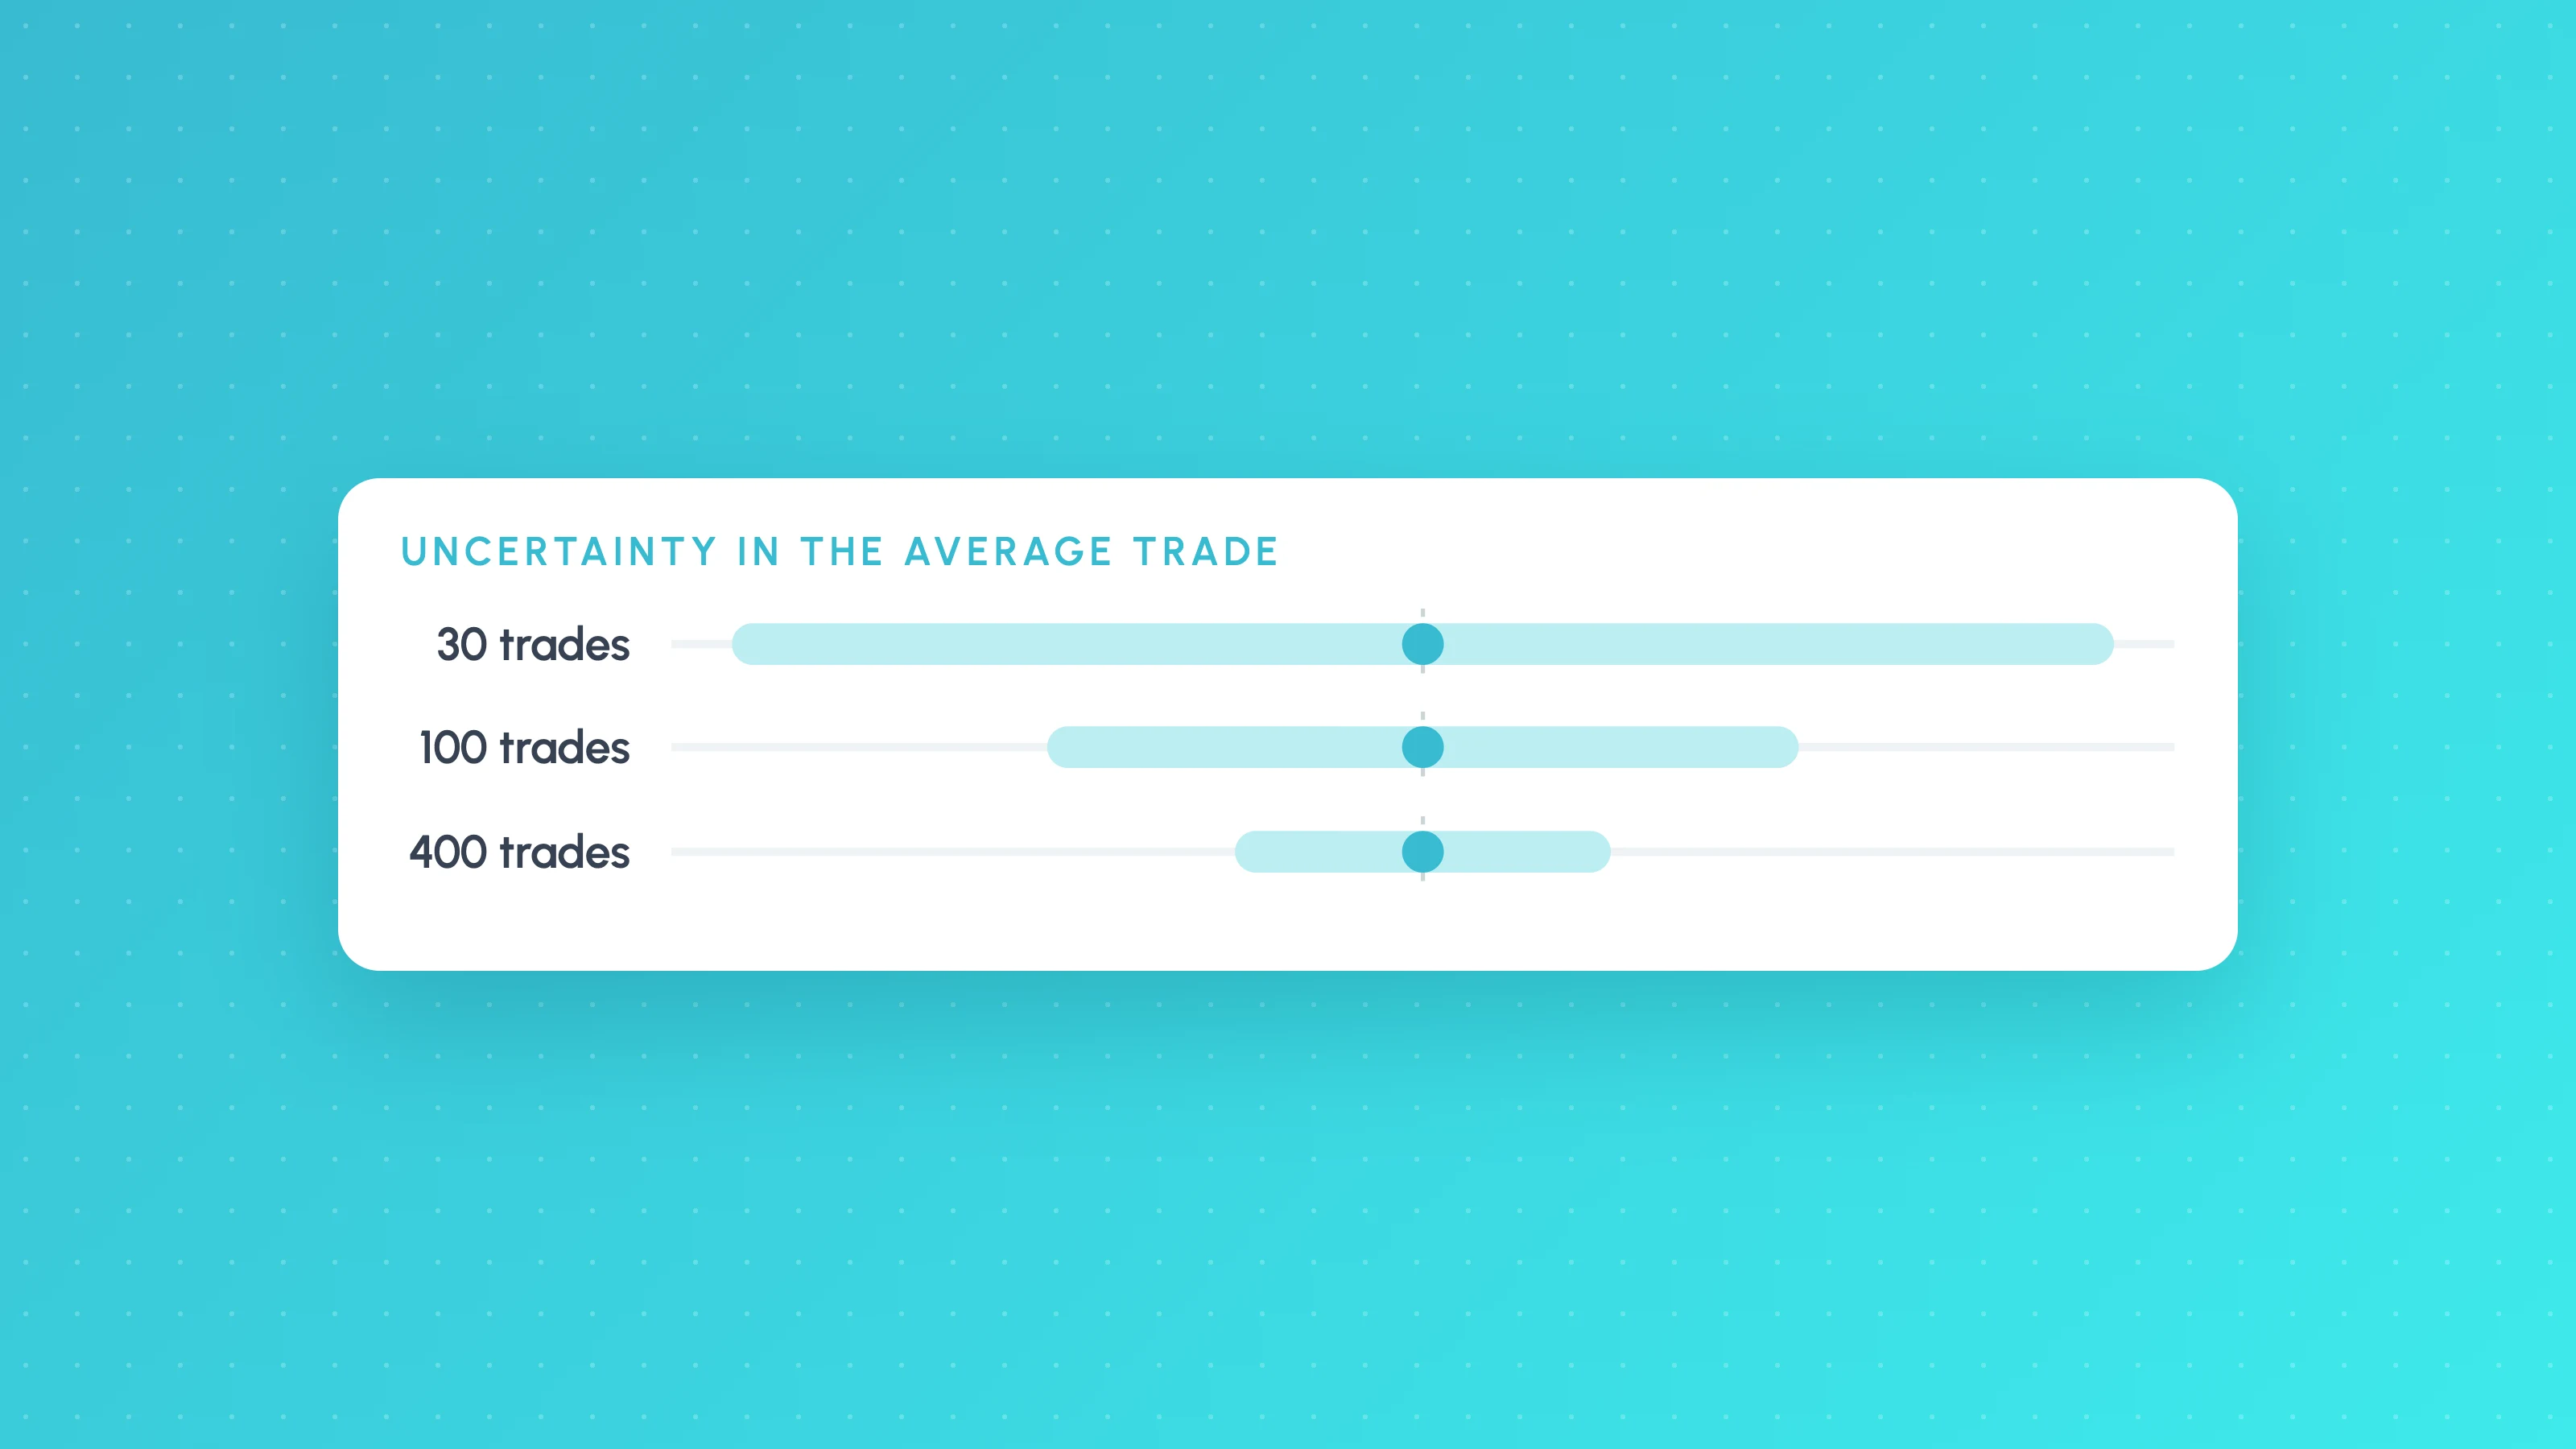
The bigger problem is that a small sample also makes the average trade unreliable, and Monte Carlo inherits that error in every run. How many trades you need for a valid backtest shows how to work out the figure from the size of your edge, and the expectancy calculator gives you the average trade in R.
What Monte Carlo doesn't tell you
- Whether the edge is real. An overfit strategy produces a clean Monte Carlo. Check out-of-sample results first: see out-of-sample testing for traders and is my backtest overfit?.
- Whether the trades could have happened. Lookahead, repainting and lucky fills pass straight through.
- What happens in a market the backtest never saw. Resampling only reuses past trades, so a new kind of loss can't appear.
- Price-level fragility. Shuffling trades says nothing about whether those trades depend on exact ticks. That needs a price noise test, covered in how to stress test a trading strategy.
Monte Carlo is a sizing tool. It reduces one source of false confidence, a lucky trade order, and nothing more. Past results, simulated or not, are not future results, and leveraged CFDs and forex can lose money quickly.
Monte Carlo in Strategy Lab
Strategy Lab runs Monte Carlo automatically as part of the robustness report card on every backtest, on every plan including Free:
- 1,000 simulated years by block bootstrap, so losing streaks stay together.
- Run as tested and at half the edge, side by side.
- The chance of a 30% or 50% drawdown, the median worst drawdown, 12-month return bands from the 5th to the 95th percentile, and losing years.
- It needs 20 or more trades, and the report card also shows years positive, reliance on the top 1% of trades and losing streaks.
Alongside it you get the unseen-period verdict, the price noise test, cost stress at half and double, and the other-markets test, so the Monte Carlo result sits next to the checks that say whether the edge is worth sizing at all. For a prop firm account, the prop firm challenge simulator replays the trades through the account's daily and maximum loss rules. If your trades come from another platform, the free Monte Carlo simulator runs a bootstrap on any pasted trade list.
Frequently asked questions
- What is Monte Carlo simulation in trading?
- It is a way of testing a strategy's risk by rebuilding its trades into thousands of random sequences. Each sequence produces its own drawdown and return, so you get a range of outcomes and probabilities instead of the single path from the backtest.
- Is Monte Carlo better than backtesting?
- No, it does a different job. A backtest produces the trades; Monte Carlo shows how much the result depended on their order and draws. Monte Carlo on a flawed or overfit backtest just gives a confident range for a strategy that doesn't work.
- What is a block bootstrap in trading?
- A block bootstrap resamples runs of consecutive trades rather than single trades. That keeps clusters of losses together, so the simulated drawdowns are closer to what a strategy with streaky results actually experiences. Shuffling single trades tends to understate drawdowns.
- How many trades do you need for a Monte Carlo simulation?
- At least 20 to run one at all, and 100 or more before the drawdown ranges mean much. With fewer trades, the simulation keeps recombining the same handful of results and the average trade it is built on is itself unreliable.
- Why test a strategy at half its backtested edge?
- Because the backtest's average trade is usually optimistic: it is the best of the versions you tried, and live costs tend to be higher. If the strategy's drawdowns and losing years are still acceptable at half the edge, there is room for the backtest to be wrong.
Keep reading
 TradingView backtests
How Many Trades Do You Need for a Valid Backtest?
How many trades a backtest needs: rules of thumb, the t-statistic formula with a worked example, a table by edge size, per-bucket minimums and multiple testing.
 TradingView backtests
Backtest Validation Checklist: 10 Checks Before You Trade a Strategy Live
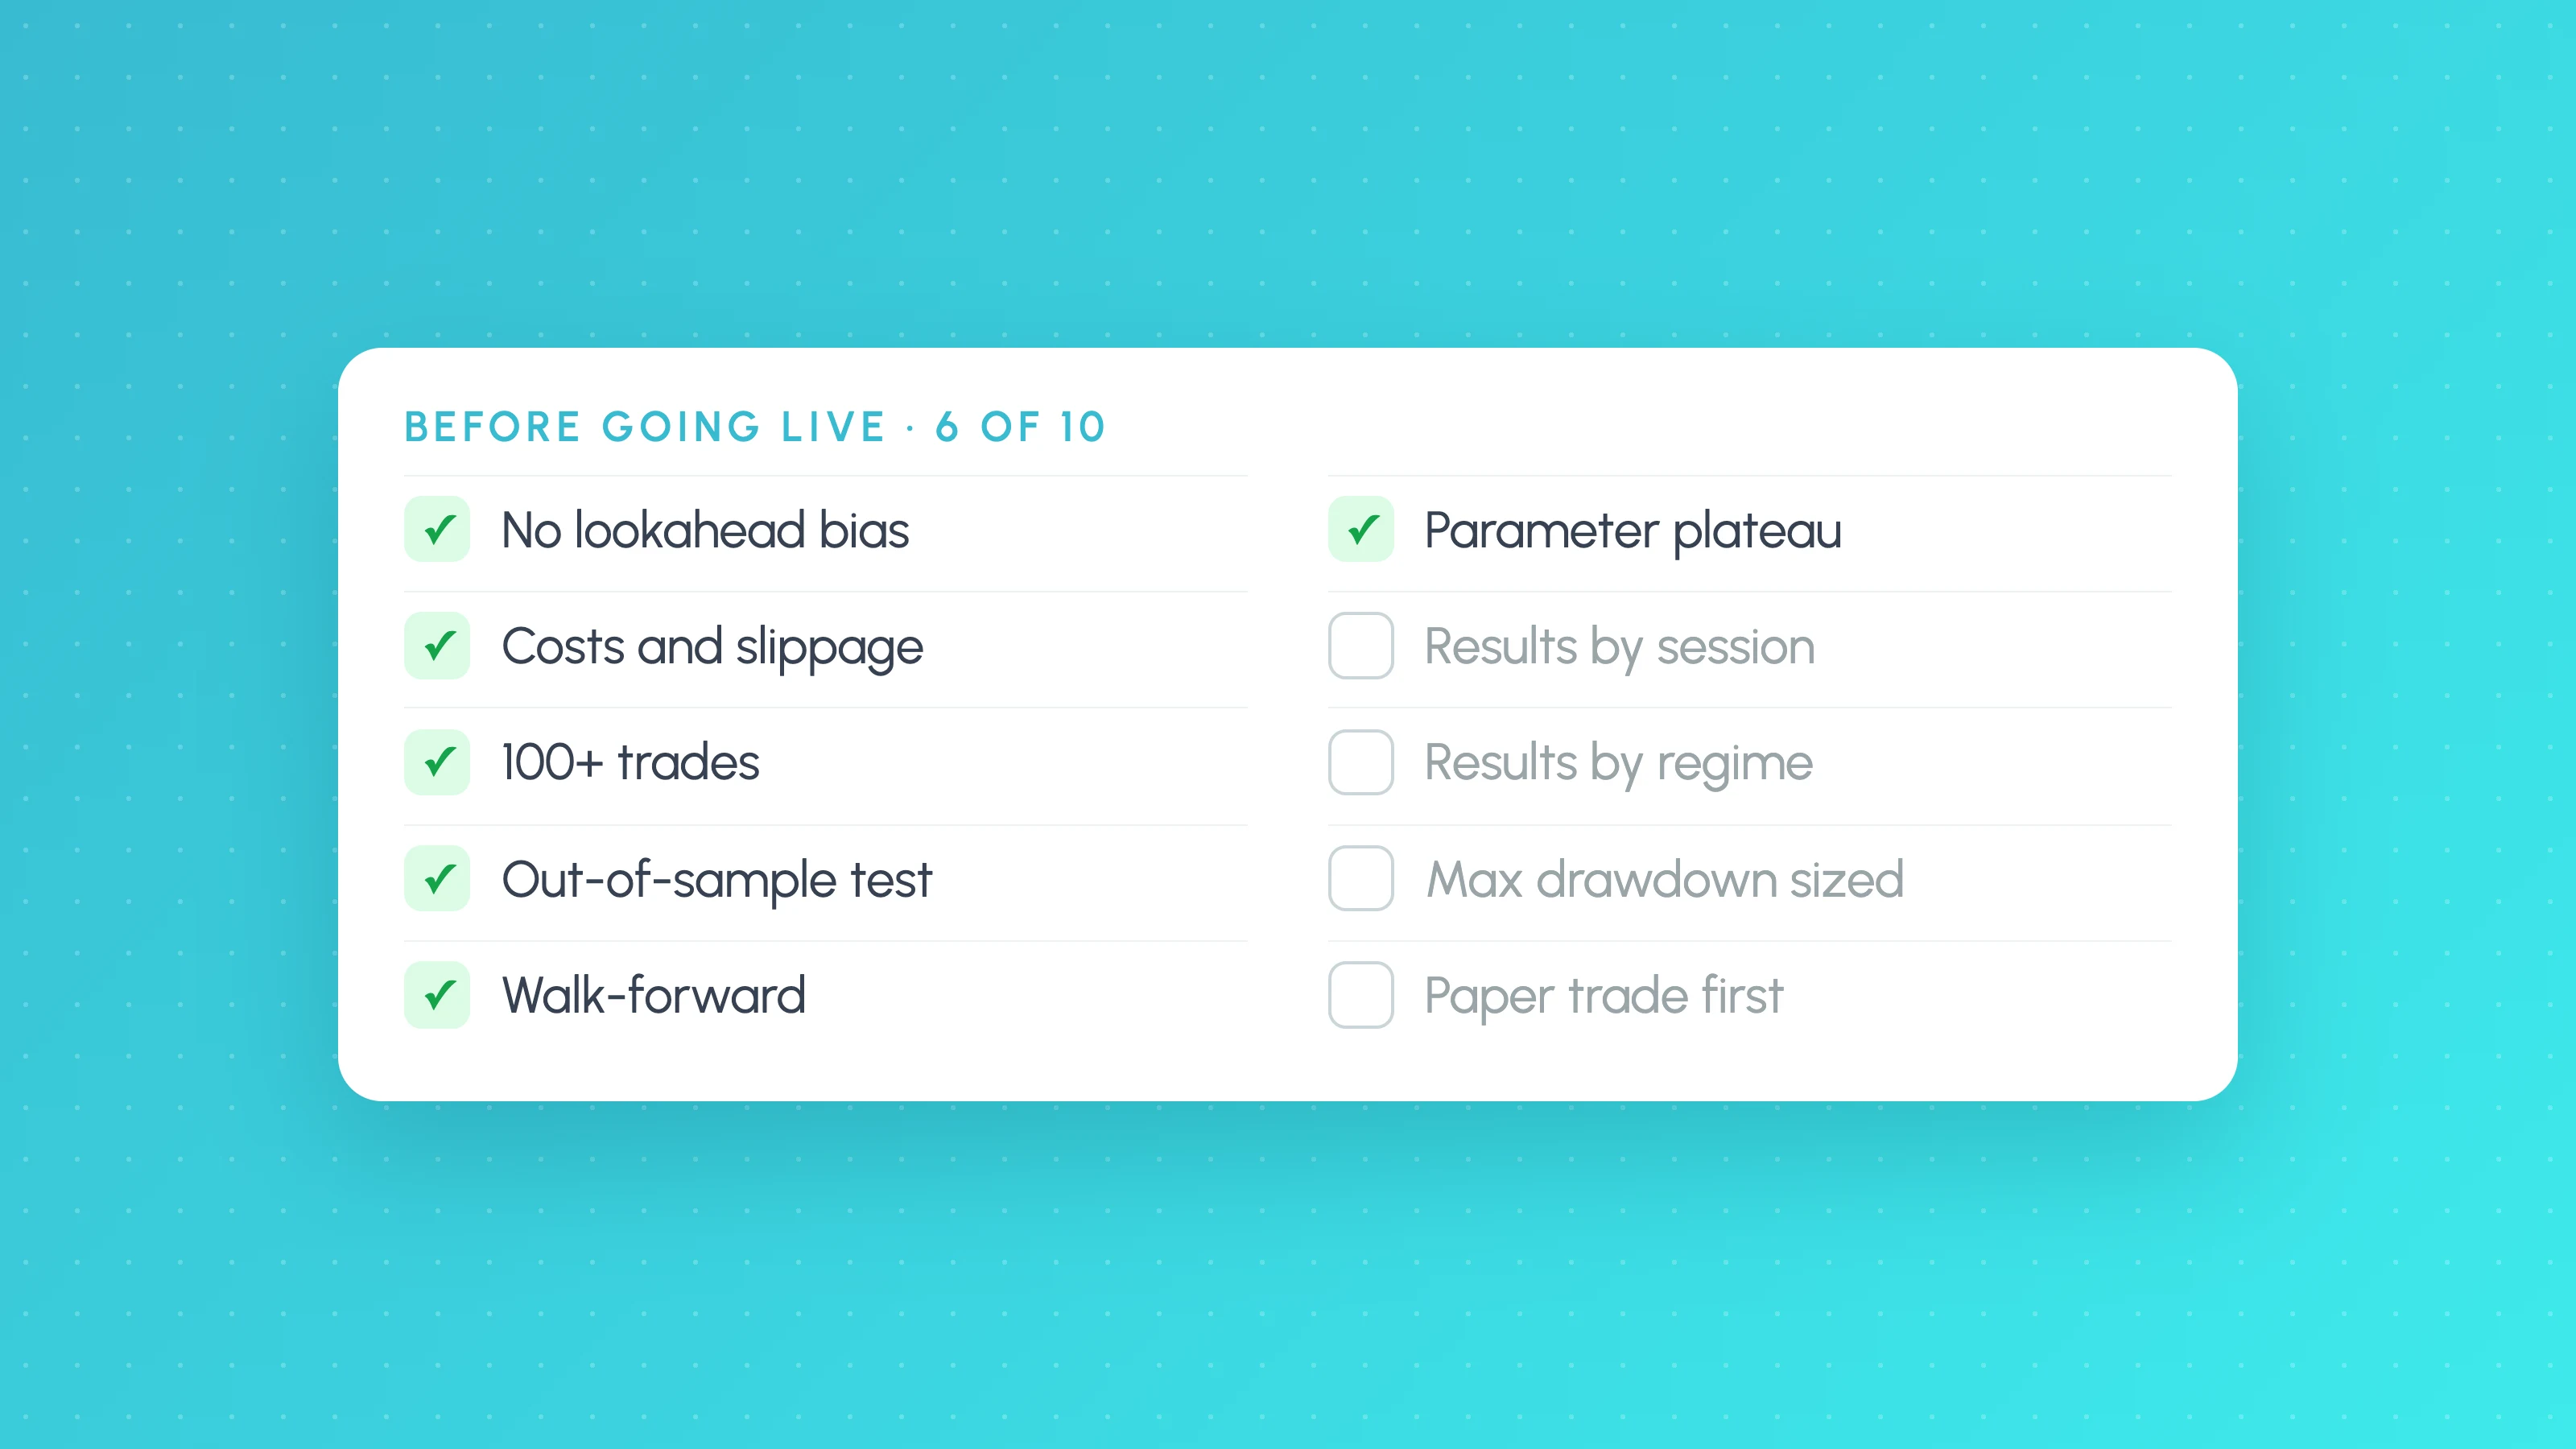
A backtest validation checklist: 10 checks to run before going live, from costs, fills and repainting to out-of-sample, Monte Carlo and forward tests.
 Trading metrics
Trading Expectancy Formula: In Currency and R, With Examples
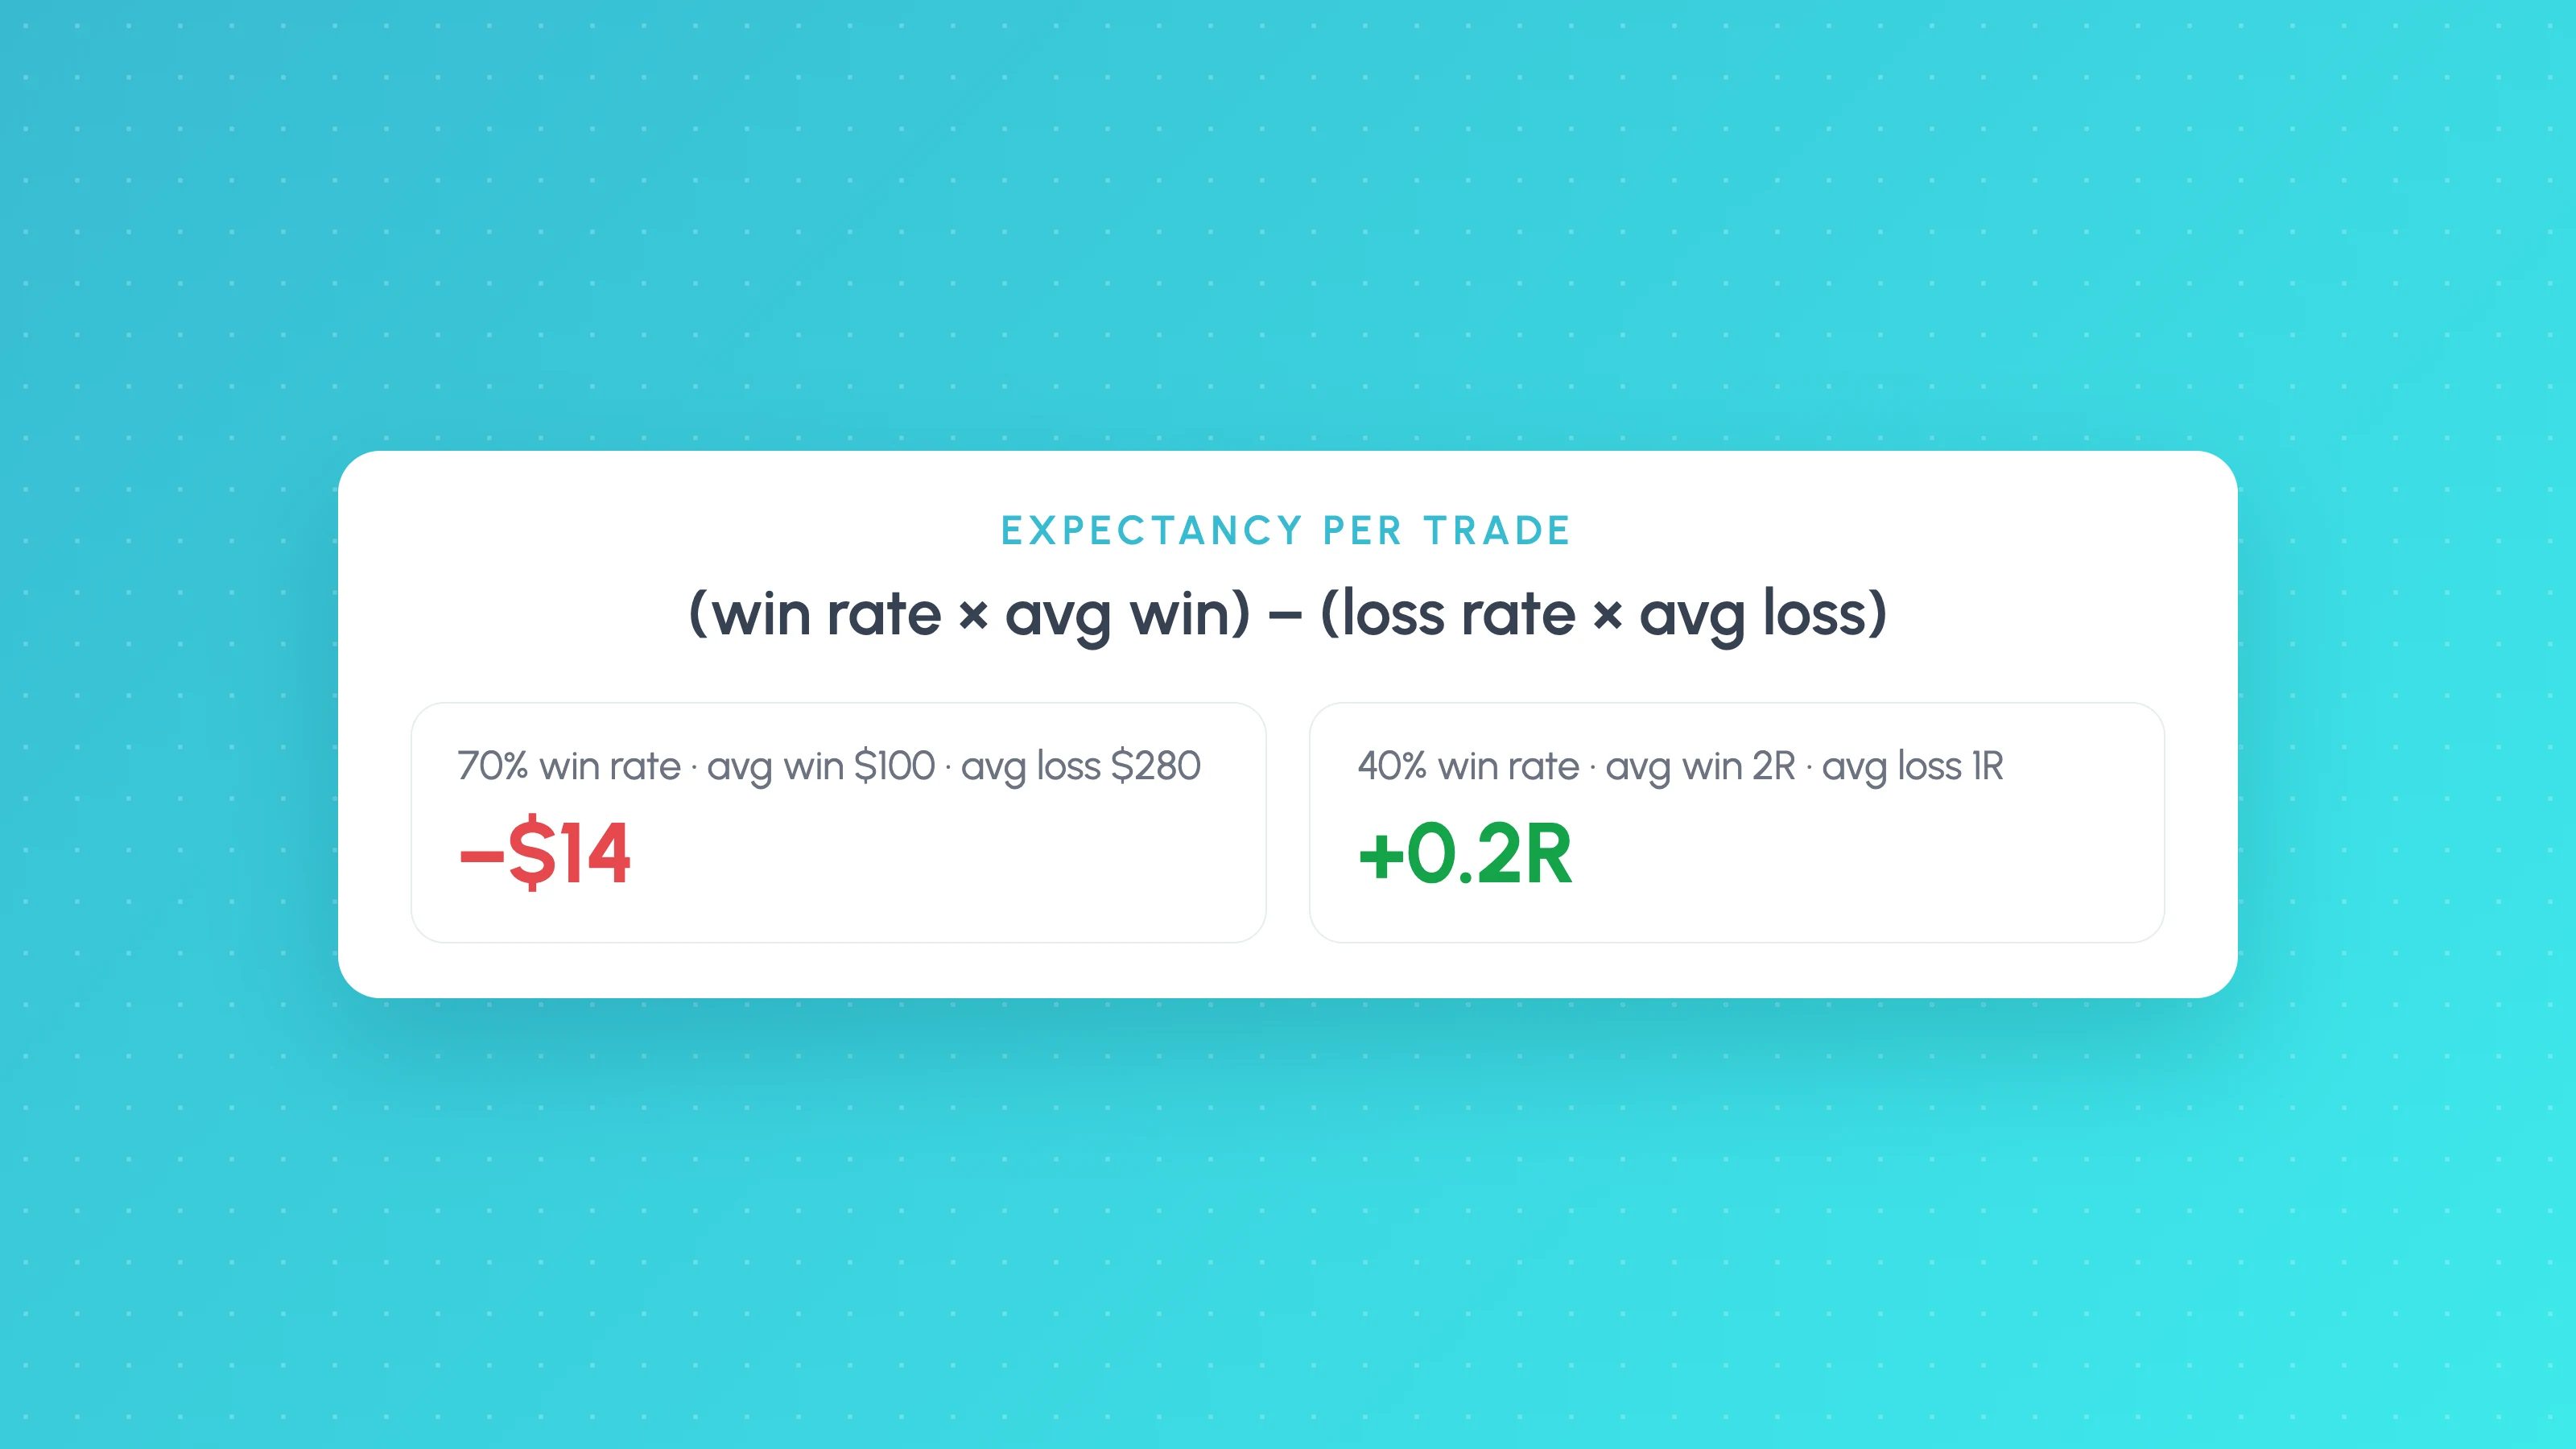
Expectancy = win rate x average win minus loss rate x average loss. Worked examples in currency and R, why 70% win rates lose, and spreadsheet formulas.