

How to Test an Invite-Only TradingView Strategy Before You Pay
How to test a paid invite-only TradingView strategy during the trial: Strategy Tester settings, exporting trades, sample size, session breakdowns and red flags.
By Tessera Trades · Updated · 10 min read
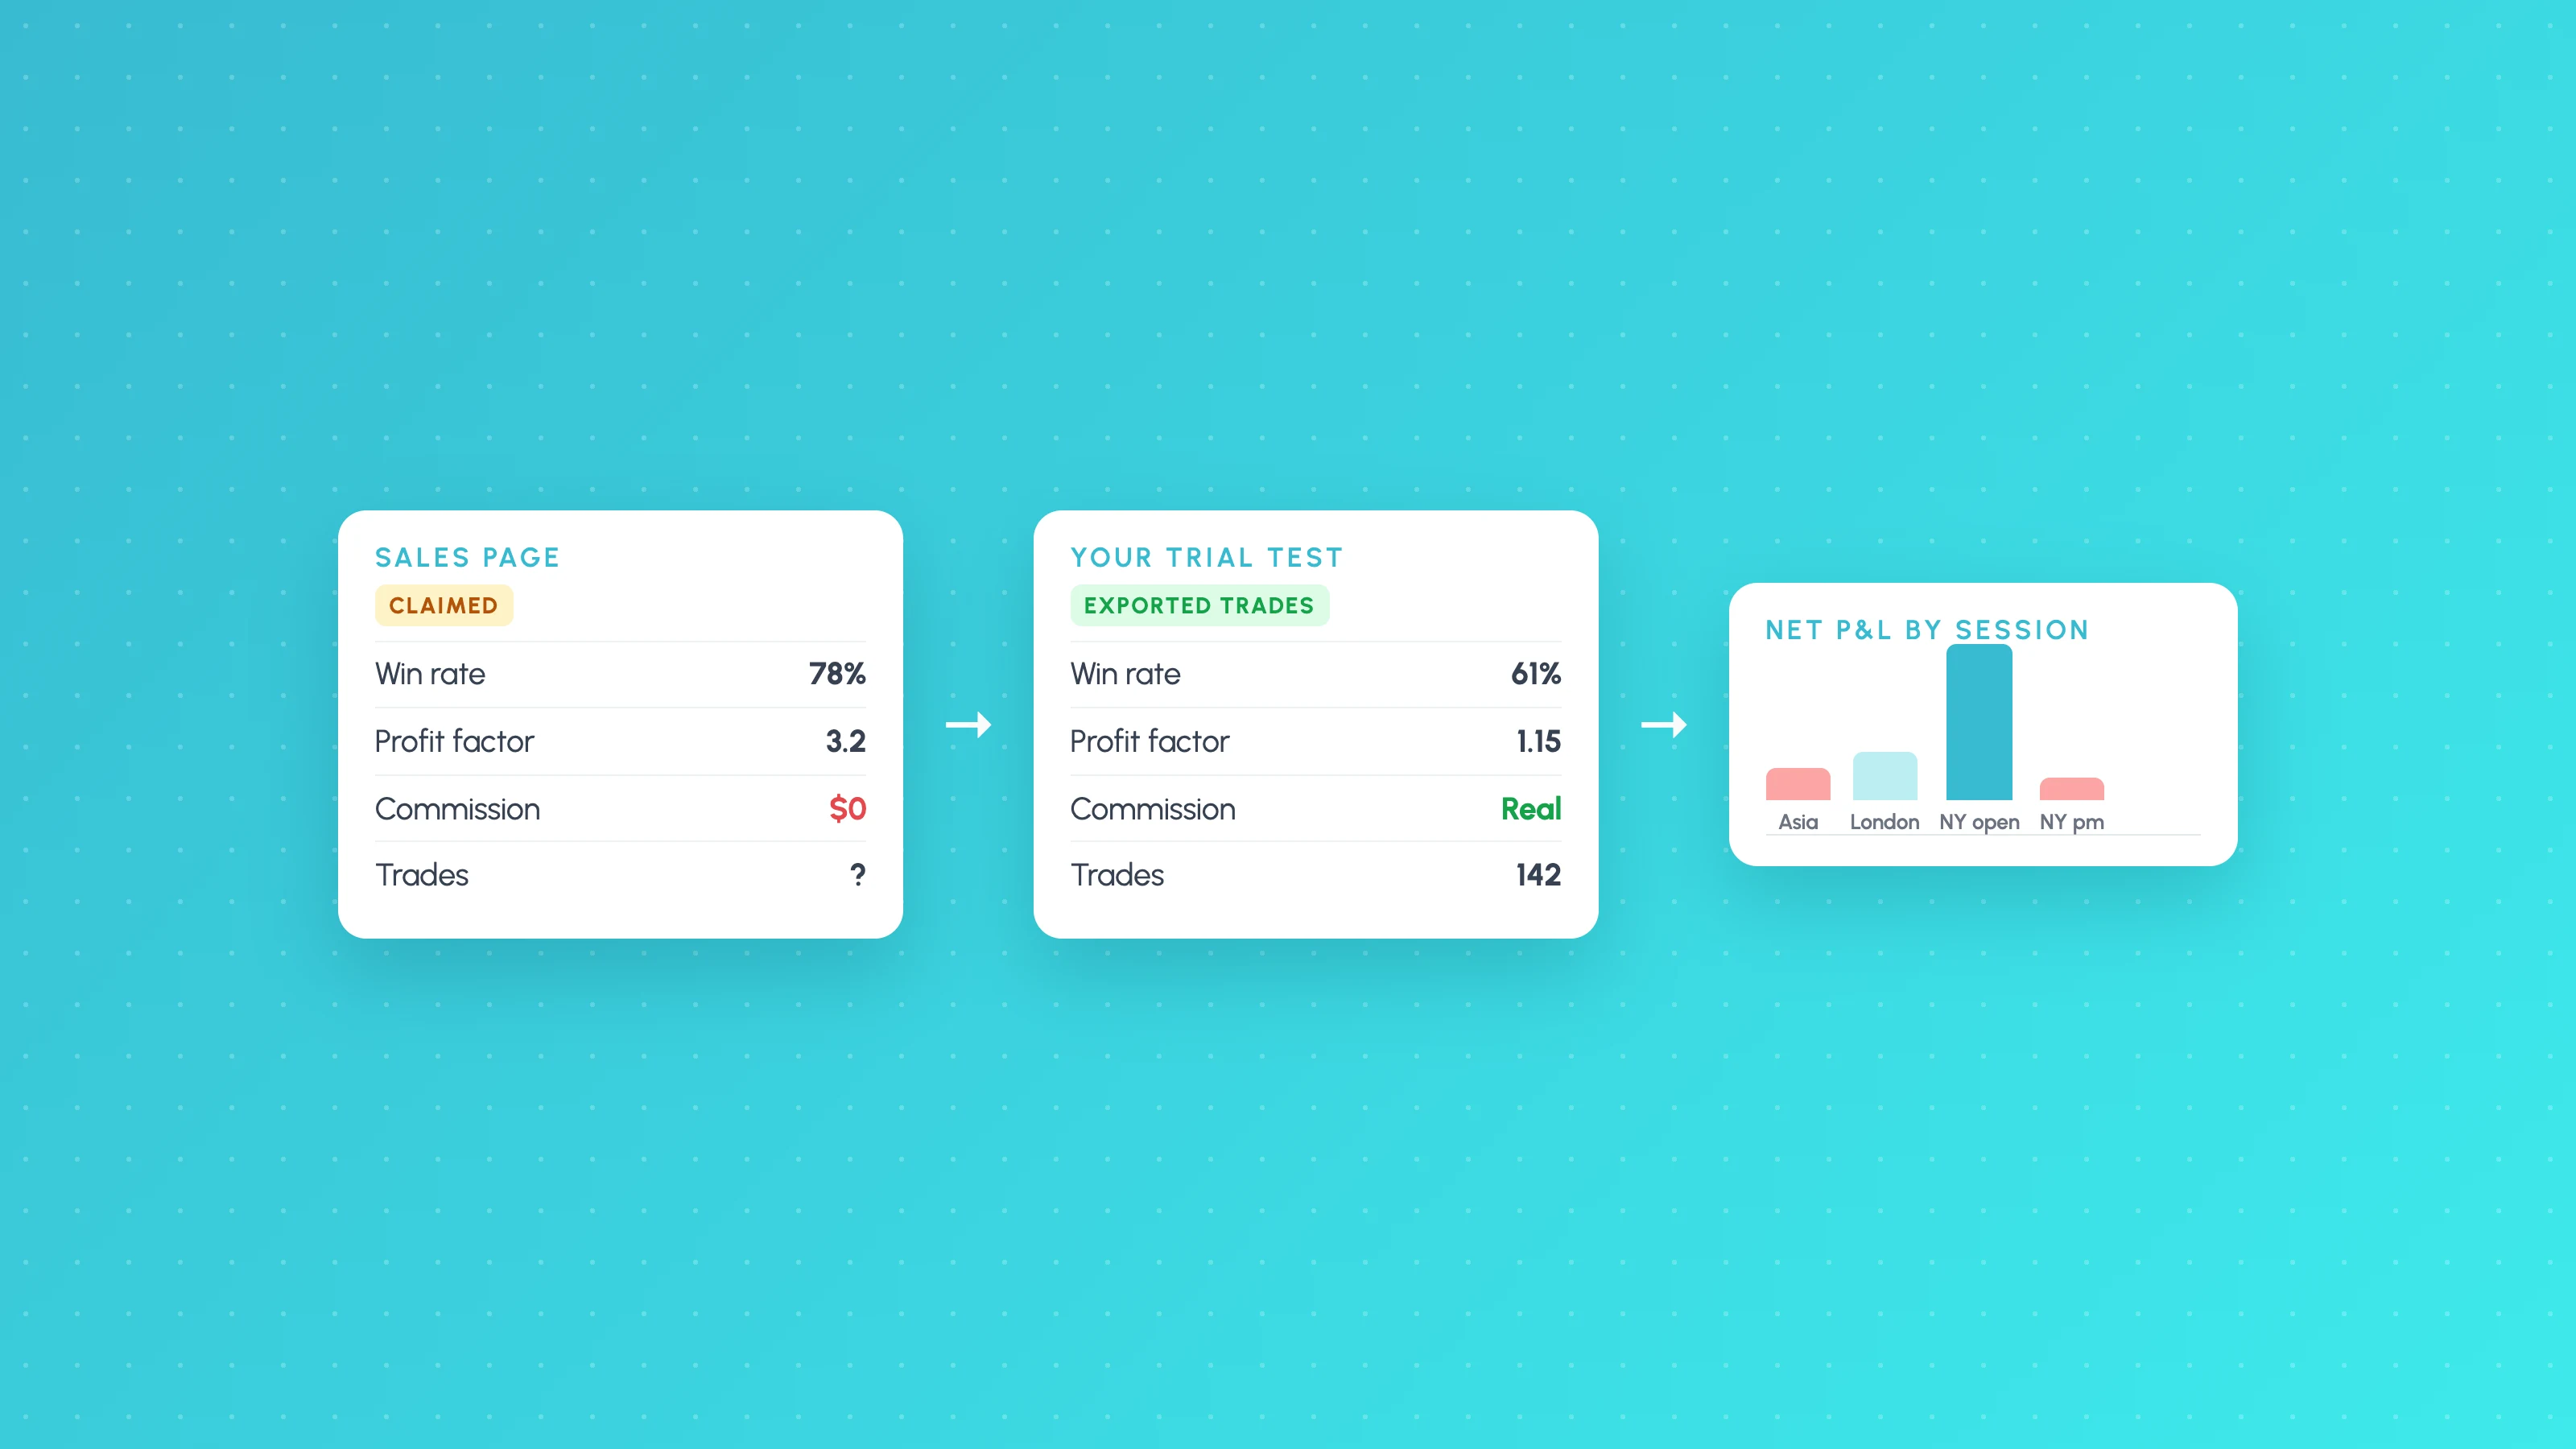
To test an invite-only TradingView strategy before you pay, get trial access, run it in the Strategy Tester on the market and timeframe you would actually trade, set commission, slippage and fill settings to realistic values, then export the List of Trades and check it yourself. You need at least 100 trades, results that hold up across sessions and market conditions, and numbers that roughly match what the vendor claims. If the script is an indicator rather than a strategy, there is no trade list to test, and the vendor's claims stay untested.
A trial is only useful if you test something during it. This guide is the checklist to work through in those few days, and the red flags that should stop you paying.
Marketplace status, as of 3 November 2026: TradingView planned to make its Marketplace the only place to sell invite-only scripts from 1 November, then said on 27 October that nothing would change on that date and that it was drafting new terms allowing sales on creators' own websites and courses. As of 3 November, the revised terms have not been published. The testing steps below are the same whichever way you buy. Our news post on the rule tracks the changes.
First: is it a strategy or an indicator?
Invite-only scripts come in two kinds, and only one can be tested properly.
- A strategy places simulated trades, so it fills the Strategy Tester with a performance summary and a List of Trades. You can export those trades and check them.
- An indicator only draws signals, arrows or zones on the chart. It produces no trade list, so there is nothing to export, and any win rate or profit figure on the sales page is the vendor's own calculation.
If you're being sold an indicator, ask whether there is a strategy version. If there isn't, you are buying on trust. TradingView's own guide to invite-only scripts recommends doing your own research before using one, and lists "Does the author offer a trial period?" as a question to ask.
Step 1: Use the trial on purpose
Invite-only access is granted by the author, so a trial is something the vendor sets up for your username. Before you ask for one:
- Decide what you'll test. Pick the symbol, timeframe and date range you would actually trade. A strategy sold for "all markets" still has to work on yours.
- Check your own plan. Exporting the List of Trades needs TradingView's Essential plan or higher, and High bar detalization needs Premium or Ultimate, as of October 2026 (details in how to export Strategy Tester results). If your plan can't export, you can still read the Trades tab on screen, but it is slower.
- Save the vendor's claims. Screenshot the sales page, the published script description and any performance figures before the trial starts. You'll compare against them in step 7.
Step 2: Run the Strategy Tester on your market and timeframe
Add the strategy to a chart of your symbol and timeframe, then open the strategy report below the chart. Don't rely on the vendor's showcase chart: a strategy can look excellent on the one symbol and timeframe it was tuned on and ordinary everywhere else.
Run it on at least two or three symbols or timeframes the vendor says it works on. If results collapse as soon as you move away from the showcase chart, that tells you more than any single report.
Use a standard candlestick chart. TradingView's script publishing rules say strategies on Heikin Ashi, Renko, Kagi, point and figure, line break or range charts "typically produce very misleading results".
Step 3: Check the settings before you read a number
The Strategy Tester's defaults flatter most strategies, and vendors pick the defaults. Open the strategy's settings, go to the Properties tab and check each of these.
| Setting | What to look for | Why it matters |
|---|---|---|
| Initial capital and order size | An account size and position size you would really use | Compounding a large percentage of equity per trade inflates the headline profit |
| Commission | Your broker's real cost per contract, share or trade | It defaults to zero. A strategy that trades often can go from profitable to losing on commission alone |
| Slippage | A few ticks on market and stop orders, based on your own fills | Also defaults to zero. See how much slippage to assume |
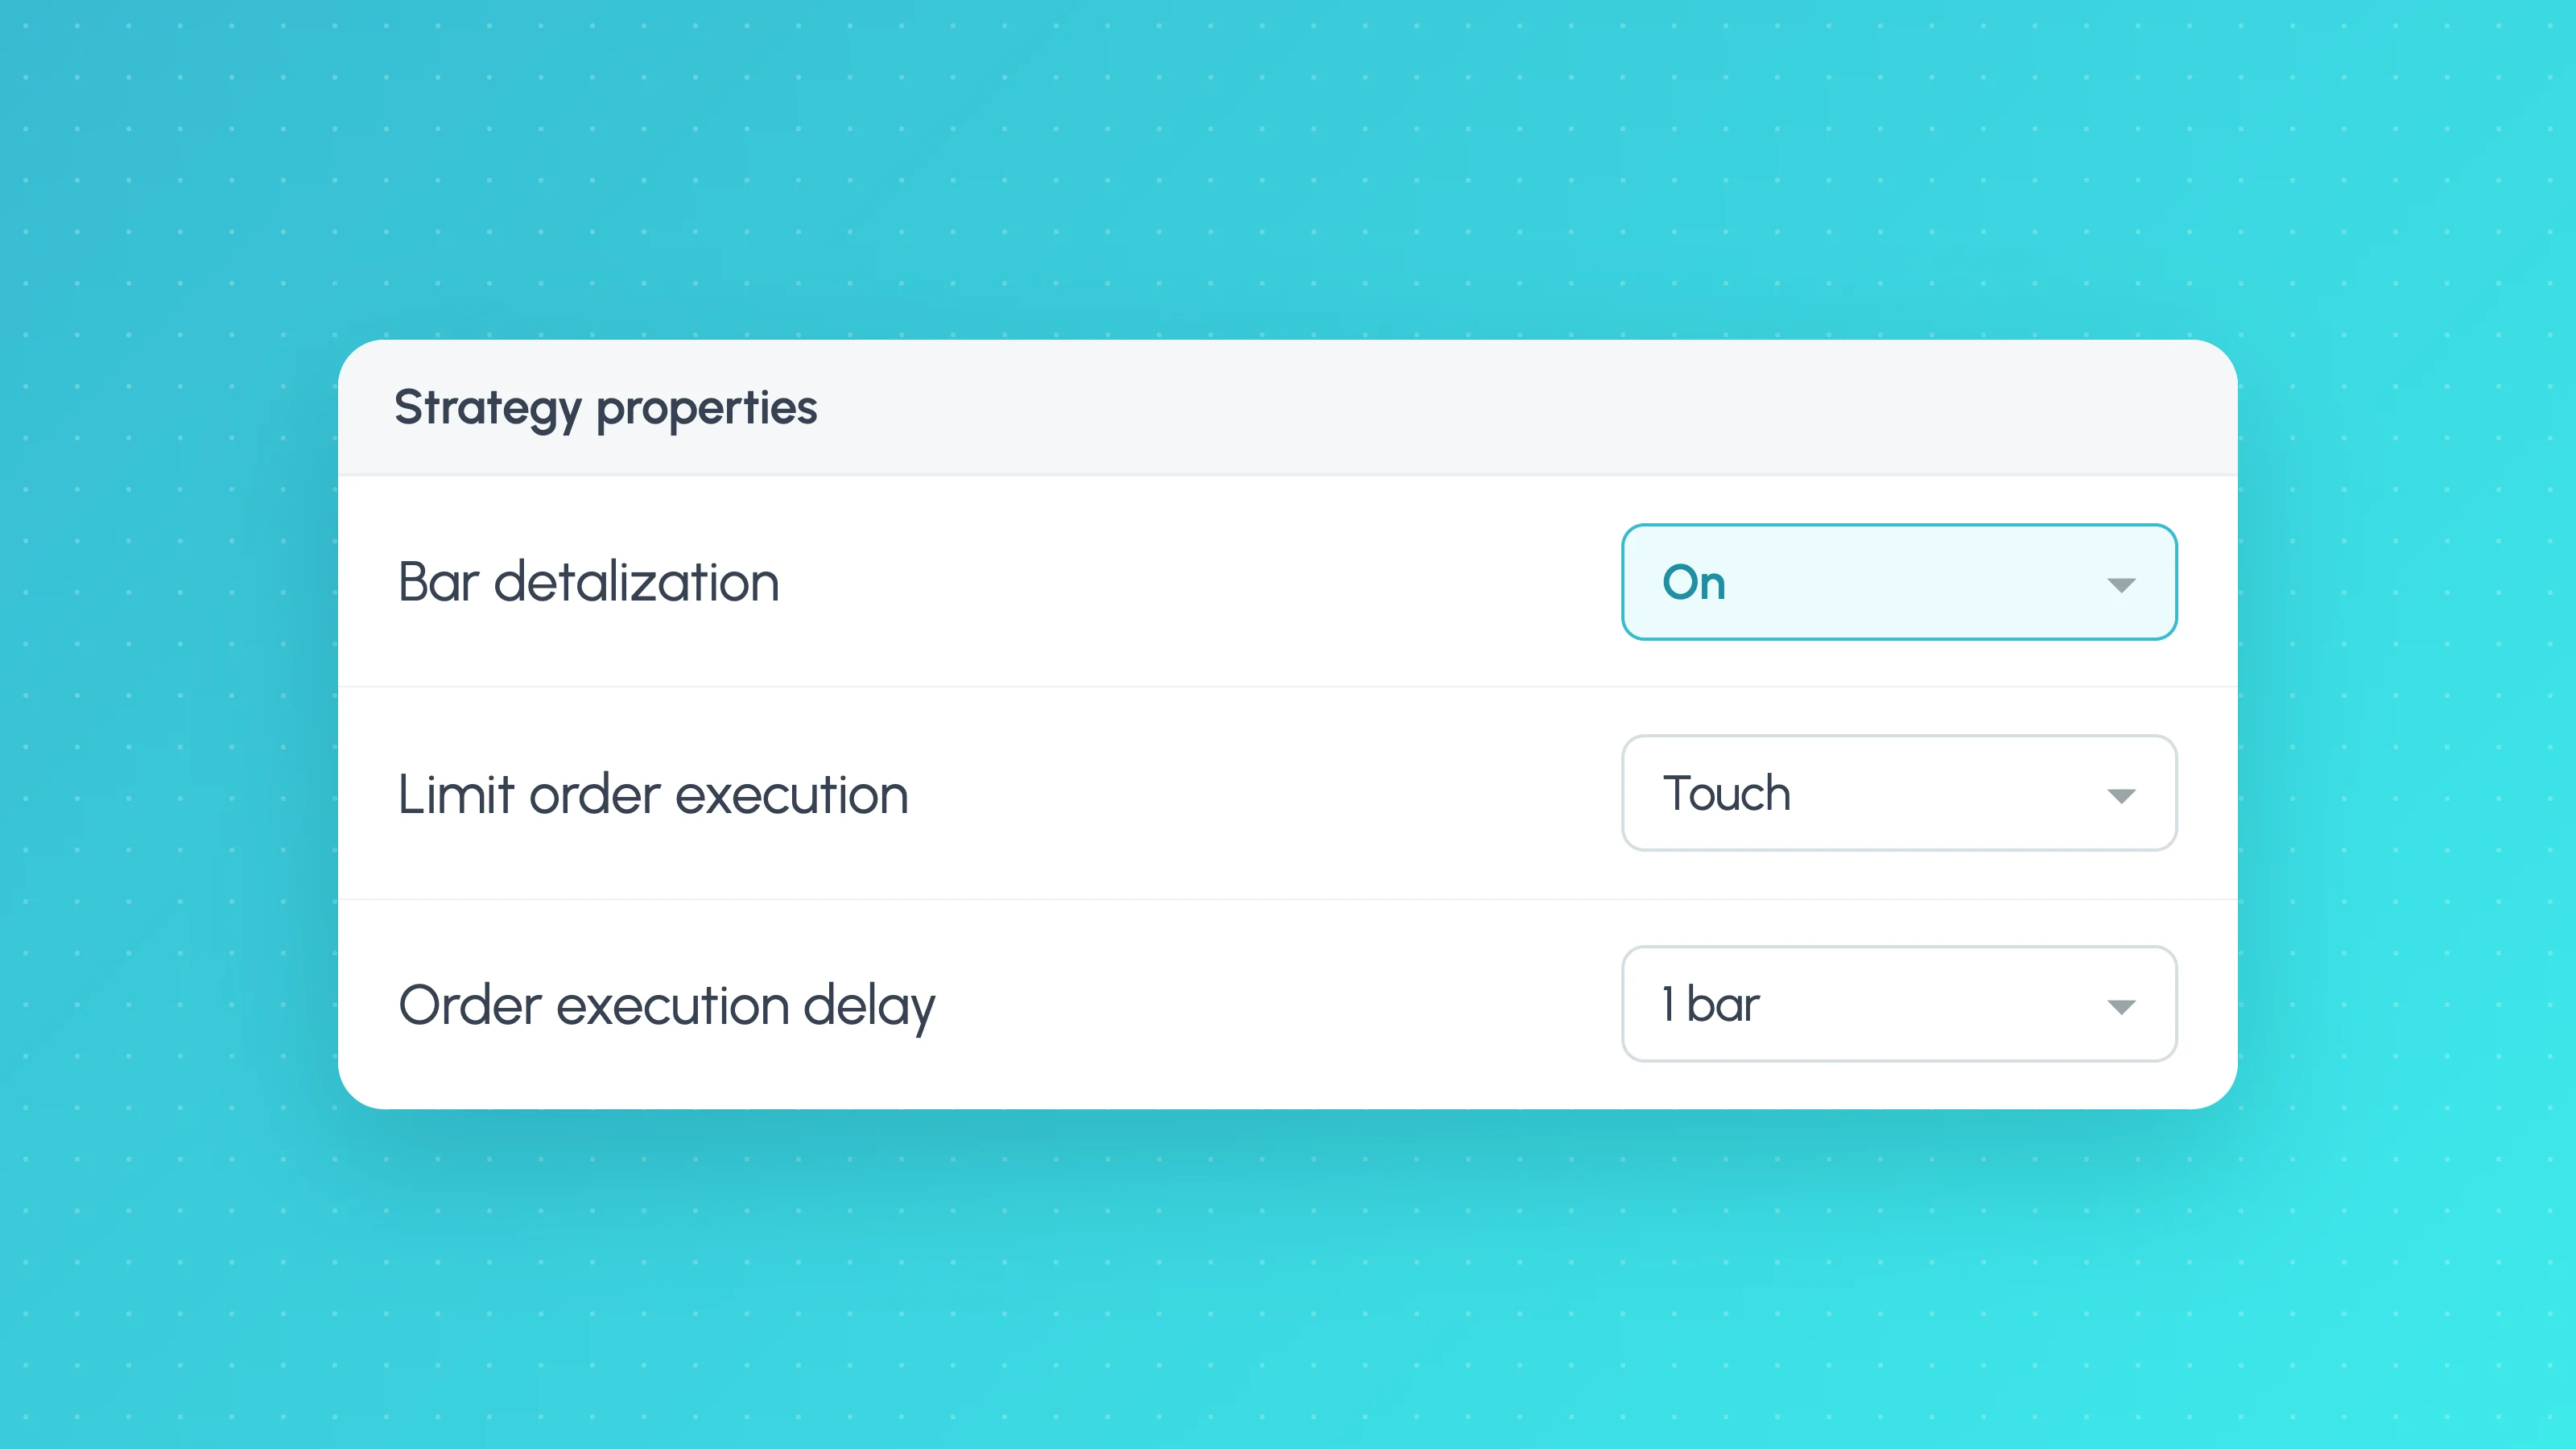
| Bar detalization | High, if your plan has it | Default replays each historical bar as four ticks, which guesses the order of highs and lows inside the bar. Bar detalization replaced Bar Magnifier in July 2026 |
| Limit order execution | The stricter option if your strategy uses limit orders | Fills at the exact limit price are optimistic on historical bars |
| Order execution delay and recalculation | Fills on the next bar, not the signal bar's close; no recalculation on every tick unless the vendor explains why | Both can make historical fills look better than live ones |
TradingView's publishing rules ask authors of published strategies to use commission and slippage that match "expected trading costs for the instrument", realistic capital and margin, and a report that shows "more than 100 trades" in most cases, and to explain any departure in the description. A vendor whose defaults ignore those rules has told you something.
Re-run the report after each change and note the net profit, profit factor and maximum drawdown. If realistic costs and High detalization wipe out most of the edge, stop here.
Repainting red flags
You can't read an invite-only script's code, so you can't check for repainting directly. TradingView's repainting documentation lists the usual causes: higher-timeframe data requested without an offset, which can leak future prices into historical bars, strategies that recalculate on every realtime tick, and signals drawn into the past. You can still look for the symptoms:
- Watch it live during the trial. Note each signal as it appears, then compare with what the chart shows a day later. Signals that move, vanish or appear after the fact are repainting.
- Ask the vendor directly whether the script uses higher-timeframe data, recalculates on every tick, or plots on past bars. A clear answer is a good sign; "it doesn't repaint, trust me" is not.
- Be suspicious of near-perfect entries. Buying the exact low and selling the exact high, trade after trade, is what future data looks like.
Step 4: Export the results
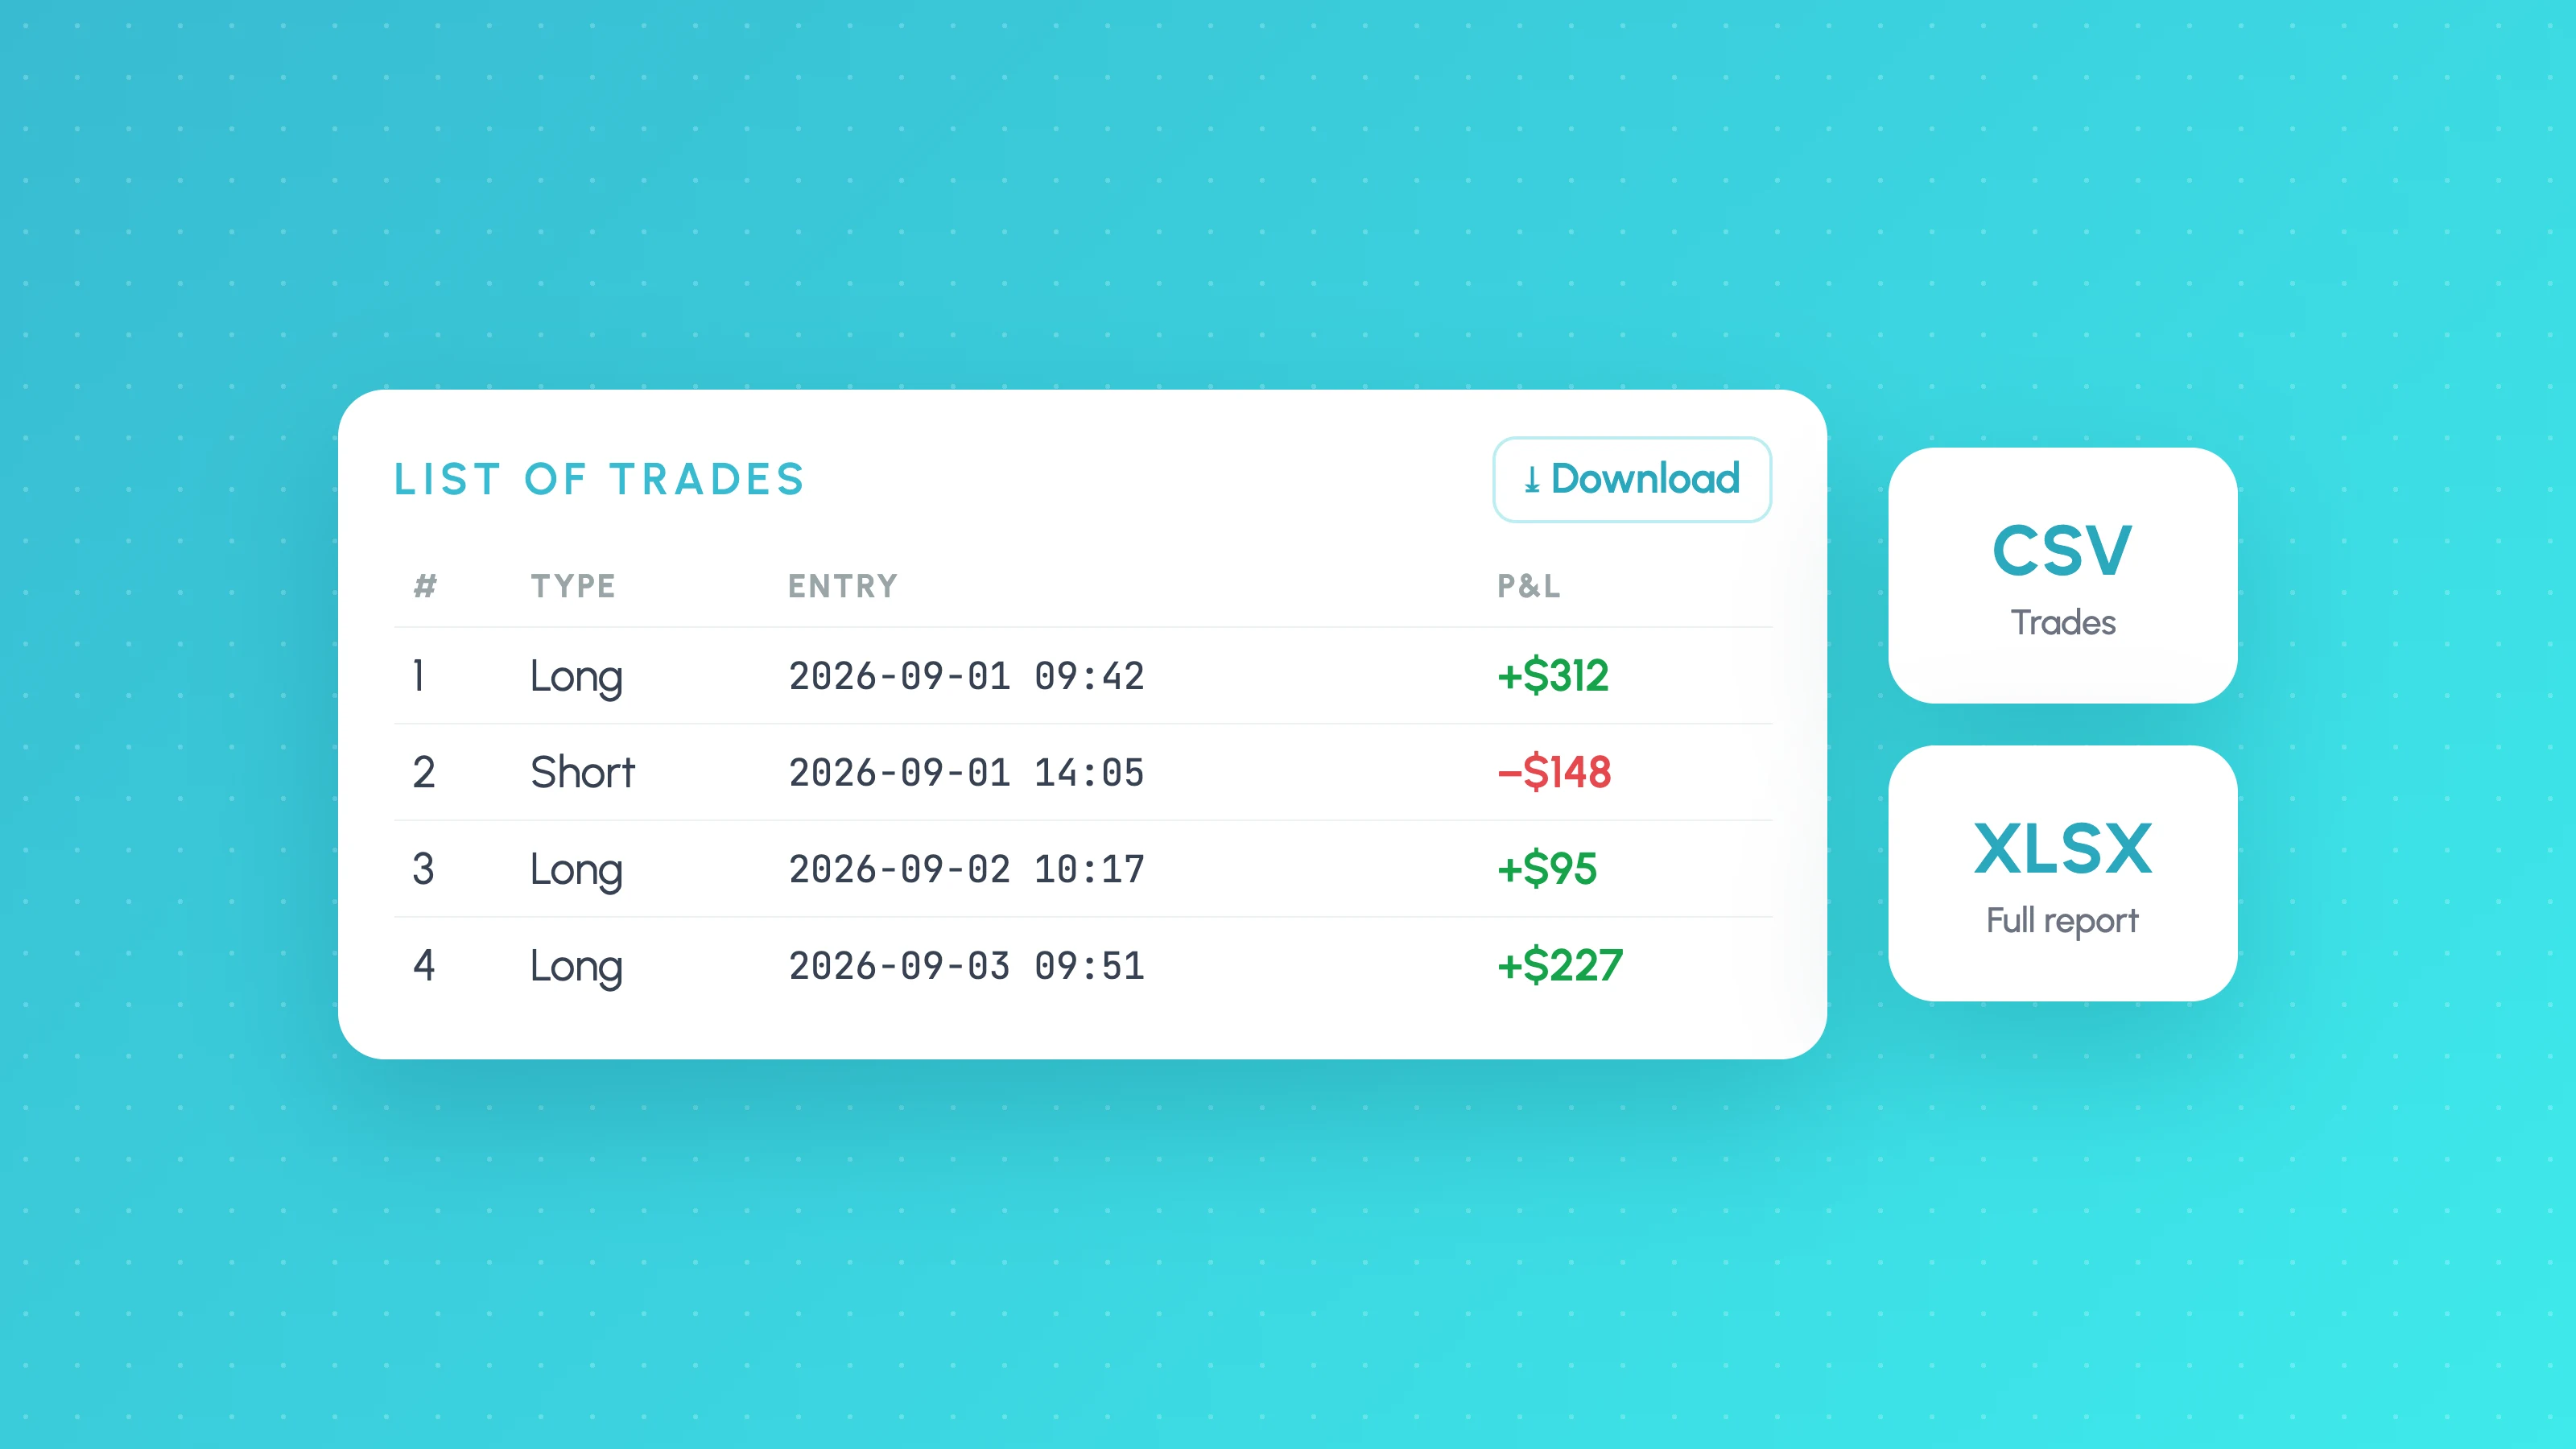
Once the settings are realistic, export the trades. In the strategy report, open the Trades tab and click the Download icon next to Column setup to save the List of Trades as a CSV. "Download data as XLSX" from the report's menu saves the whole report, including the Properties you used, which is worth keeping as a record of what you tested. Our guide to exporting TradingView Strategy Tester results covers where the buttons are, the 9,000-trade limit and what each column means.
Export each symbol and timeframe you tested separately, and name the files with the settings, so you can tell them apart later.
Step 5: Check the sample size
Count the trades before you trust any percentage. Under about 100 trades, a win rate or profit factor can swing a long way on luck alone, and once you split results by session or weekday, each slice needs enough trades of its own. How many trades you need for a valid backtest gives the arithmetic and per-bucket minimums.
If the strategy trades rarely, extend the date range rather than accepting a small sample. If it only reaches 100 trades over many years, ask whether the market it was built on still behaves the same way.
Step 6: Break it down by session and regime
A single equity curve hides where a strategy makes and loses its money. Split the exported trades by:
- Session: Asia, London, New York and the overlaps.
- Weekday and time of day: many strategies make most of their profit in one or two hours.
- Volatility regime: quiet versus volatile periods, measured with something like ATR.
- Direction: longs versus shorts.
- Period: each year or quarter separately. A strategy that made all its money in one year has a narrower edge than its total suggests.
You can do this in a spreadsheet, or upload the CSV to Tessera's free Entry Analysis report, which breaks a TradingView Strategy Tester export down by session, weekday, time of day and volatility, with the trade count behind each figure. No card is needed.
What you're looking for is whether the edge is broad or concentrated. Broad means most sessions and regimes are profitable after costs. Concentrated means one slice carries everything and the rest lose. A concentrated strategy can still be worth trading, but only in that slice, and that isn't what you were sold. The backtest validation checklist covers the other checks to run before going live, and is my backtest overfit? covers what it looks like when a strategy has been tuned to its own history.
Step 7: Compare with the vendor's claims
Now put your numbers next to the screenshots from step 1. The table below is an illustration with made-up figures, not any real vendor's script.
| Metric | Vendor's sales page (illustrative) | Your test with realistic settings (illustrative) |
|---|---|---|
| Win rate | 78% | 61% |
| Profit factor | 3.2 | 1.15 |
| Trades | "Hundreds" | 142 |
| Maximum drawdown | "Low" | 18% |
| Best session | Not stated | New York open: 80% of net profit |
A gap between the two columns doesn't prove the vendor lied: they may have used different settings, dates or symbols. Ask them for the exact settings and date range behind their figures, then reproduce them. If you can't get close to their numbers with their own settings, or their settings use zero costs, that's your answer.
Red flags that should stop you paying
- No trial, and no strategy version of an indicator, so nothing can be tested before you pay.
- Performance shown only as screenshots or as a win rate with no trade count, drawdown or cost assumptions.
- Zero commission or slippage in the default settings, or a report built on a non-standard chart type.
- Fewer than 100 trades in the vendor's own report, or results shown on one hand-picked symbol and timeframe.
- Signals that move or disappear when you watch them live.
- Win rates near 90% with a small average win and a large average loss. Check the expectancy, not the win rate.
- Pressure to buy a lifetime or annual plan before the trial ends. While TradingView's new Marketplace terms are pending, a monthly plan carries less risk.
- Claims of guaranteed or consistent returns. TradingView's publishing rules say performance claims that can't be substantiated don't belong in a publication.
Test the trades, not the sales page
Whether a paid script is worth it comes down to one question: does its trade list hold up on your market, with your costs, across conditions? Export the trades during the trial and run them through the free Entry Analysis report to see which sessions, weekdays and volatility conditions carry the result before you pay for a month, let alone a year.
Frequently asked questions
- Are paid TradingView indicators worth it?
- Some are, but most can't show it. An indicator produces no trade list, so its claimed results can't be checked. A paid strategy can be: run it on your market with realistic commission, slippage and fill settings, export at least 100 trades, and check that the result holds across sessions and volatility conditions. If it does, the price may be worth paying; if the vendor won't offer a trial, assume it isn't.
- What is an invite-only script on TradingView?
- An invite-only script is a published indicator or strategy whose code is hidden and which only users the author grants access to can add to a chart. Authors often charge for access. You can see the script's description and, for a strategy, its Strategy Tester results once you have access, but not its code.
- Can I backtest an invite-only TradingView strategy?
- Yes, once the author gives you access. It runs in the Strategy Tester like any strategy, and you can change its Properties, such as commission, slippage and bar detalization, and export the List of Trades if your plan allows it. An invite-only indicator can't be backtested in the Strategy Tester because it doesn't place trades.
- How do I know if a TradingView strategy repaints?
- Watch its signals live and compare them with the chart a day later: signals that move, disappear or appear after the bar closed are repainting. TradingView's documentation lists the common causes, including higher-timeframe data requested without an offset and strategies that recalculate on every tick. Ask the vendor about each one.
- Do I need a paid TradingView plan to test a strategy?
- You can run a strategy and read its report on the free plan, but exporting the List of Trades needs Essential or higher, and High bar detalization needs Premium or Ultimate, as of October 2026. Without an export you can still check settings and read trades on screen.
- Can creators still sell invite-only scripts outside the TradingView Marketplace?
- For now, yes. TradingView said on 27 October 2026 that nothing would change on 1 November and that new terms would allow sales on creators' own websites and in courses. As of 3 November 2026, the revised terms have not been published, so check TradingView's terms before buying a long subscription.
Keep reading
 TradingView backtests
How to Export TradingView Strategy Tester Results (2026)
Export TradingView Strategy Tester results as CSV or XLSX: where the download buttons are, which plan you need, the 9,000 trade limit and what columns mean.
 TradingView backtests
TradingView Strategy Tester Settings Changed: Bar Detalization, Limit Fills and Order Delay Explained
TradingView bar detalization replaced Bar Magnifier in July 2026. What it, Limit order execution and Order execution delay do to fills and results.
 TradingView backtests
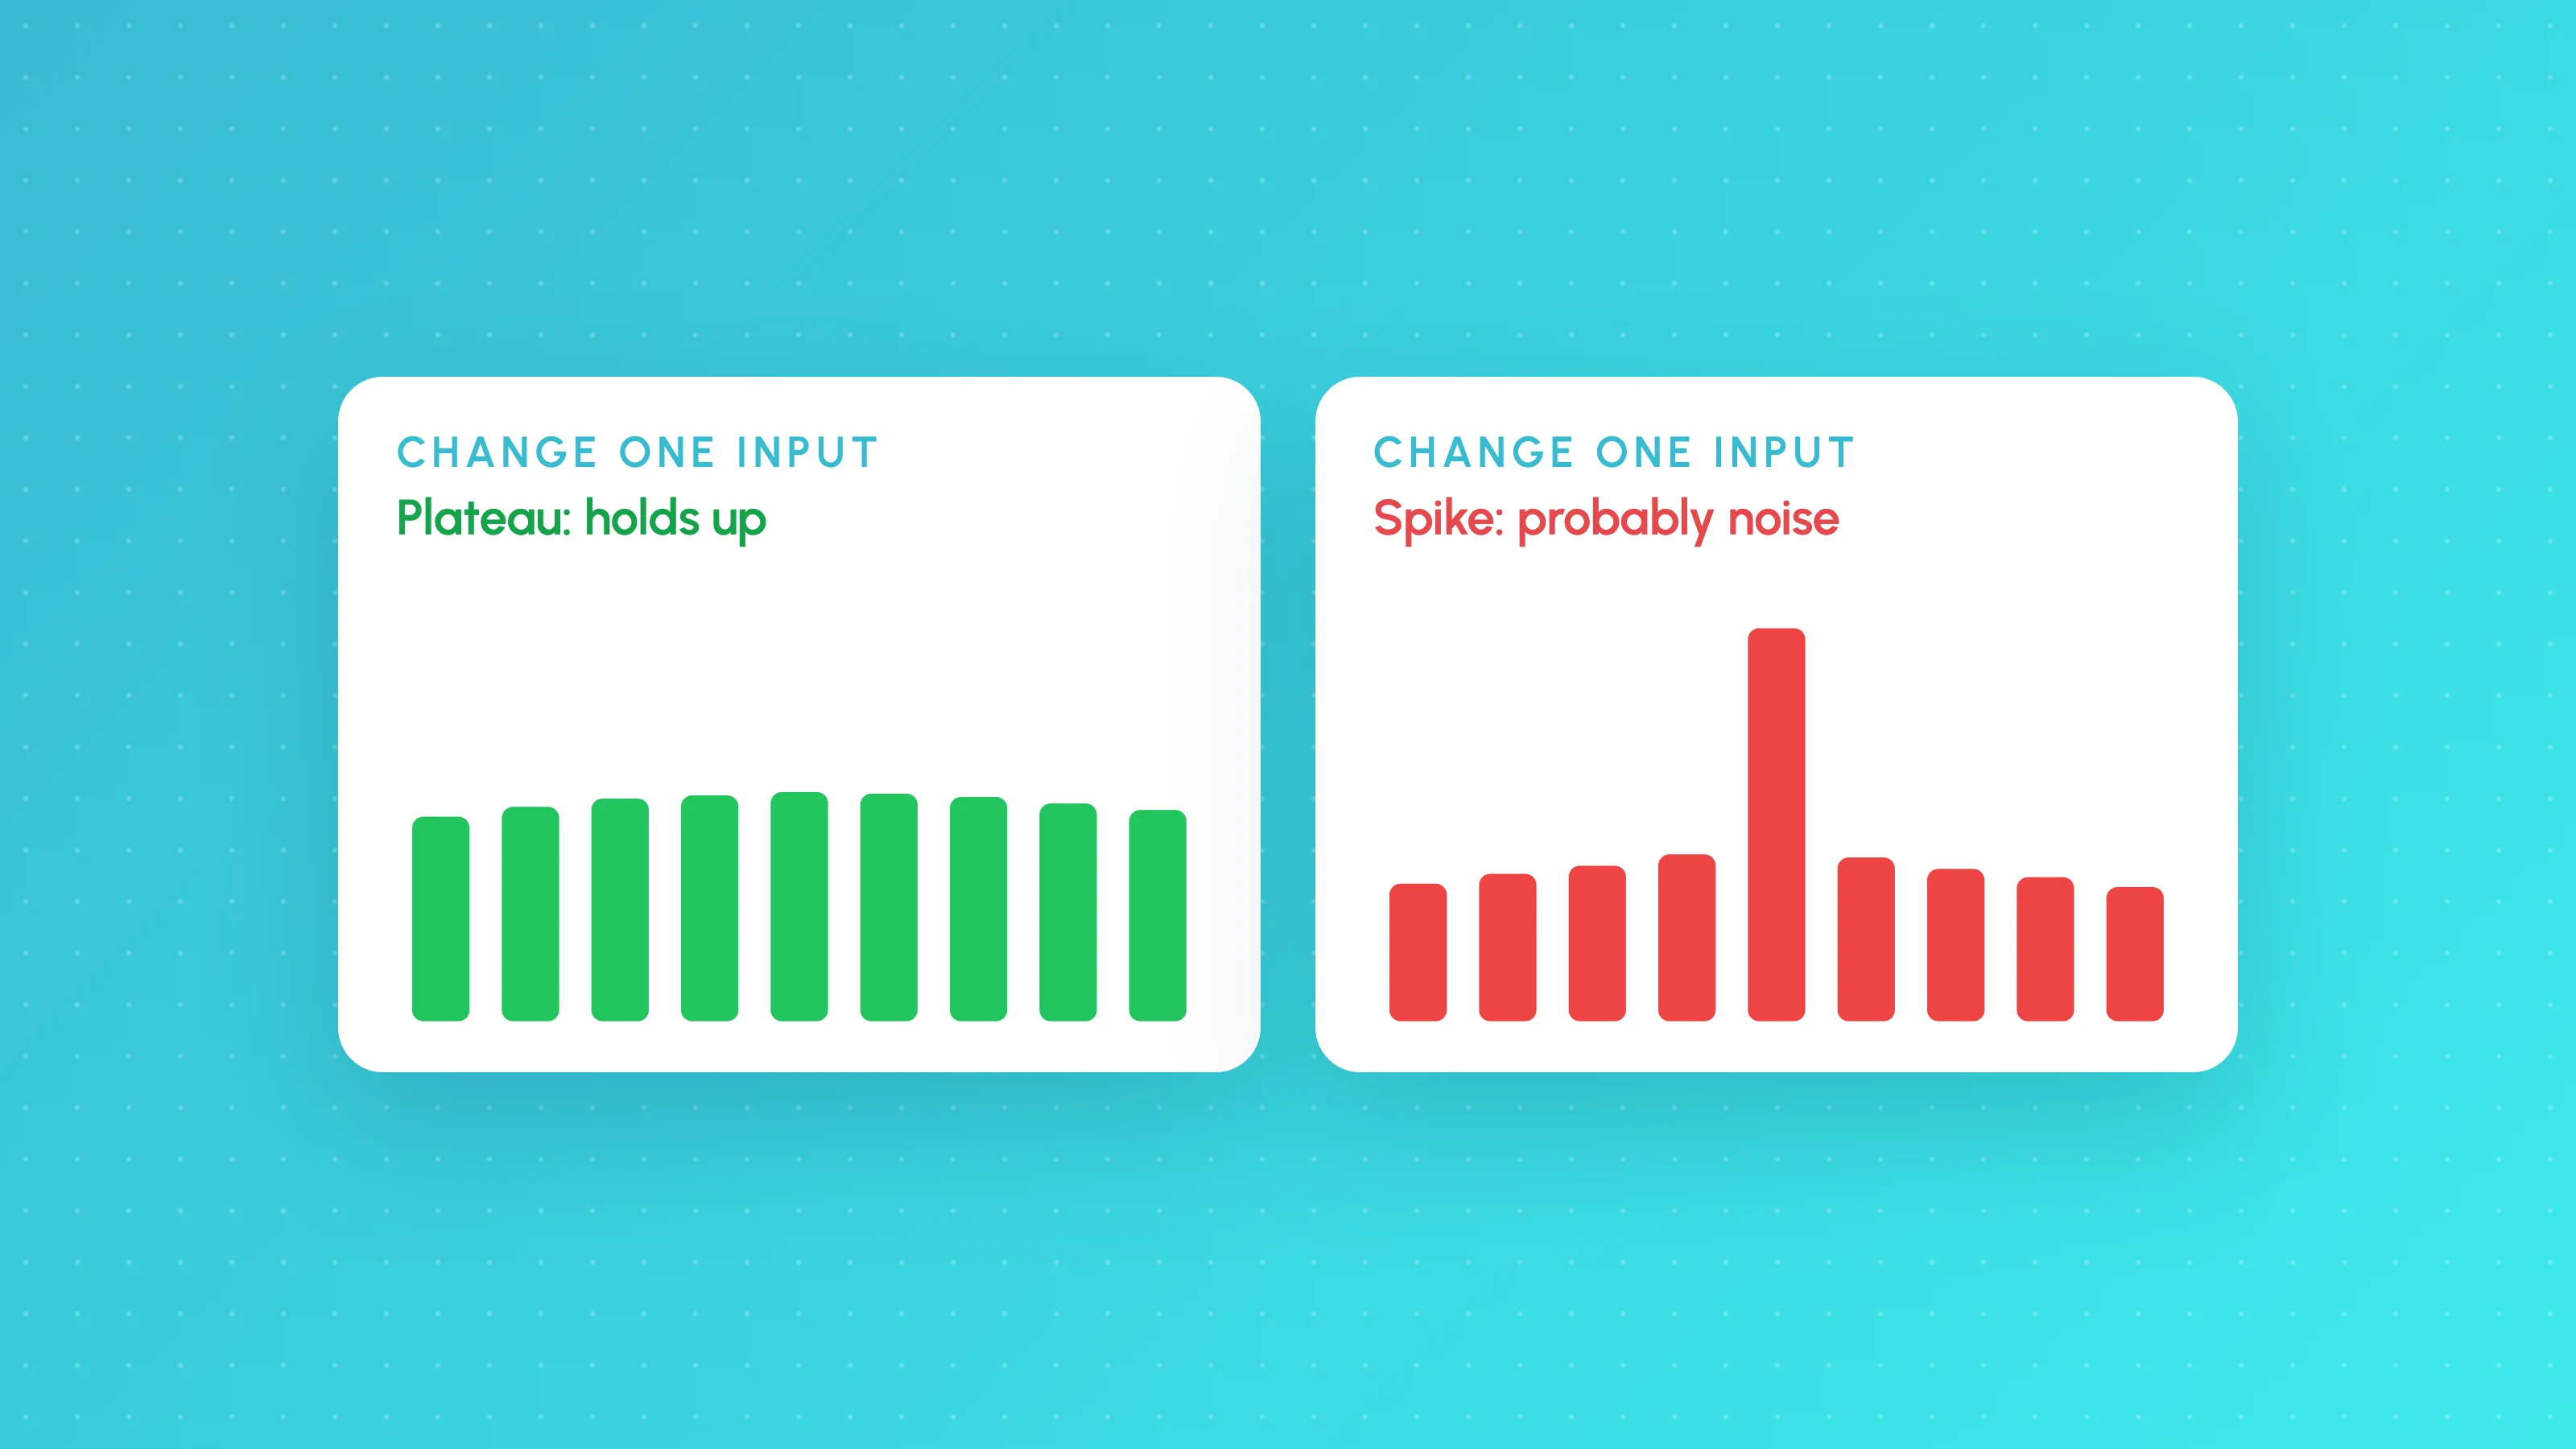
Is My Backtest Overfit? A Practical Checklist for Traders
How to tell if a backtest is overfit: too-good metrics, thin samples, fragile inputs, useless filters, out-of-sample and walk-forward tests, plus a checklist.