

RSI Trading Strategy: 4 Rule Sets You Can Test (and Their Limits)
RSI trading strategies explained: overbought and oversold, 2-period RSI, the 50-line trend filter and divergences, with example rules, common mistakes and how to test them.
By Hristo Skulev · Updated · 4 min read
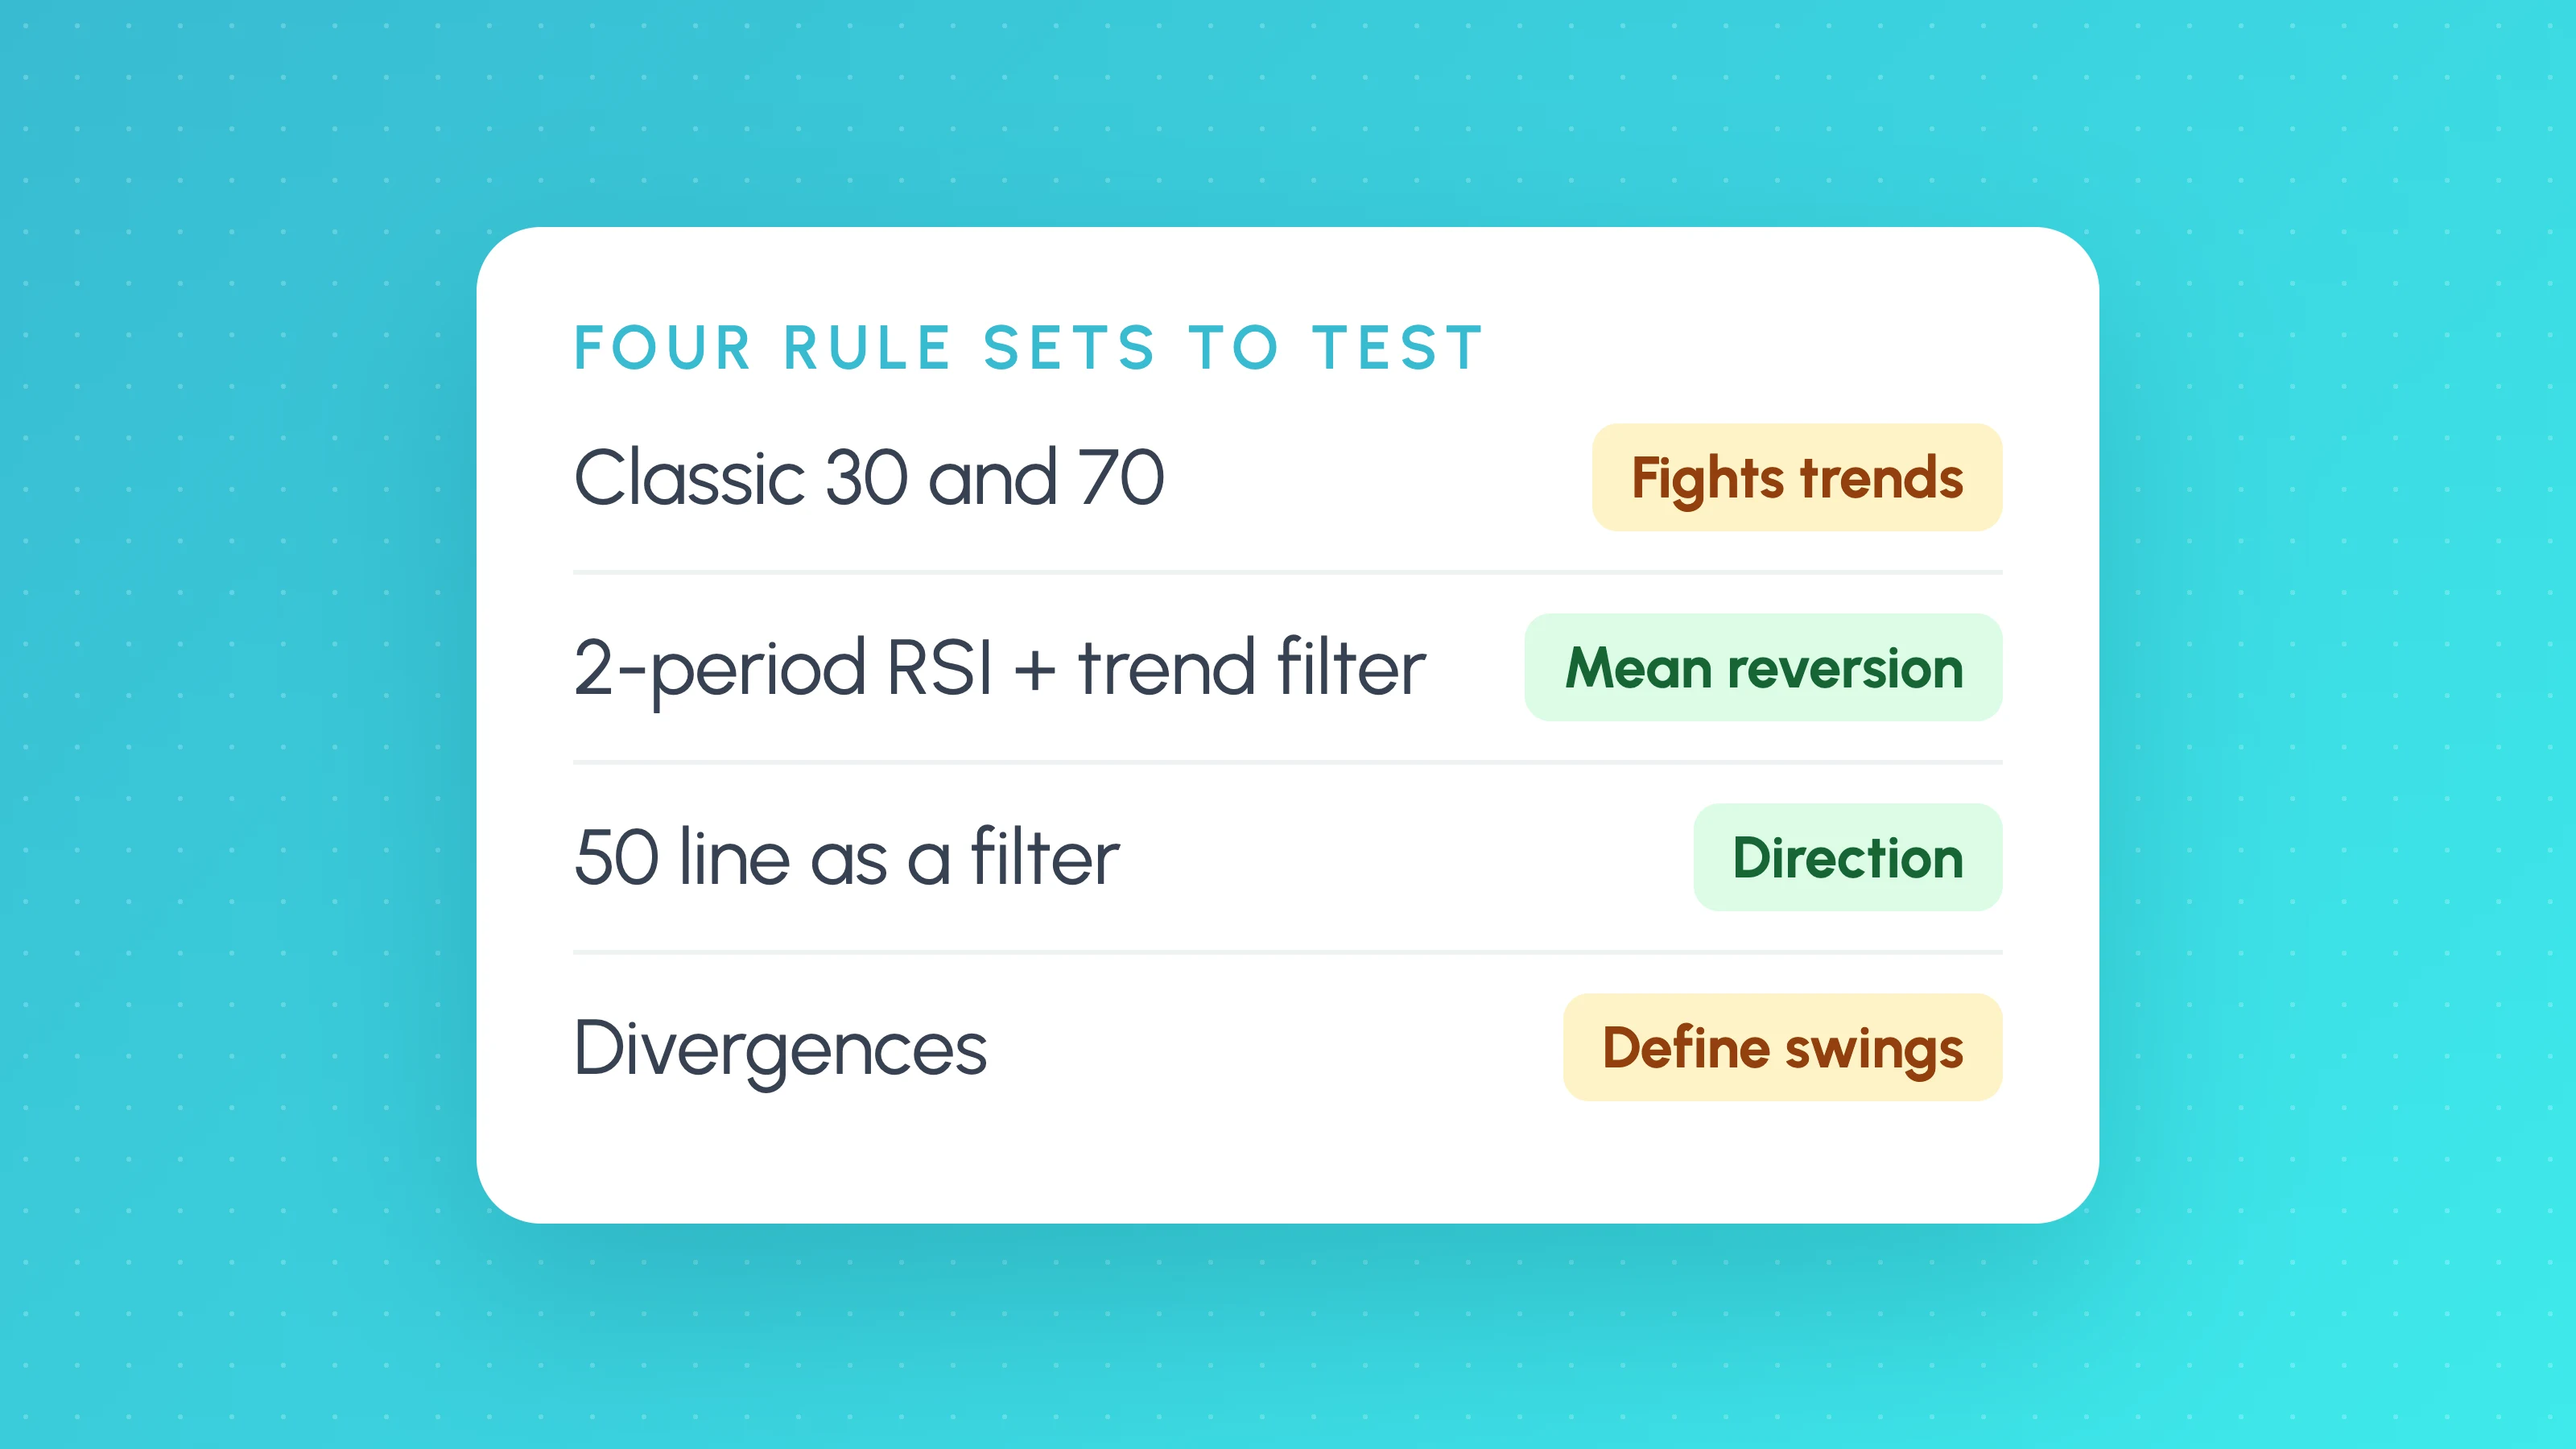
An RSI trading strategy uses the Relative Strength Index, an oscillator from 0 to 100 that J. Welles Wilder introduced in 1978, to time entries. The classic version buys when RSI drops below 30 (oversold) and sells when it rises above 70 (overbought), but on its own that rule tends to fight strong trends. The versions systematic traders actually test add a trend filter, use a much shorter RSI period, use the 50 line to confirm direction, or look for divergences between RSI and price.
This guide gives four rule sets precise enough to backtest, and where each one tends to fail.
These are educational examples, not recommendations. Backtests are not future results, and leveraged trading carries a high risk of loss.
How RSI is calculated
RSI compares the size of recent gains with recent losses over a set number of bars, 14 by default:
RSI = 100 - 100 / (1 + average gain / average loss)A reading near 100 means recent bars were mostly up; near 0, mostly down. "Overbought" and "oversold" only mean price moved a lot in one direction recently, not that it must reverse.
Rule set 1: classic overbought and oversold
- Entry: buy when the 14-period RSI crosses back above 30; sell short when it crosses back below 70.
- Stop: 1.5 x ATR.
- Exit: RSI reaching the opposite level, or 2R.
- Limit: in a strong trend RSI can stay overbought or oversold for a long time, and each new signal loses. Add a trend filter.
Rule set 2: short-period RSI with a trend filter
A mean reversion version popularised by Larry Connors and Cesar Alvarez.
- Filter: only buy when price is above the 200-period moving average.
- Entry: buy when the 2-period RSI closes below 10.
- Exit: price closes above the 5-period moving average.
- Limit: high win rate, small average win, occasional large loss. Costs matter a lot. See the mean reversion strategy guide.
Rule set 3: the 50-line momentum filter
- Bias: only long when the 14-period RSI on a higher timeframe (for example 1-hour) is above 50; only short when below.
- Entry: a pullback setup on the lower timeframe, such as a moving-average bounce or a breakout of the prior bar's high.
- Limit: the filter lags, so trades near turning points get filtered out late. It works best as a filter, not a trigger.
Rule set 4: divergences
- Bullish divergence: price makes a lower low while RSI makes a higher low.
- Entry: on confirmation, for example a break of the swing high between the two lows.
- Stop: below the second low.
- Limit: divergences can appear several times before a trend turns, and they're easy to spot in hindsight. Define the swing points exactly (how many bars either side) before testing.
Common mistakes with RSI strategies
- Treating overbought as "sell". In uptrends RSI is overbought often.
- Tuning the period and thresholds until the backtest looks best. Test a few sensible settings and check they all work similarly. See how to tell if a backtest is overfit.
- Ignoring costs on short-term versions.
- Using a higher-timeframe RSI value before that higher-timeframe bar has closed (look-ahead bias).
How to test an RSI strategy
- Write the full rules: period, thresholds, filter, entry, stop, exit, sizing and costs.
- Backtest over several years and check the trade count.
- Hold back an unseen period. See out-of-sample testing.
- Run it on several markets with the same settings.
- Run Monte Carlo to see the drawdowns a high win rate can hide.
In Strategy Lab, RSI, RSI divergences, Stochastic RSI and moving averages are built in, and indicators can be read on a higher timeframe without look-ahead. You can build these rule sets without code or describe them to TES, the AI strategy coach, then check the rules it reads back before the backtest runs.
Free tools for this: use the profit factor calculator to work out profit factor from your own trades and the Monte Carlo simulator to see the range of drawdowns your trade results could produce. They run in your browser, with no account needed.
Frequently asked questions
- What is the best RSI strategy?
- There's no single best one. Classic 30/70 signals tend to struggle in trends; short-period RSI with a trend filter, the 50-line as a direction filter, and confirmed divergences are the versions most often tested. Test each on your market with an unseen period.
- What is the best RSI setting for day trading?
- The default 14 is the most common. Shorter periods such as 2 to 5 react faster and are used for short-term mean reversion. Choose a setting, then check that nearby settings give similar results, so you aren't relying on one lucky value.
- Does RSI work for trading?
- RSI measures recent momentum; it doesn't predict reversals on its own. It works better as part of a rule set with a trend filter, a defined exit and realistic costs.
- Is RSI good for crypto or forex?
- It can be used on any market. Crypto often trends hard, which punishes plain overbought and oversold signals, so a trend filter matters more there.
Keep reading
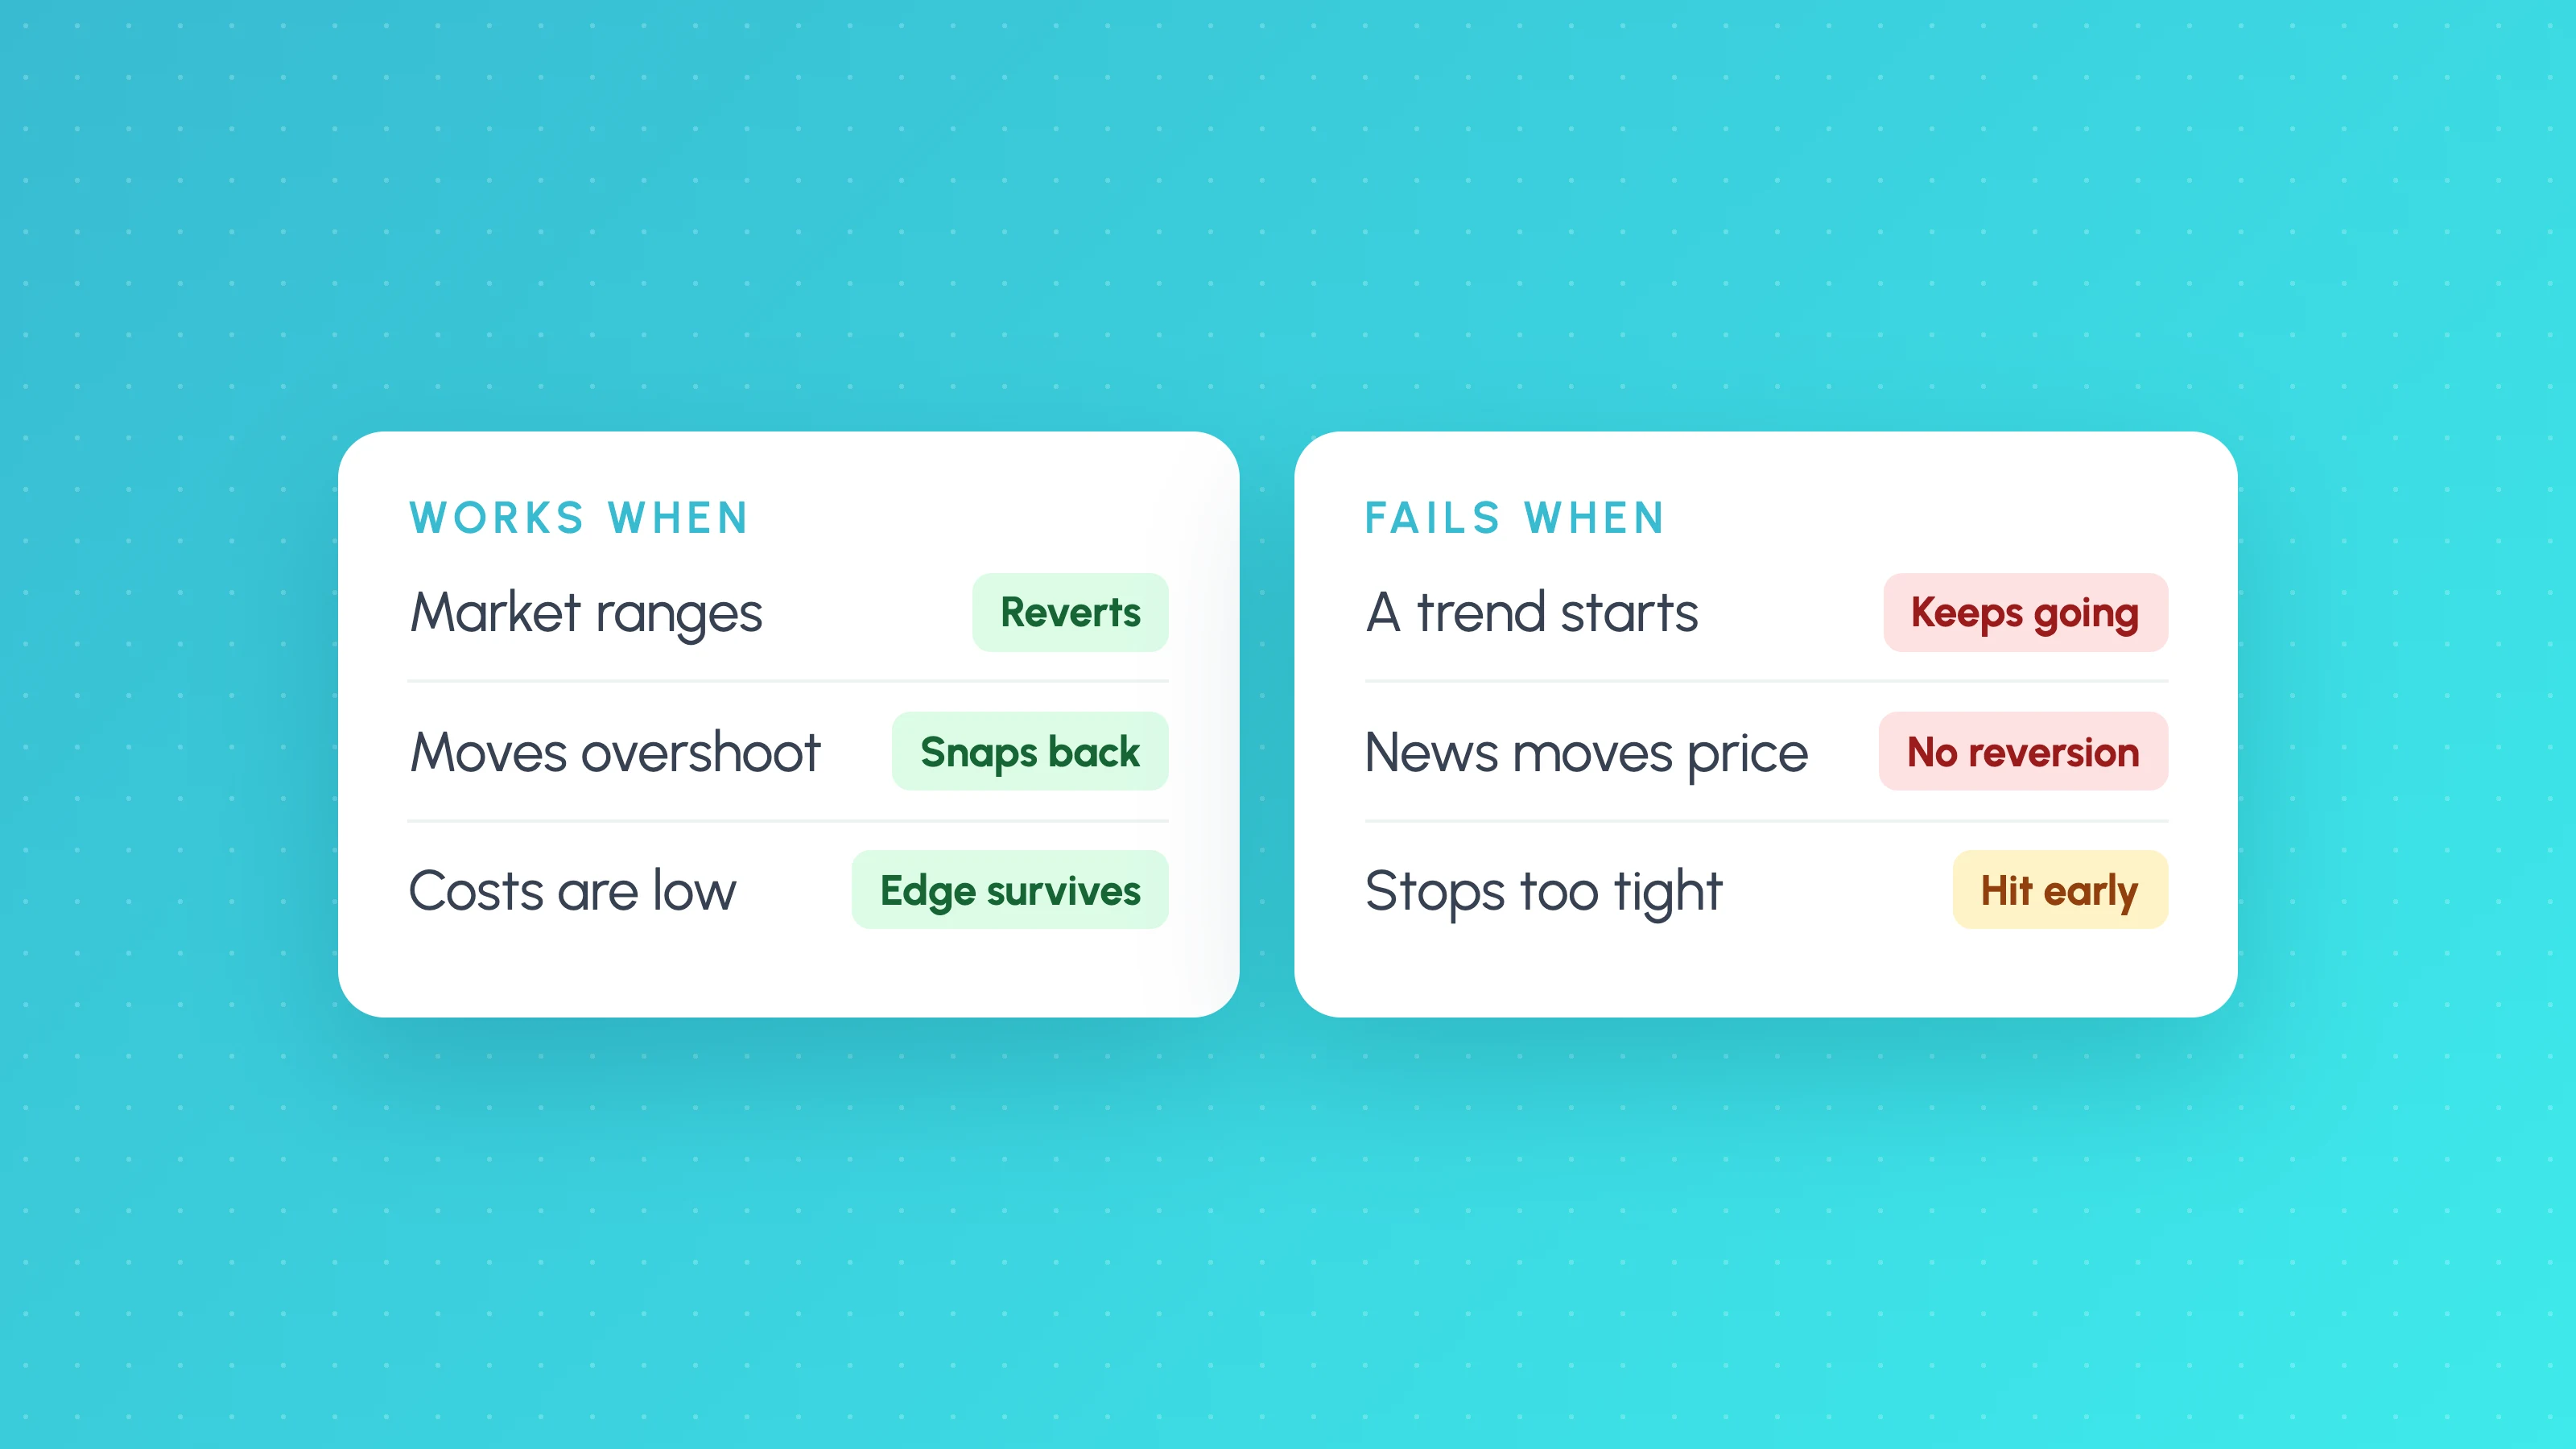 Strategies
Mean Reversion Trading Strategy: How It Works, Example Rules and Risks
Mean reversion trading explained: the RSI, Bollinger Band and moving-average versions, example rules you can test, why trends break them, and how to test one properly.
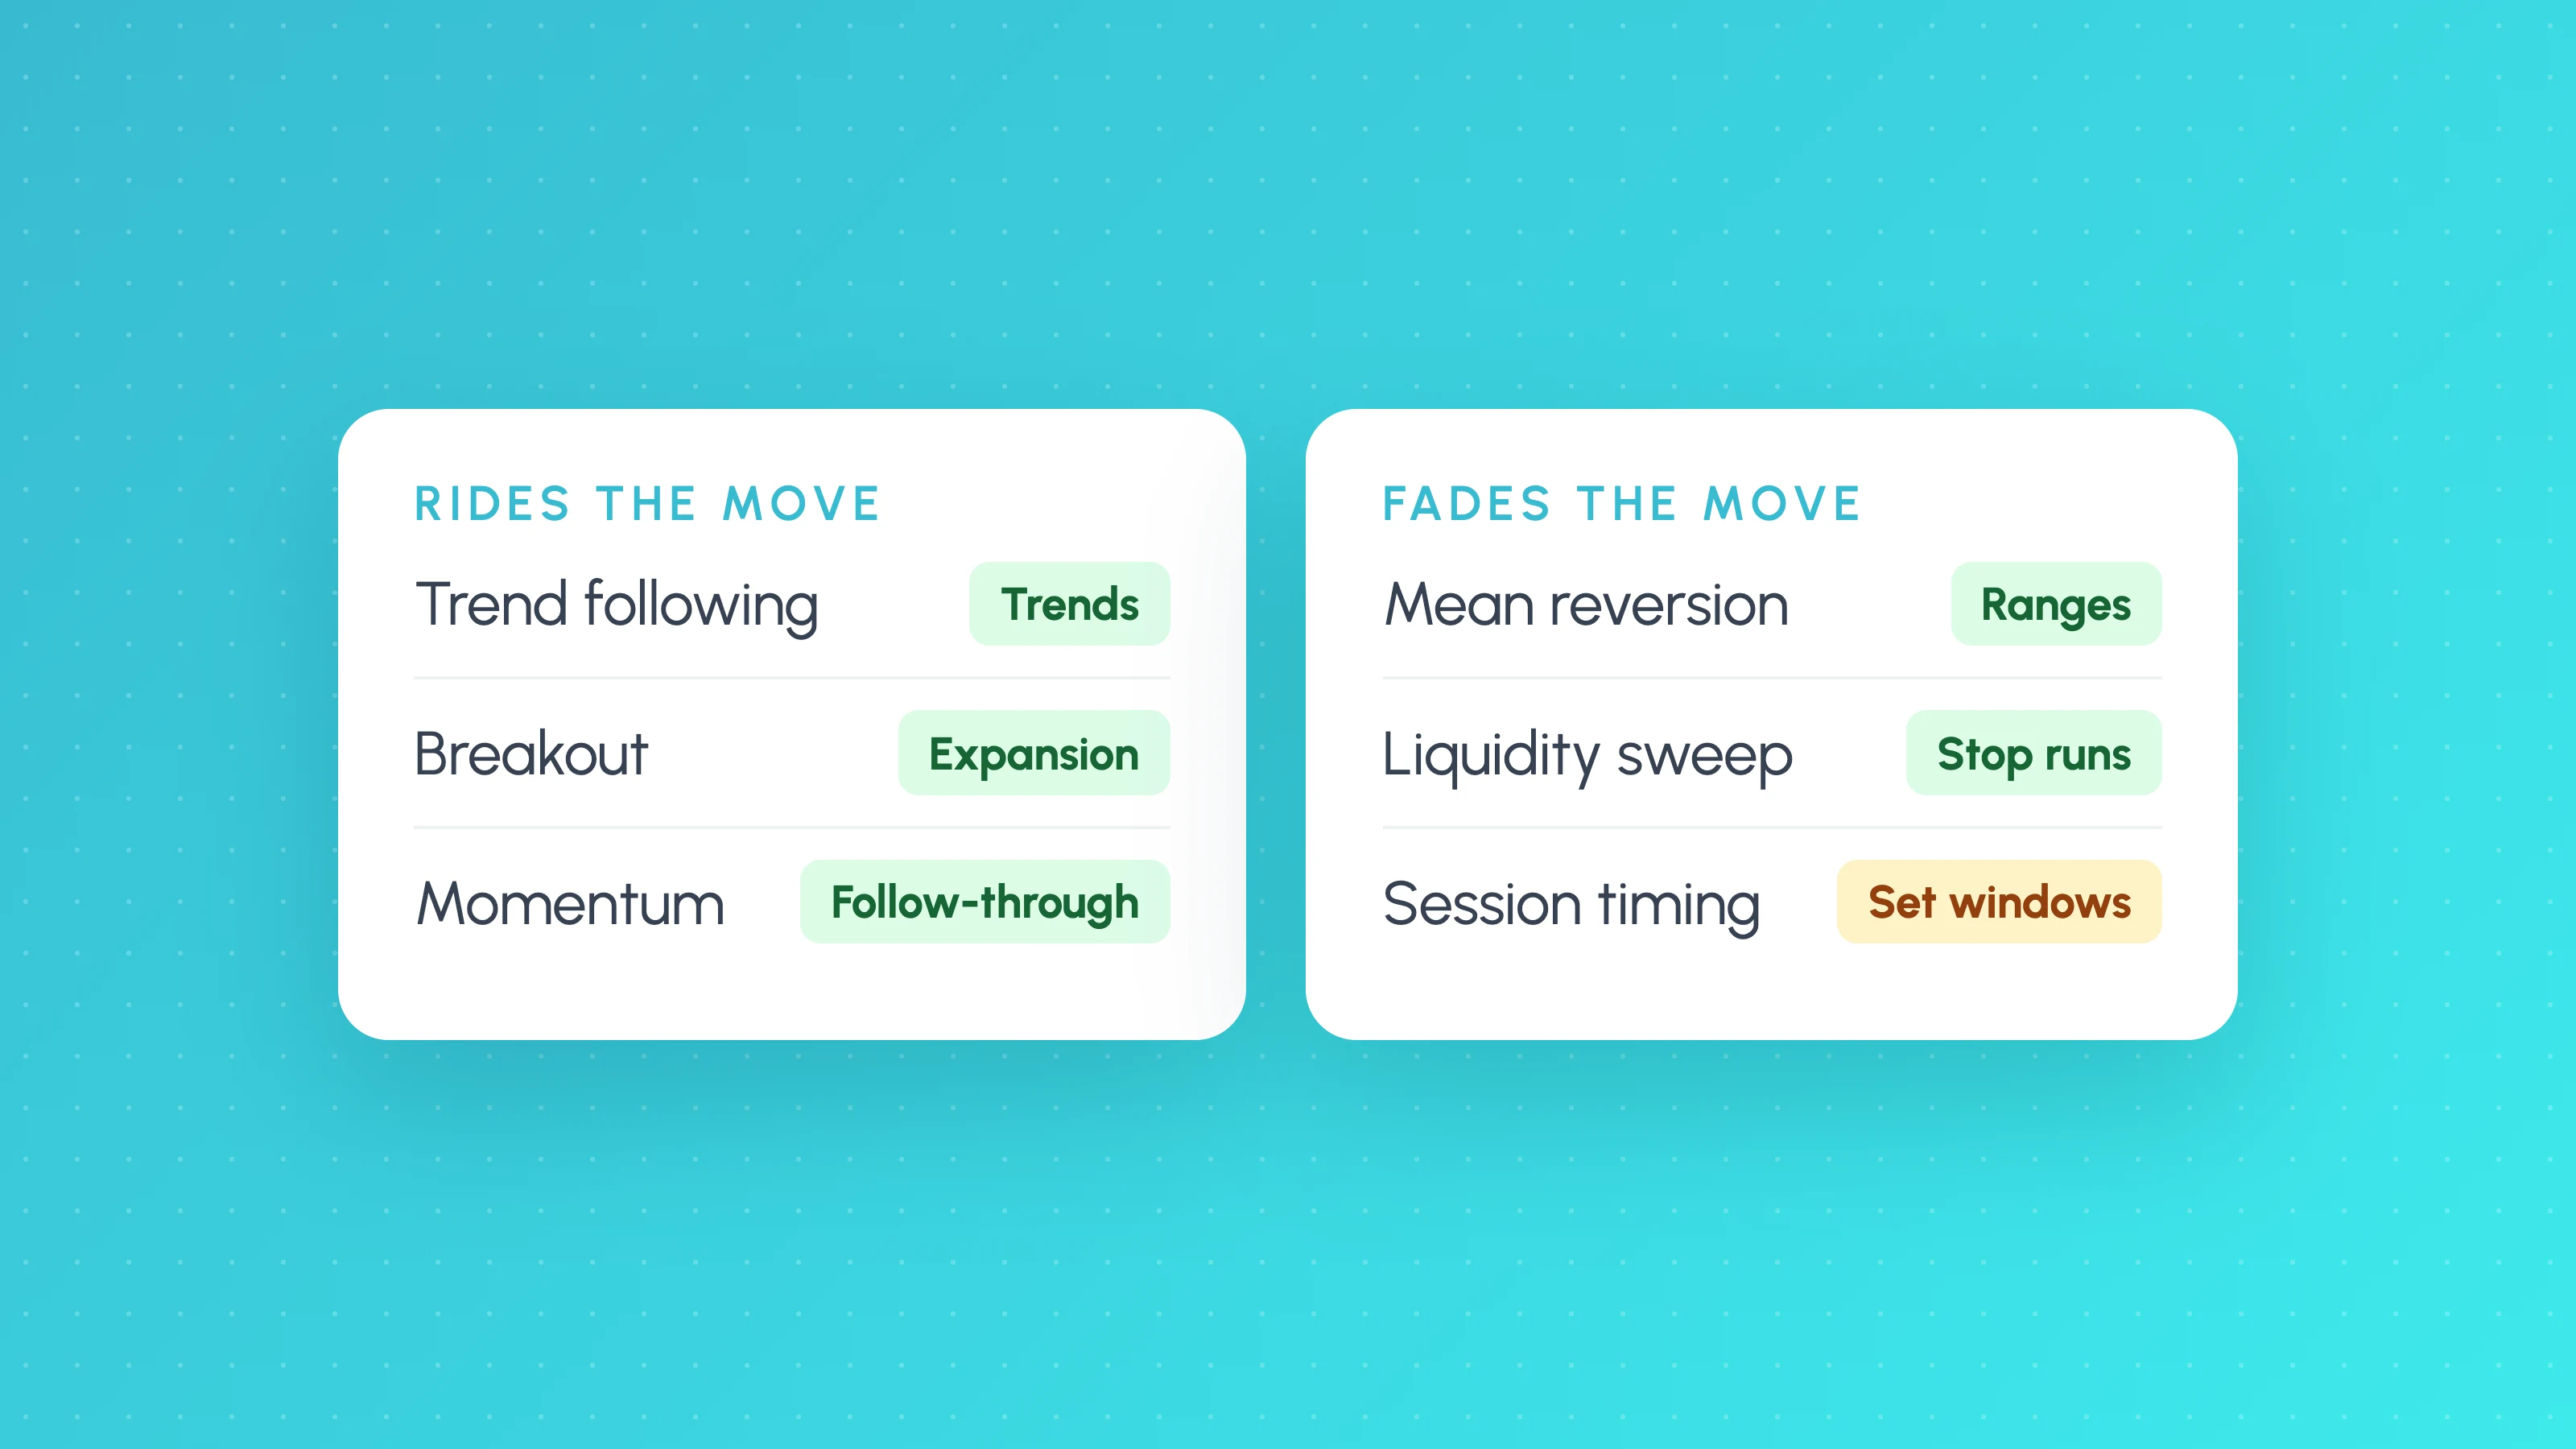 Strategies
Algorithmic Trading Strategies: 6 Types Explained, With Rules You Can Test
The main algorithmic trading strategies retail traders use: trend following, mean reversion, breakouts, momentum, session and liquidity sweep strategies, with example rules.
 Trading metrics
Win Rate vs Risk:Reward: The Breakeven Table for Algo Strategies
Win rate vs risk reward: breakeven win rate = 1 / (1 + R), so 1:2 needs 33.3% before costs. Table from 0.5R to 5R, with costs and spreadsheet formulas.