

Mean Reversion Trading Strategy: How It Works, Example Rules and Risks
Mean reversion trading explained: the RSI, Bollinger Band and moving-average versions, example rules you can test, why trends break them, and how to test one properly.
By Hristo Skulev · Updated · 5 min read
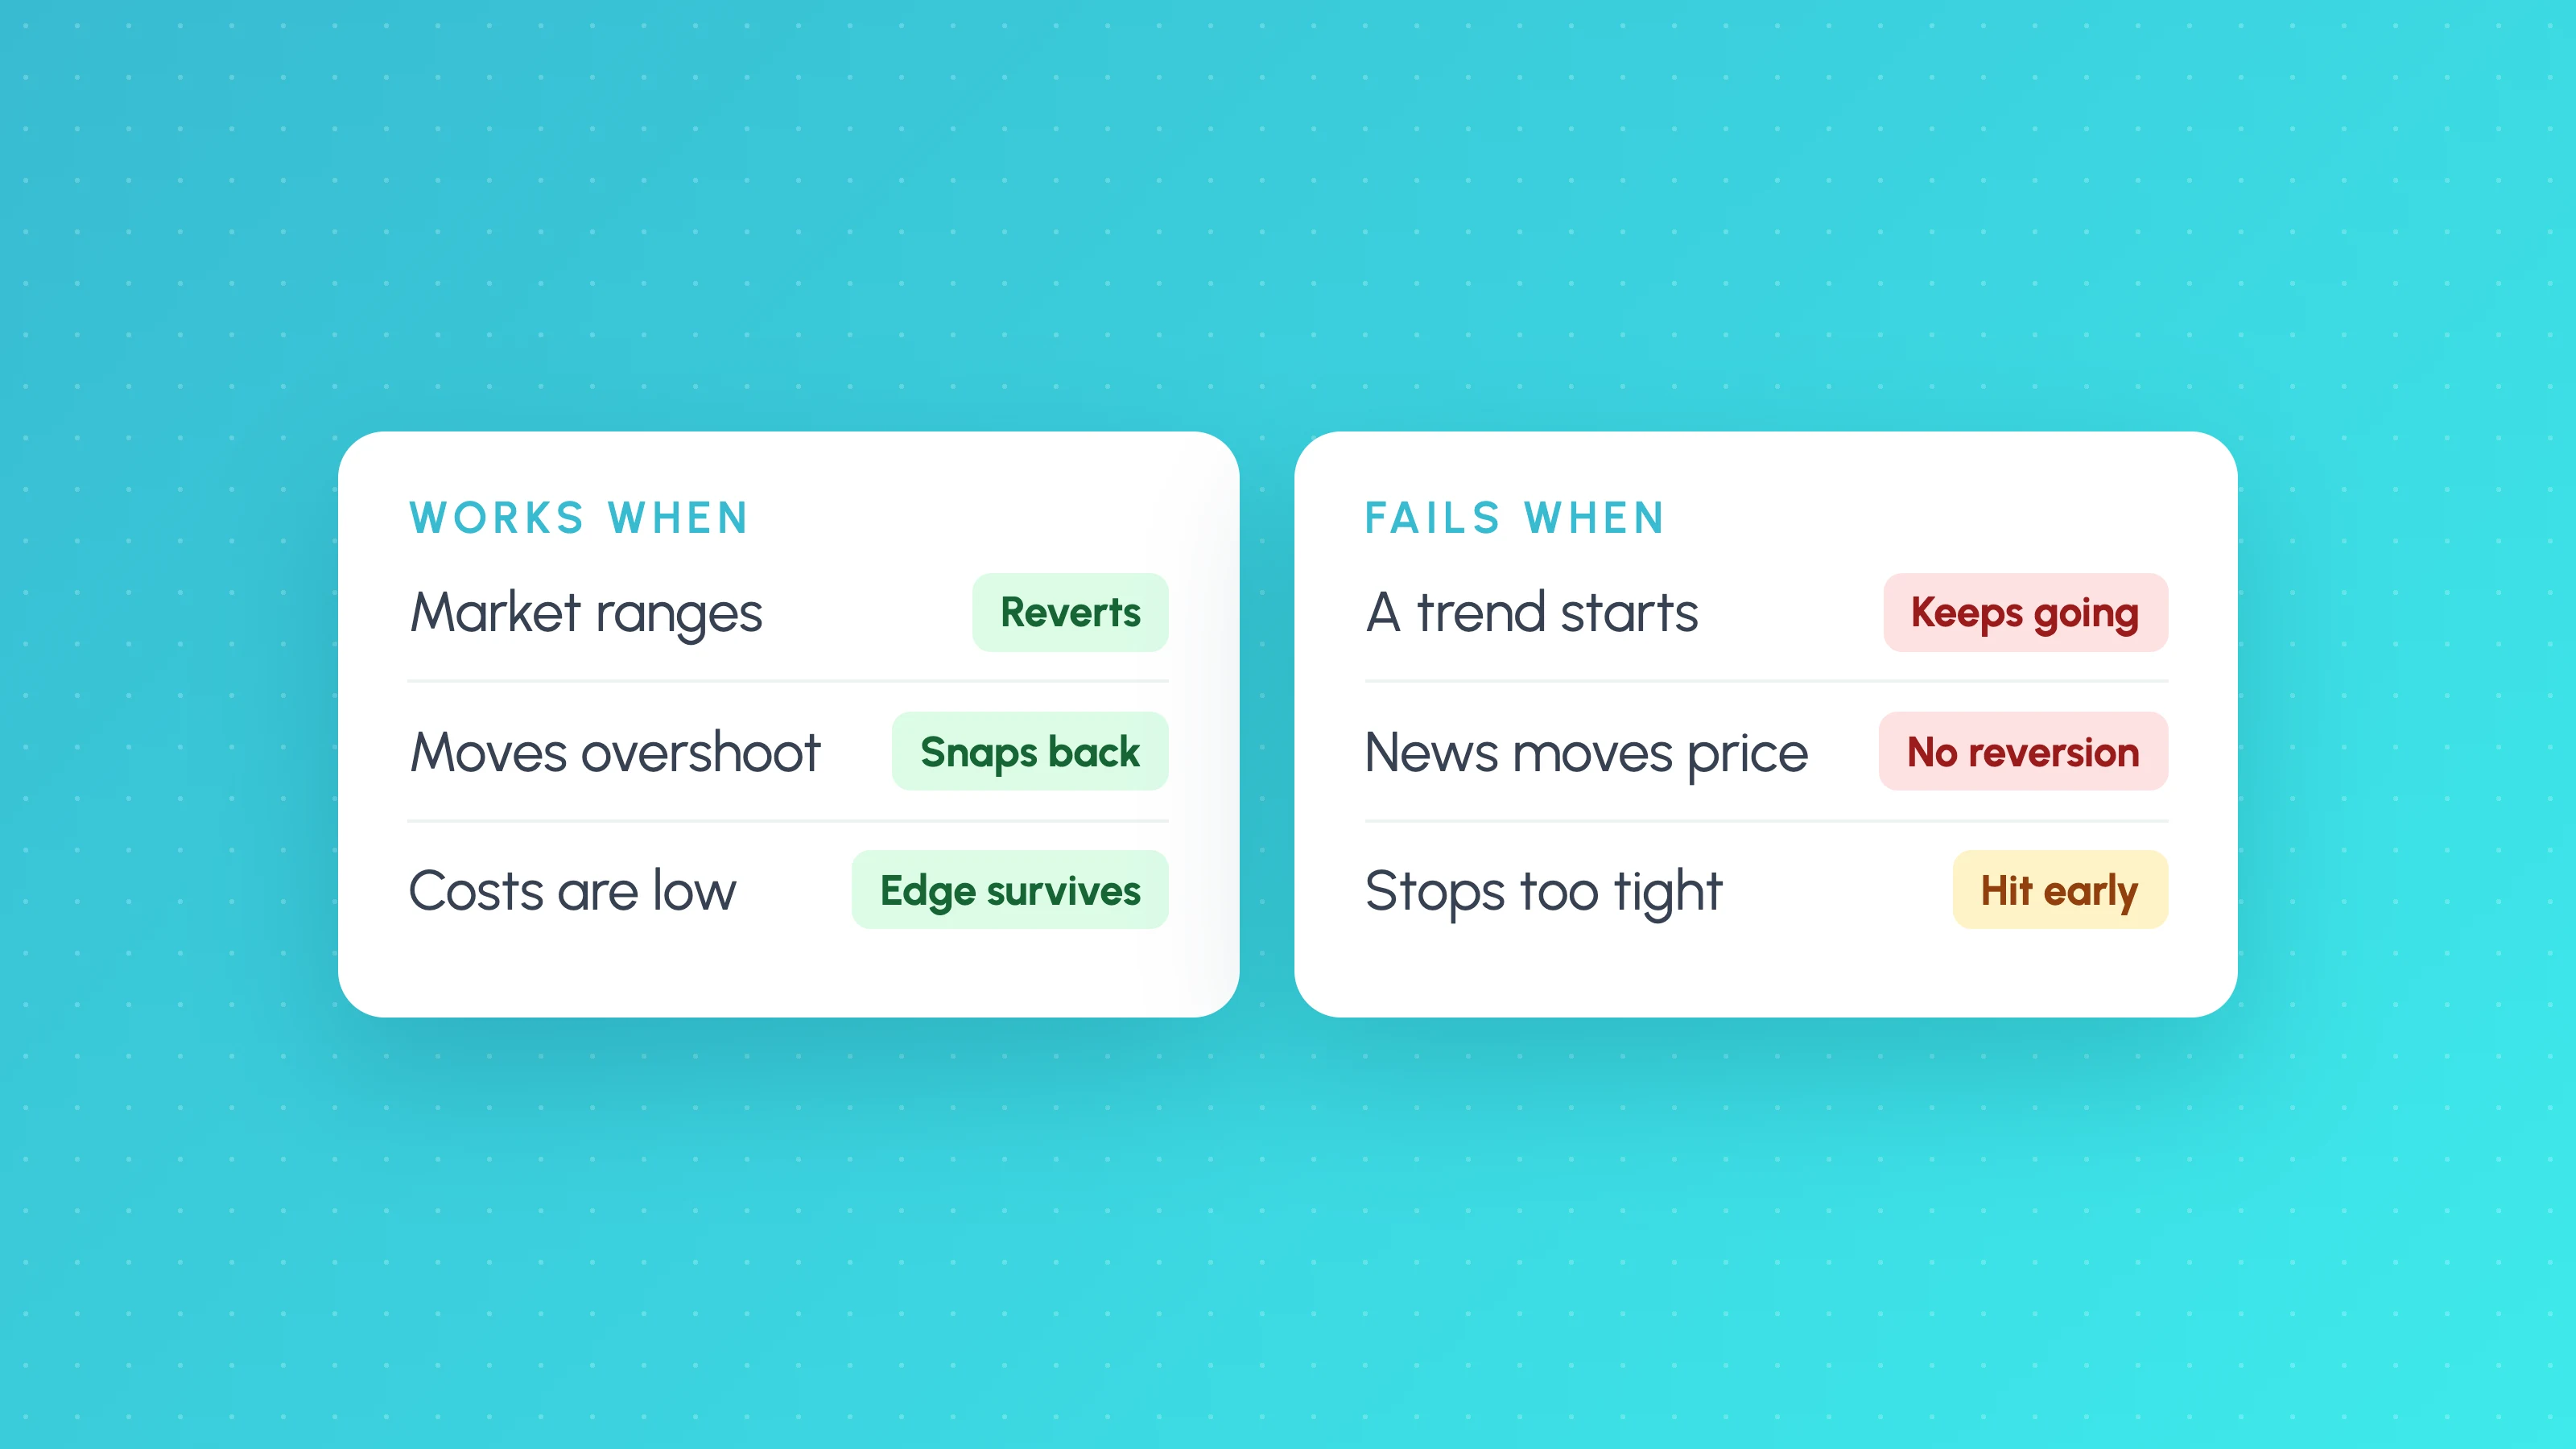
A mean reversion trading strategy bets that when price moves unusually far from its recent average, it is more likely to move back towards it than to keep going. You buy after a sharp drop and sell after a sharp rise, then exit once price returns towards the average. The usual tools are the RSI, Bollinger Bands and the distance from a moving average, and the strategy works best in ranging markets and worst when a strong trend starts.
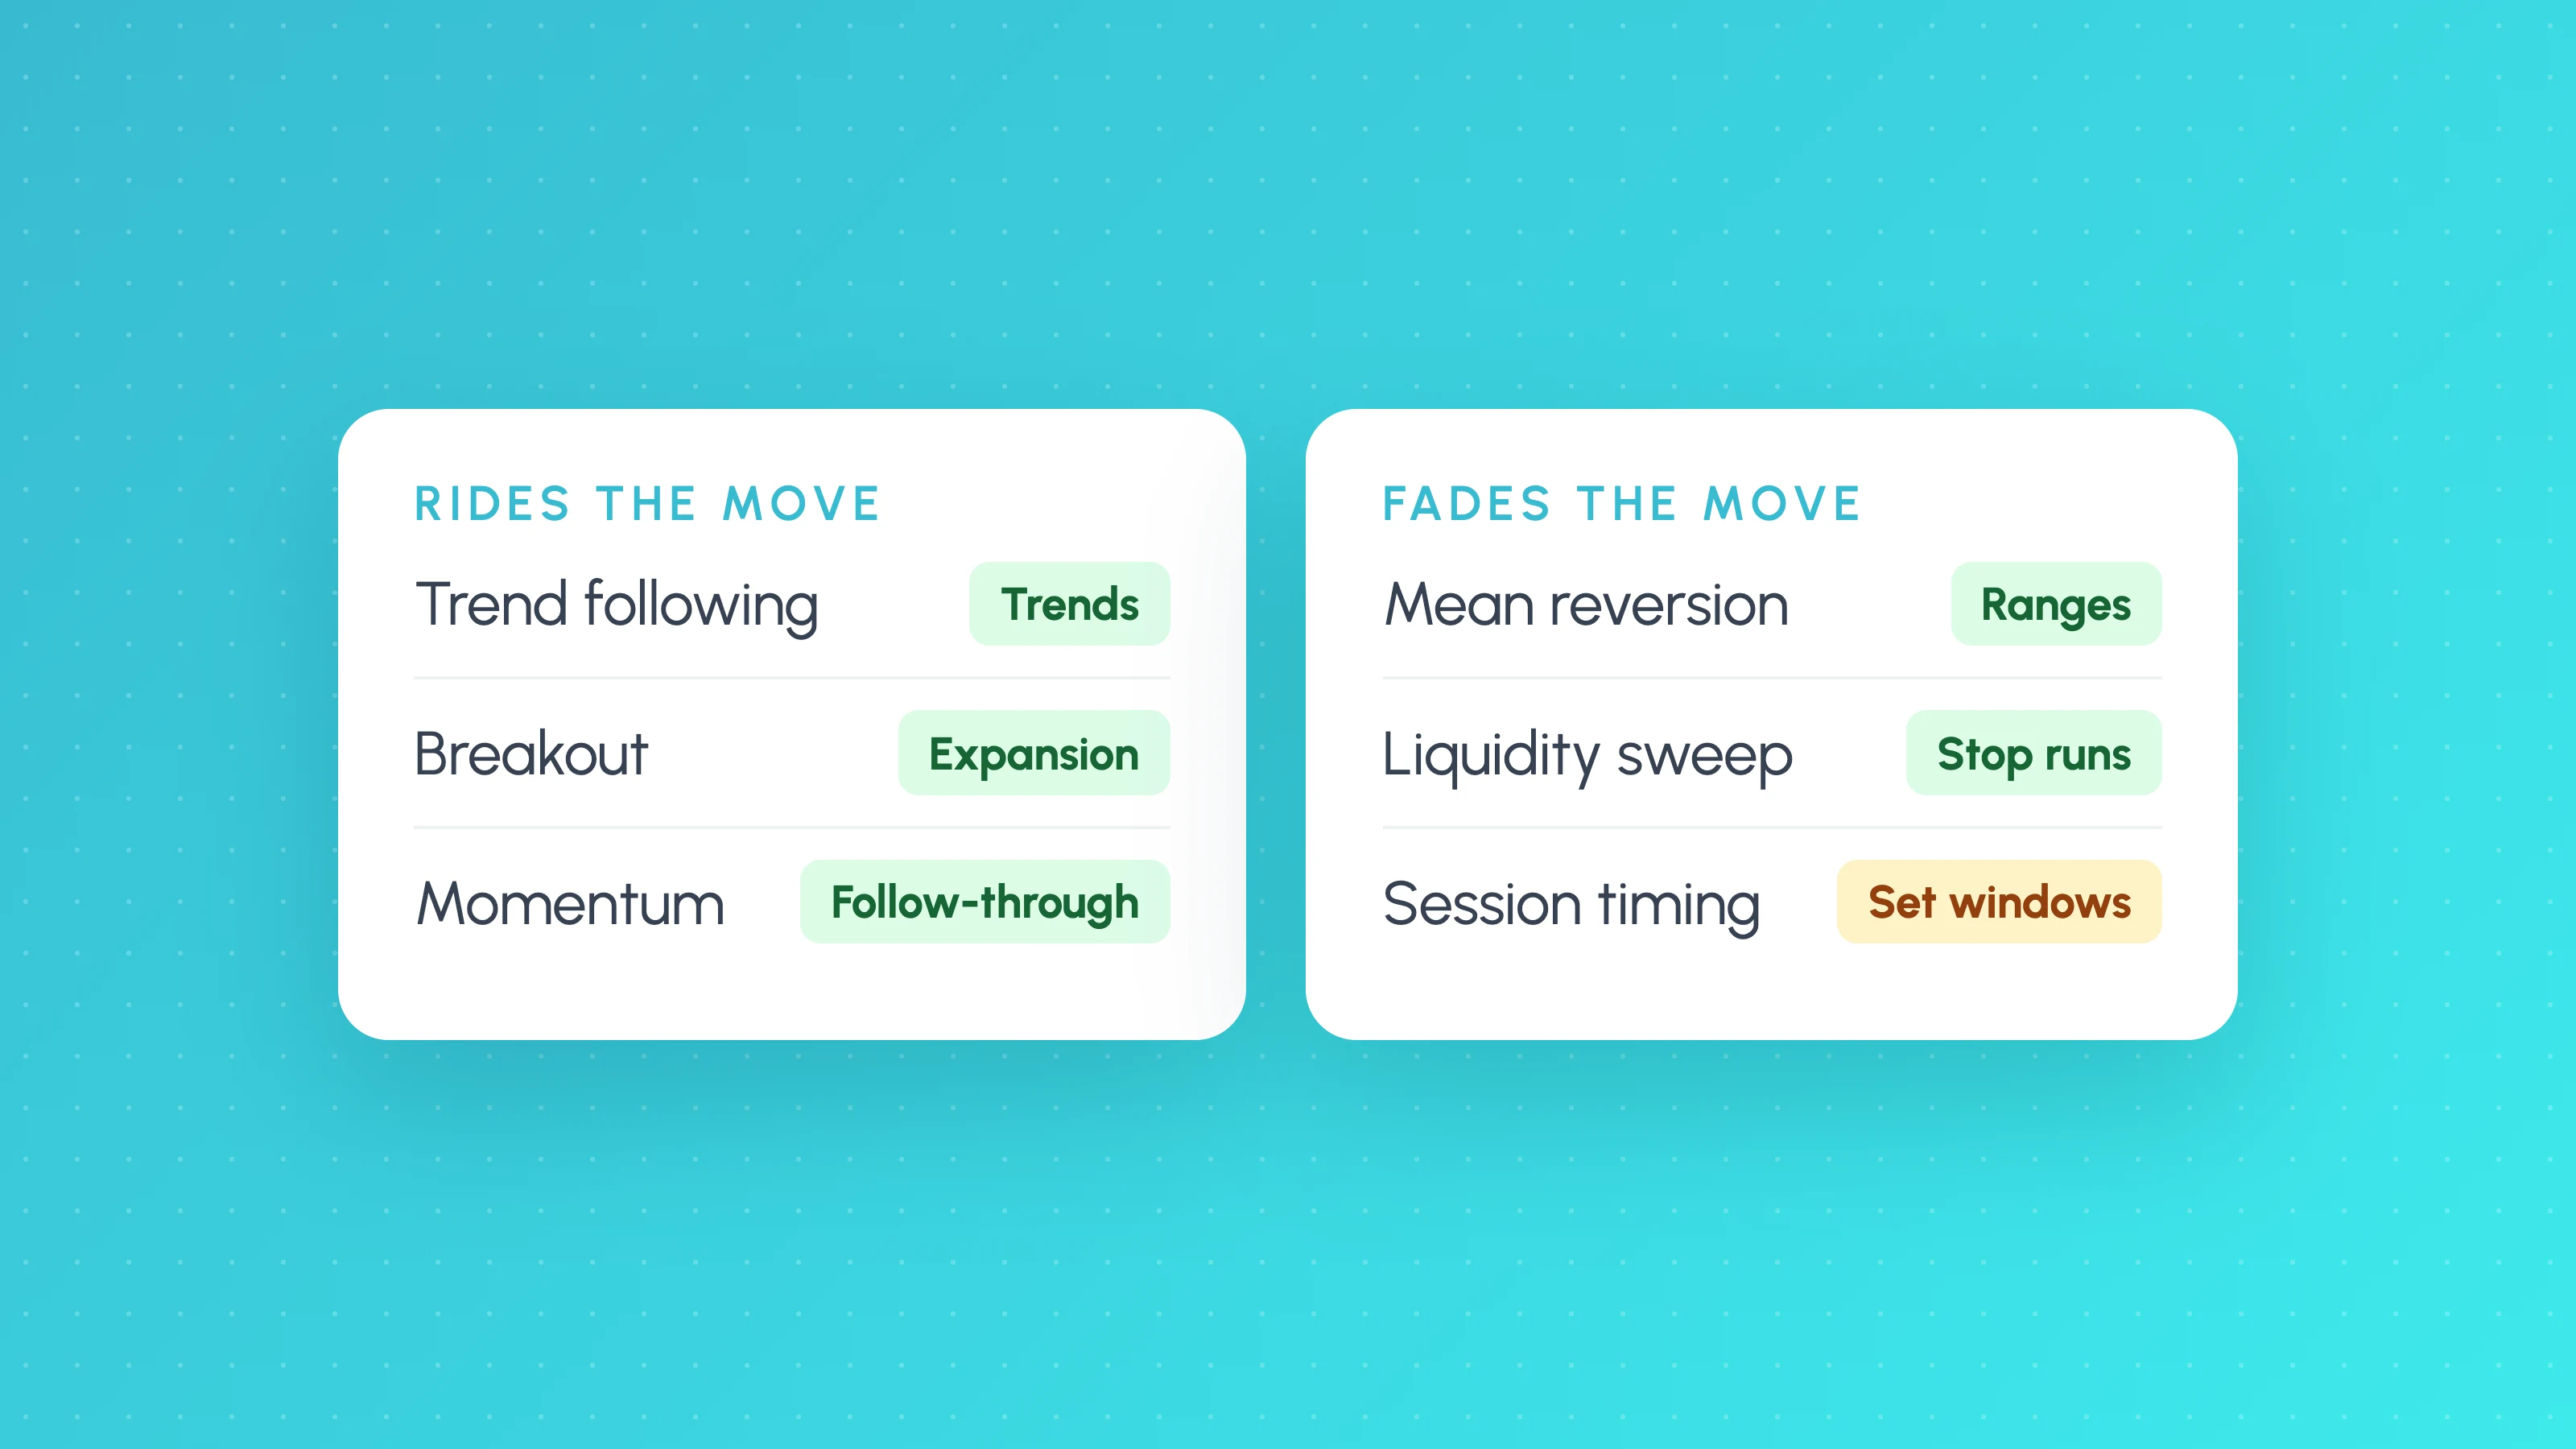
Mean reversion is the opposite of trend following, and the two have opposite profiles. Mean reversion strategies usually win often with small gains and take occasional large losses. Trend strategies usually lose often with small losses and catch occasional large wins. Neither is better: what matters is whether yours holds up on data it wasn't tuned on.
This is an educational description, not a recommendation. Backtests are not future results, and leveraged trading carries a high risk of loss.
Three common versions
1. Short-period RSI
The RSI was introduced by J. Welles Wilder in 1978, usually with a 14-period setting. Short-term mean reversion traders often use a much shorter setting, such as a 2-period RSI, a version popularised by Larry Connors and Cesar Alvarez in *Short Term Trading Strategies That Work* (2008).
Example rules to test:
- Trend filter: only buy when price is above the 200-period moving average.
- Entry: buy when the 2-period RSI closes below 10.
- Exit: sell when price closes above the 5-period moving average, or after 5 bars.
2. Bollinger Bands
John Bollinger's bands sit a set number of standard deviations (commonly 2) around a 20-period moving average.
Example rules to test:
- Regime filter: only trade when the market is ranging, measured by a regime or ADX-style filter.
- Entry: buy on a close below the lower band, sell short on a close above the upper band.
- Exit: at the middle band.
- Stop: 1.5 to 2 x ATR beyond entry, or a time stop.
3. Distance from a moving average
- Entry: buy when price closes more than 2 x ATR below the 20-period moving average.
- Exit: when price touches the moving average.
- Stop: a further 1 to 2 x ATR, or a time stop.
Why stops are tricky
A tight stop often gets hit just before price turns, because the strategy is buying into weakness by design. That is why many mean reversion systems use wide ATR stops, time stops or no fixed stop at all. The catch is that the losing trades, when they come, are large. Size positions so that the worst losing streak you can reasonably expect does not break your account, or a prop firm's daily loss limit. Our guide to win rate vs risk reward shows how a high win rate and a small average win interact.
Where mean reversion fails
- When a trend starts. A market that "should" revert keeps going, and each new signal adds to a losing position. A trend or regime filter is the main defence.
- On news. A move caused by new information, such as an earnings surprise or a central bank decision, often doesn't revert.
- Costs. Average wins are small, so commission, spread and slippage can remove the edge entirely. See how much slippage to assume.
- Short samples. A strategy that wins 80% of the time can go a long time between big losses, so a short backtest may not include one. Check the worst loss, not only the win rate.
Which markets suit it
Mean reversion is usually tested on stock indices, which have historically spent long stretches in ranges with a long-term upward drift, and on currency pairs during quieter sessions. It tends to struggle in markets that trend hard, such as some commodities and crypto in strong moves. Test it on several related markets: an edge that only exists on one market and one timeframe is more likely to be a fluke.
How to test a mean reversion strategy
- Define the "mean" and the "stretch" exactly: which average, which indicator, which threshold.
- Add the trend or regime filter before testing, not after you see which losses hurt.
- Use realistic costs. Then double them and see whether anything is left.
- Hold back an unseen period. See out-of-sample testing.
- Run Monte Carlo to see the drawdowns a high win rate can hide.
- If you trade a prop account, check the strategy's largest single-day loss against the daily loss limit.
In Strategy Lab you can build the RSI and moving-average versions without code, with ATR stops, time exits and a market-regime filter, or describe the strategy to TES, the AI strategy coach, and check the rules it reads back. Strategy Lab holds back the last 30% of the data as an unseen period and shows trading costs, Monte Carlo and other-market results on the same run.
Free tools for this: use the profit factor calculator to work out profit factor from your own trades and the Monte Carlo simulator to see the range of drawdowns your trade results could produce. They run in your browser, with no account needed.
Frequently asked questions
- What is a mean reversion trading strategy?
- A strategy that buys after price falls unusually far below its recent average and sells after it rises unusually far above it, expecting price to move back towards the average. Common tools are the RSI, Bollinger Bands and distance from a moving average.
- Does mean reversion trading work?
- It can in ranging markets, and it loses money when a strong trend starts. Most mean reversion strategies win often with small gains and take occasional large losses, so a backtest needs enough history to include those losses.
- What is the best indicator for mean reversion?
- There is no single best one. Short-period RSI, Bollinger Bands and the distance from a moving average in ATR terms are the most common. A trend or regime filter often matters more than the choice of indicator.
- Is mean reversion better than trend following?
- Neither is better in general. They make money in opposite market conditions, and some traders run both so one covers the other's bad periods. Test each on your market and timeframe.
Keep reading
 Strategies
Algorithmic Trading Strategies: 6 Types Explained, With Rules You Can Test
The main algorithmic trading strategies retail traders use: trend following, mean reversion, breakouts, momentum, session and liquidity sweep strategies, with example rules.
 Trading metrics
Win Rate vs Risk:Reward: The Breakeven Table for Algo Strategies
Win rate vs risk reward: breakeven win rate = 1 / (1 + R), so 1:2 needs 33.3% before costs. Table from 0.5R to 5R, with costs and spreadsheet formulas.
 Trading metrics
How Much Slippage Should You Assume in a Backtest? (and How to Measure It on Live Fills)
How much slippage in algo trading? Start at 1-2 ticks per side on liquid futures, more for stops and news, then measure real fills to replace the guess.