

Opening Range Breakout Strategy: Rules, Variations and How to Test It
The opening range breakout (ORB) strategy explained: the 5, 15 and 30-minute range, entry, stop and target rules, the filters that cut false breakouts, and how to test it.
By Hristo Skulev · Updated · 7 min read
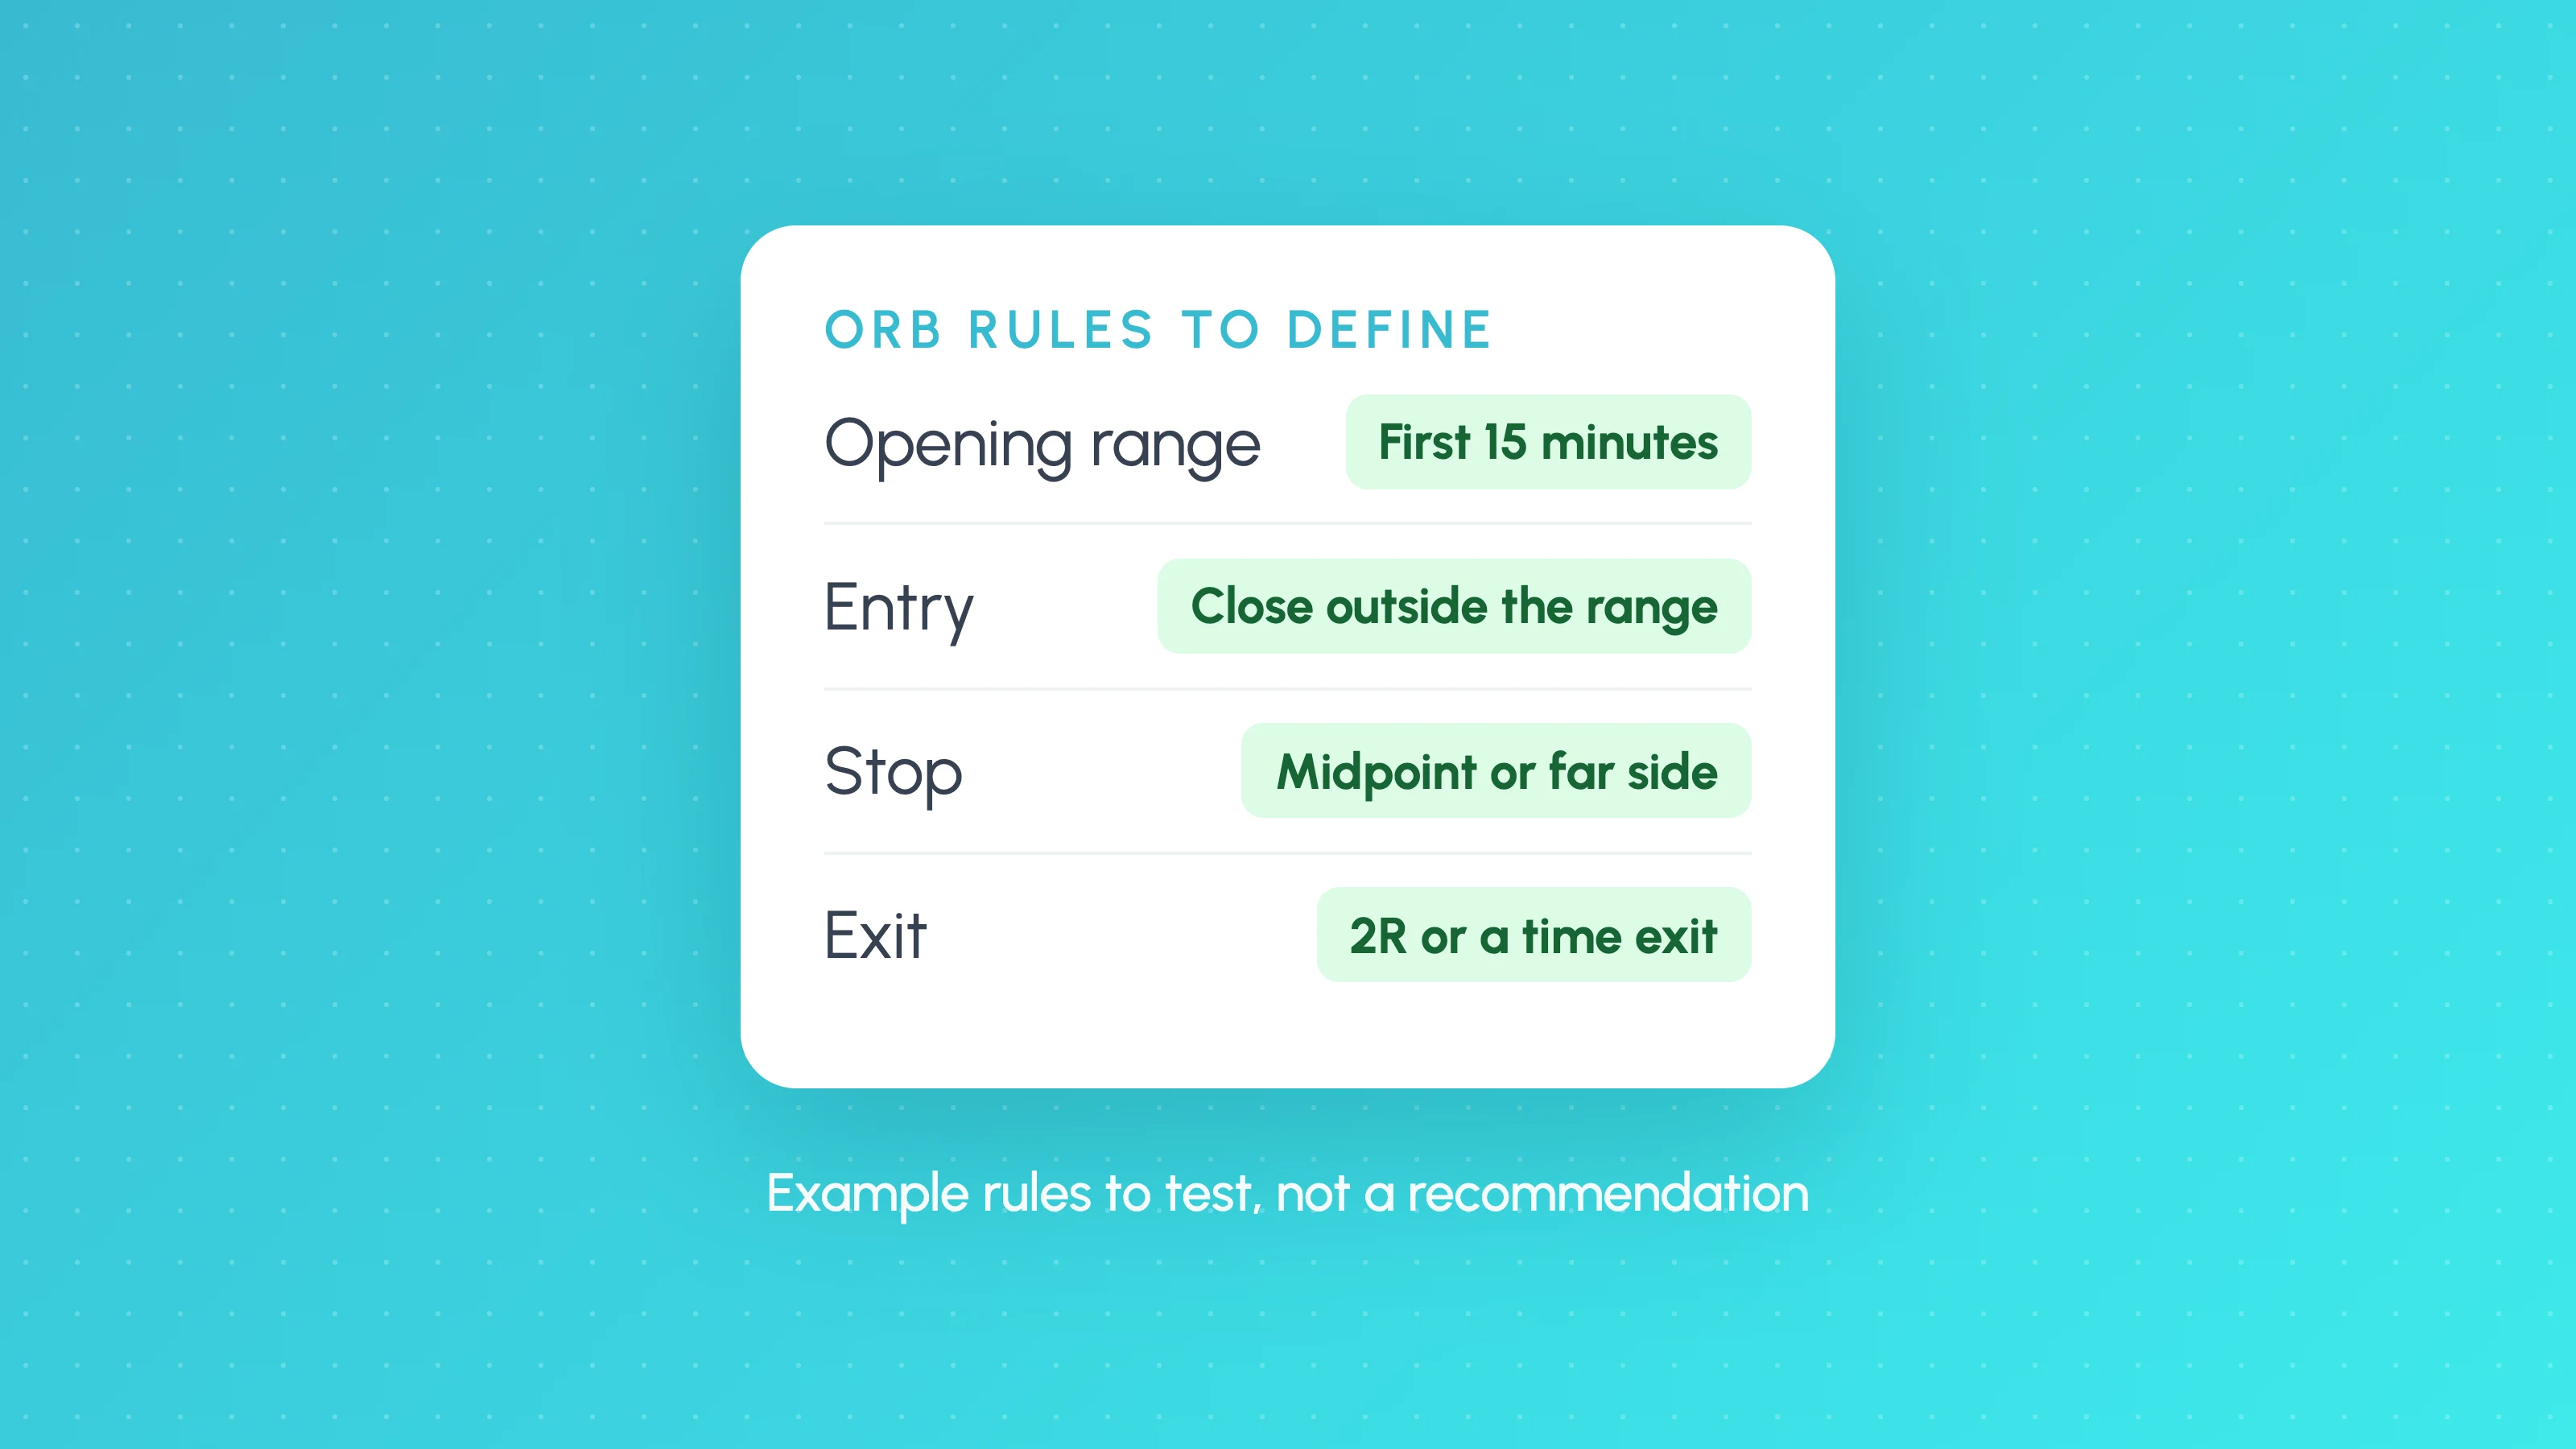
The opening range breakout (ORB) strategy marks the high and low of the first few minutes after a market opens, usually 5, 15 or 30 minutes, and trades in the direction price breaks out of that range. A long is triggered when price closes above the range high, a short when it closes below the range low, with the stop on the other side of the range or at its midpoint. It is popular with index futures and US stock traders because the open is when volume, volatility and news are most concentrated.
The idea is old. Toby Crabel's 1990 book *Day Trading with Short Term Price Patterns and Opening Range Breakout* studied how often markets moved away from the opening range, and the concept has been used by systematic traders ever since. This guide sets out the rules precisely enough to test, the choices that change the results most, and where ORB usually fails.
This is an educational description, not a recommendation. Backtests are not future results, and leveraged trading carries a high risk of loss.
The basic rules
| Rule | A common starting point |
|---|---|
| Market | A liquid index future or CFD (Nasdaq 100, S&P 500, Dow) or a liquid stock |
| Open | 9:30am New York for US markets; the London open (8am London) for European indices and currencies |
| Range | The high and low of the first 15 minutes |
| Entry | A candle close above the range high (long) or below the range low (short) |
| Entry timeframe | 5-minute or 1-minute candles |
| Stop | The opposite side of the range, or the range midpoint |
| Target | 1.5R to 2R, or a multiple of the range height |
| Time exit | Close any open trade by a set time, such as 11:30am or the session close |
| Trades per day | One, or one in each direction |
Every one of these is a choice, and each one changes the result. Write down all of them before testing, or the backtest will quietly test something different from what you meant.
The choices that matter most
Range length: 5, 15 or 30 minutes
A short range (5 minutes) gives tighter stops and more signals, but more of them are noise. A long range (30 minutes) gives fewer, cleaner breaks with wider stops, and by the time it is set some of the day's move may be over. Fifteen minutes is the most common compromise. Test all three, but judge them on an unseen period, not on which looked best on the data you tuned with.
Entry timeframe
A 15-minute range with entries on the 1-minute chart reacts fastest, but 1-minute closes produce more false breaks. Entries on the 5-minute chart are slower and cleaner. If you test both, compare the results after costs: faster entries usually mean more trades and more commission and slippage.
Close or touch
Entering the moment price touches the range edge gets the best price on real breakouts and the worst outcome on fake ones. Waiting for a candle to close outside the range filters out many wicks. Most systematic versions use a close.
Stop placement
A stop at the opposite side of the range gives the trade room but can make the risk large on wide-range days. A stop at the midpoint halves the risk but gets hit more often. Some traders skip days when the range is unusually wide relative to recent days, measured with ATR.
Filters that reduce false breakouts
- Higher-timeframe bias: only take longs when price is above a 1-hour or daily moving average, and shorts below it.
- Range size: skip days when the opening range is very narrow (likely to chop) or very wide (stop too far away), relative to ATR.
- Prior-day levels: skip or reduce size when the breakout runs straight into the prior day's high or low.
- Day of week and news: check results by weekday, and around scheduled data releases such as US CPI and payrolls.
- One trade per day: if the first break fails, many ORB versions do not re-enter.
Each filter you add should have a reason before you test it. Adding filters until the backtest looks good is the fastest way to overfit, so keep track of how many you tried. Our guide to how many trades a backtest needs explains why fewer trades after filtering can make results less trustworthy, not more.
Where ORB usually fails
- Choppy, low-volume days, where price breaks both sides of the range and stops out each time.
- News-driven opens, where the first 15 minutes are unusually wide and the real move happened before the range was set.
- Costs on small targets. On short timeframes, commission, spread and slippage can be a large share of each win. Our guide to slippage in algo trading shows how much to assume.
- Changing market hours. Extended and near-24-hour trading can change how much of the move happens before the cash open. See Nasdaq 24-hour trading for algo strategies.
Does the opening range breakout strategy work? Why success rates differ
You will find very different ORB "success rates" quoted in videos, forums and courses. They aren't comparable, because each one depends on the market, the range length, whether entries wait for a close, where the stop and target sit, the period tested and whether costs were included. A version with a wide target and a tight stop can be profitable with a low win rate; a version with a small target can win often and still lose money after costs. Treat any quoted success rate as a description of one specific rule set on one market, not of "the ORB strategy".
The useful question is whether your exact rules hold up on data they weren't tuned on, after costs. That is something only your own backtest, with an unseen period, can answer.
ORB indicators on TradingView
TradingView has many community-built opening range indicators that draw the range on the chart, which is useful for seeing the idea. An indicator that draws the range is not a strategy: it doesn't define the entry, stop, target, time exit or sizing, so it can't tell you whether the trades would have made money. To find that out, turn the rules into a strategy and backtest them.
How to test an opening range breakout
- Write the full rule set, including the open time and timezone, range length, entry timeframe, close or touch, stop, target, time exit and trades per day.
- Backtest it with realistic costs on several years of intraday data, so it covers quiet and volatile periods.
- Hold back an unseen period and only look at it once you have finished tuning. See out-of-sample testing.
- Run it on related markets. An ORB edge on the Nasdaq 100 that disappears completely on the S&P 500 deserves suspicion.
- Stress test it with Monte Carlo and doubled costs.
- If you trade a prop account, check the strategy's worst days against the firm's daily loss limit. ORB losses cluster on choppy days, and a few of those in a row can break a challenge.
In Strategy Lab, the opening range breakout is a built-in setup and one of the starter packs. You can also describe it to TES, the AI strategy coach, for example: "15-minute opening range from the New York open, enter on a 5-minute close outside the range, stop at the midpoint, 2R target, flat by 11:30". Strategy Lab reads the rules back in plain English before the backtest runs, so you can check the open time, range length and entry timeframe are what you meant. On the Free plan the smallest candle is 5 minutes, so a 15-minute range with 5-minute entries works for free; 1-minute entries need a paid plan. You can then run the result through a prop-firm account test.
Free tools for this: use the profit factor calculator to work out profit factor from your own trades and the Monte Carlo simulator to see the range of drawdowns your trade results could produce. They run in your browser, with no account needed.
Frequently asked questions
- What is the opening range breakout strategy?
- A strategy that marks the high and low of the first few minutes after the market opens, usually 5, 15 or 30 minutes, and trades the direction price breaks out of that range, with a stop on the other side of the range or at its midpoint.
- What is the best time frame for an opening range breakout?
- There is no single best one. A 15-minute range is the most common, with entries on 5-minute or 1-minute candles. Shorter ranges give more signals and more false breaks; longer ranges give fewer, cleaner signals with wider stops. Test several on your market and judge them on unseen data.
- Does the opening range breakout strategy work?
- It can on some markets and periods, and it fails on choppy days and when costs are high relative to the target. Whether it works on your market, timeframe and costs is something only a backtest with an unseen period and realistic costs can tell you.
- Can I backtest an ORB strategy without coding?
- Yes. No-code backtesters let you set the range, entry and exit rules without writing code. In Tessera's Strategy Lab the opening range breakout is a built-in setup, and the Free plan supports a 15-minute range with 5-minute entries.
Keep reading
 Strategies
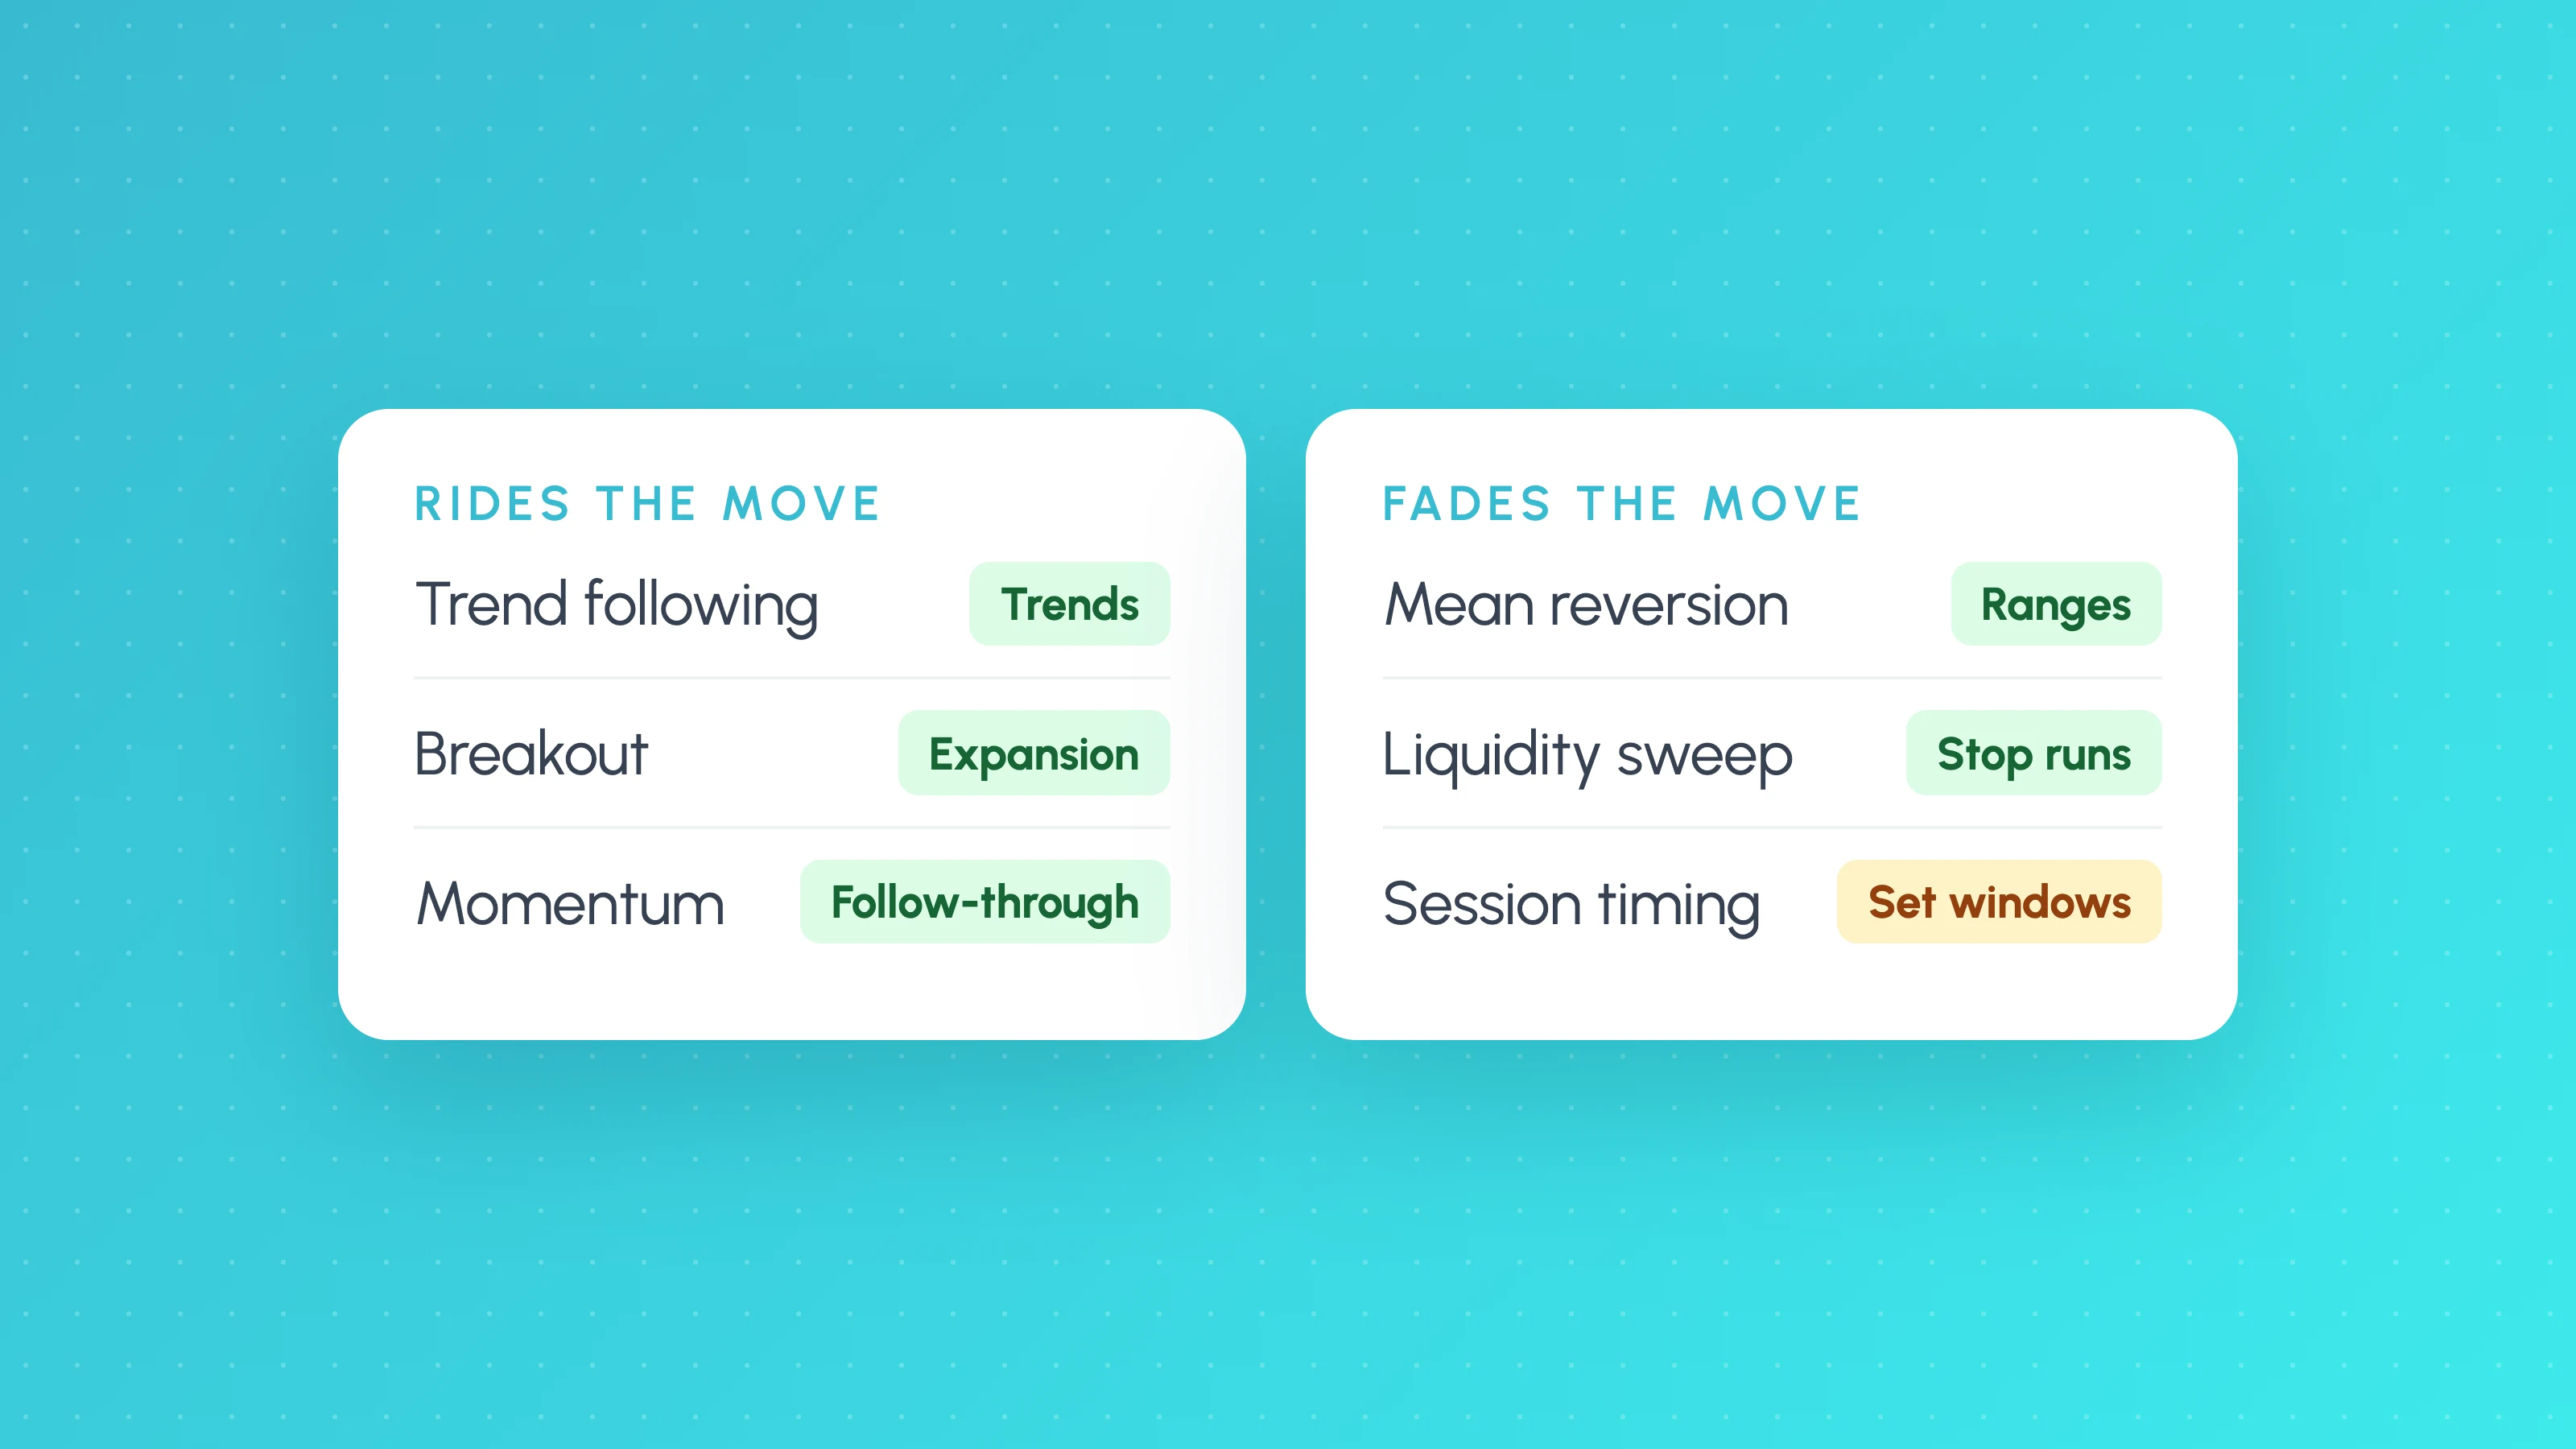
Algorithmic Trading Strategies: 6 Types Explained, With Rules You Can Test
The main algorithmic trading strategies retail traders use: trend following, mean reversion, breakouts, momentum, session and liquidity sweep strategies, with example rules.
 Algo trading
23-Hour Stock Trading Starts 6 December: What It Means for Algo Strategies
Nasdaq 24 hour trading (23/5) is set to start 6 December 2026 with a 9pm-4am ET session. What it changes for algo backtests, session filters and fills.
 TradingView backtests
How Many Trades Do You Need for a Valid Backtest?
How many trades a backtest needs: rules of thumb, the t-statistic formula with a worked example, a table by edge size, per-bucket minimums and multiple testing.