

Trend Following Strategy: Rules, Examples and Why It's Hard to Stick With
Trend following trading explained: moving-average and channel breakout rules, ATR stops and trailing exits, why win rates are low, and how to test a trend strategy properly.
By Hristo Skulev · Updated · 4 min read
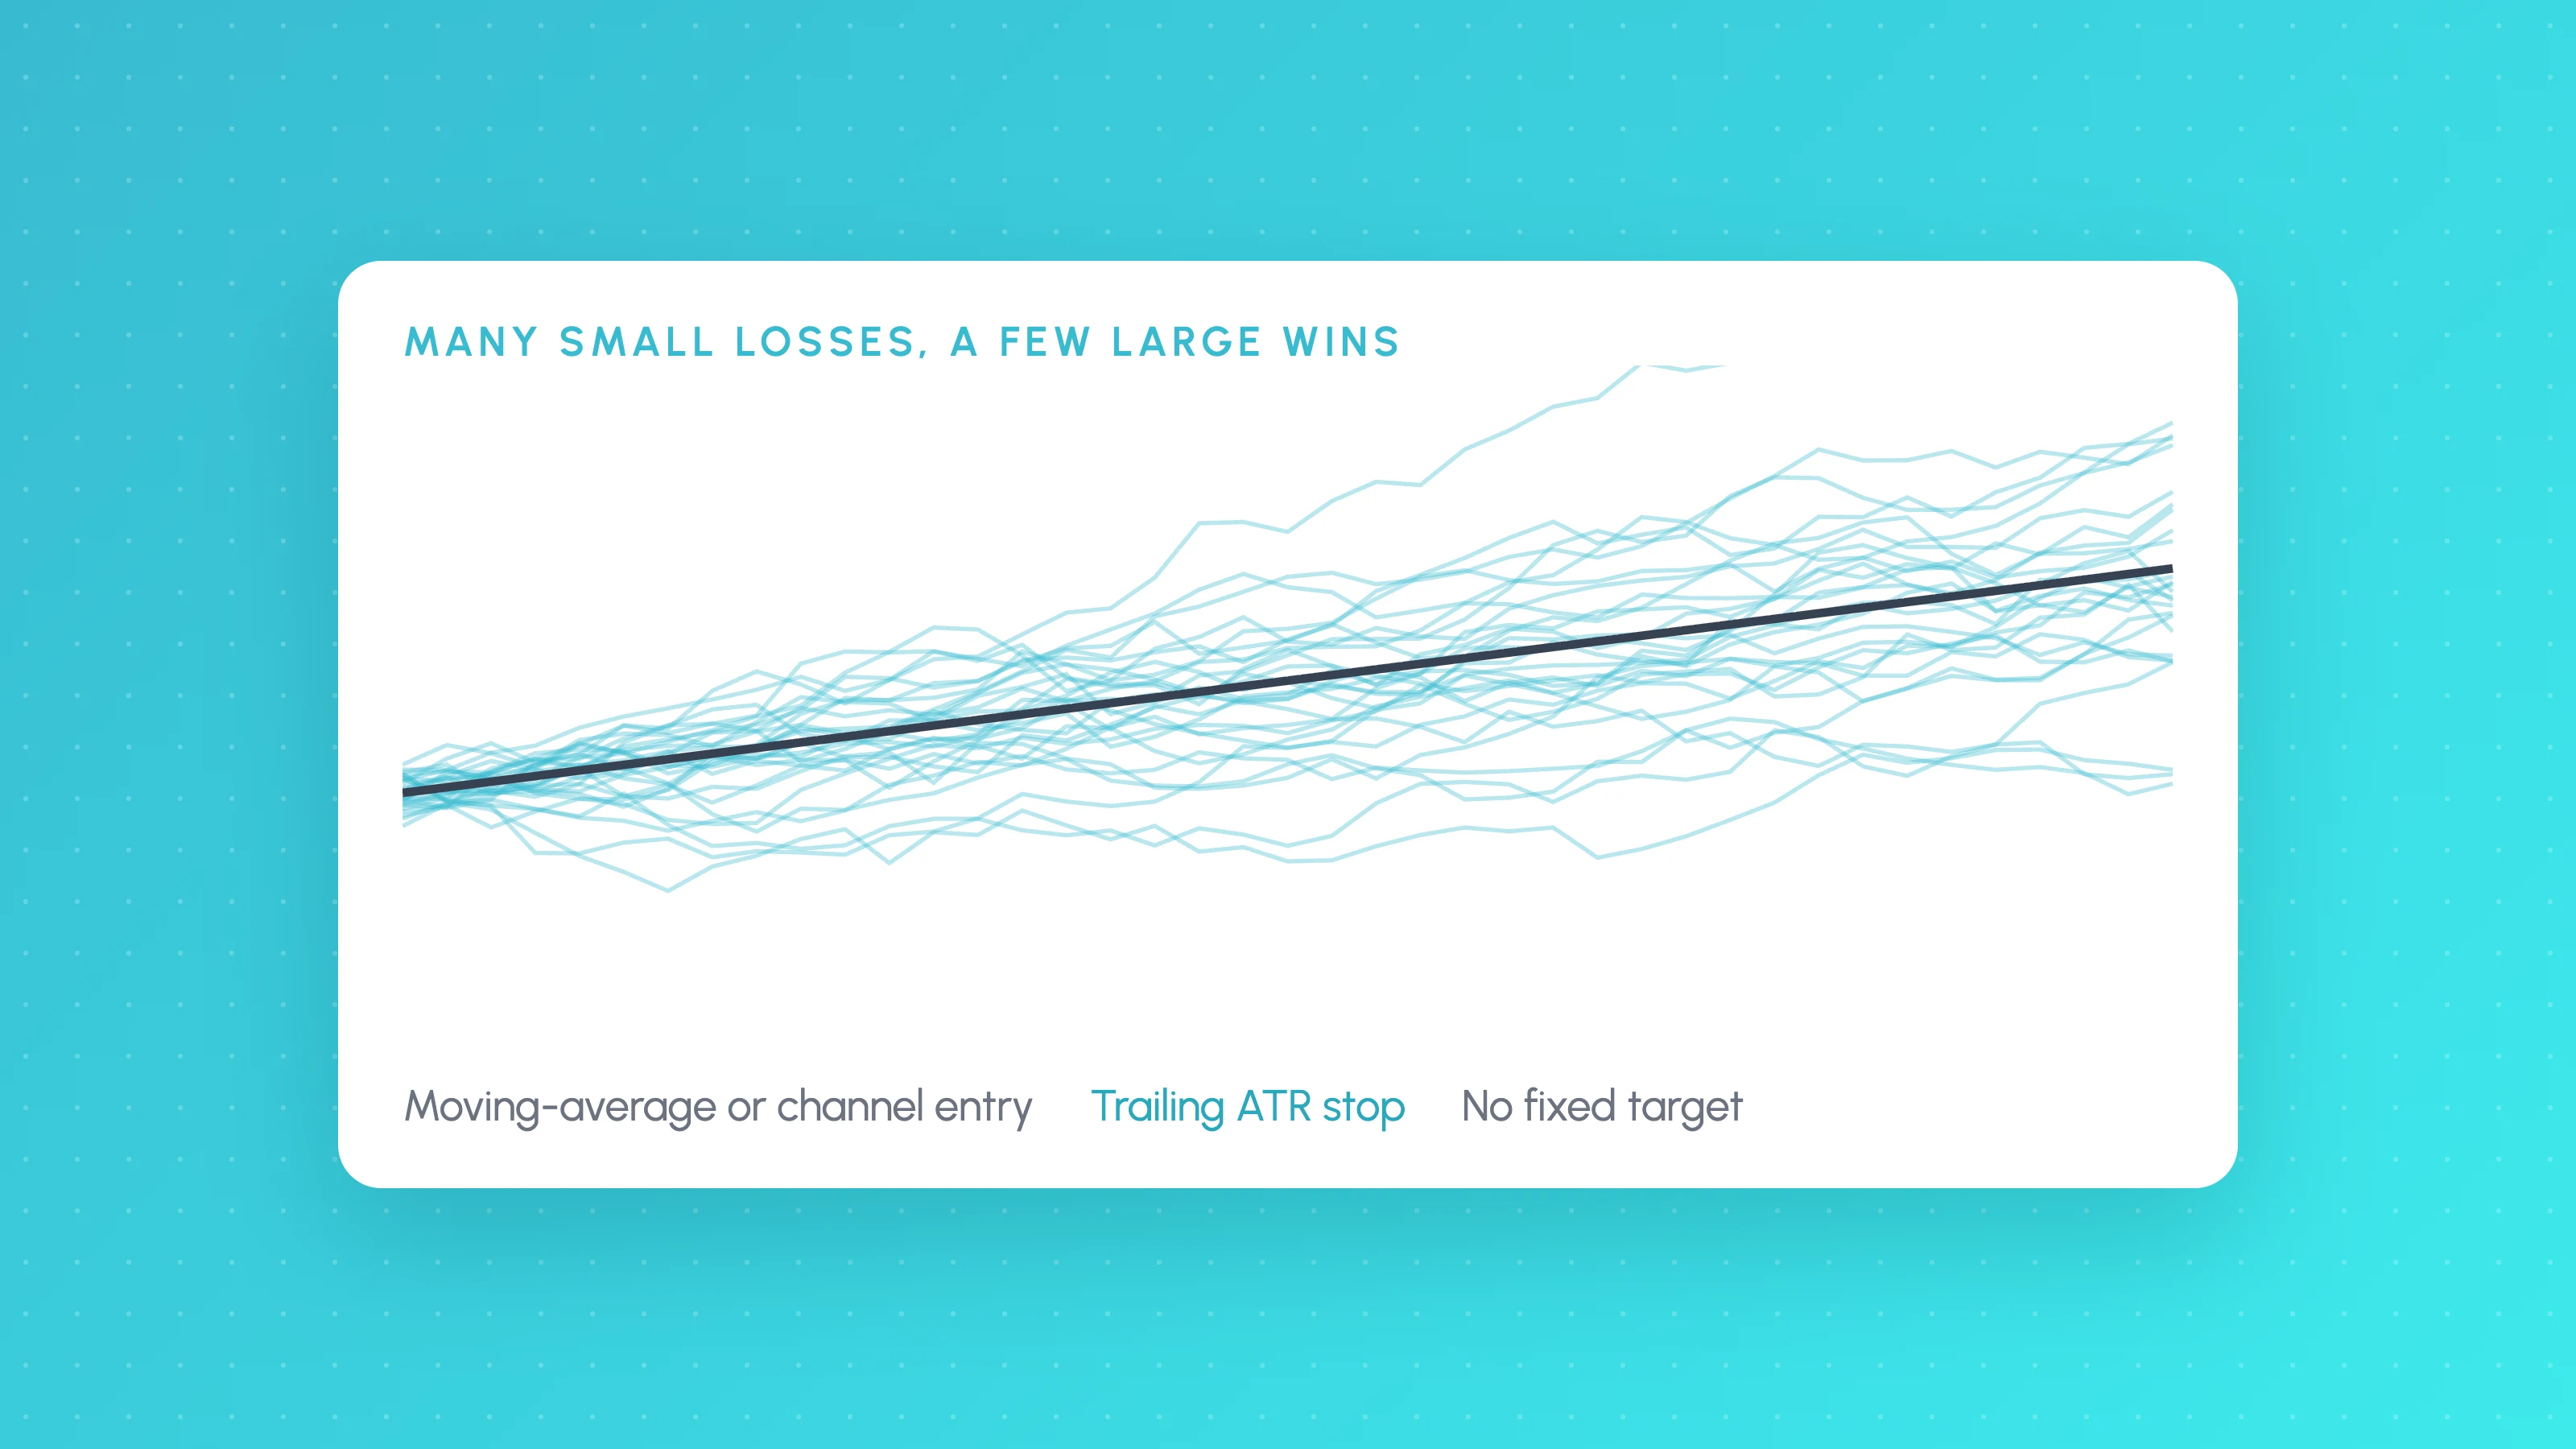
A trend following strategy buys markets that are rising and sells markets that are falling, and holds each position until the trend shows signs of ending. It doesn't try to predict tops or bottoms. Entries usually come from a moving-average crossover or a breakout above a recent high, exits from a trailing stop, and the strategy makes most of its money from a small number of large moves while losing small amounts on many false starts.
Trend following has a long systematic history. Richard Donchian traded price-channel breakouts in the 1960s, and the "Turtle Traders" that Richard Dennis and William Eckhardt trained in 1983 used breakout rules with fixed sizing and exits. Many managed-futures funds still follow trends today, usually across dozens of markets at once.
This is an educational description, not a recommendation. Backtests are not future results, and leveraged trading carries a high risk of loss.
Two classic entries
Moving-average crossover
- Entry: buy when the 50-period moving average crosses above the 200-period; sell short on the opposite cross.
- Faster versions use 20 and 50, or exponential moving averages.
- Simple and robust, but late: by the time two slow averages cross, part of the move is over.
Channel breakout
- Entry: buy when price closes above the highest high of the last 20 bars (a Donchian channel); sell short below the lowest low.
- Longer channels (55 bars) trade less often and catch bigger trends.
- Reacts faster than a crossover but takes more false breakouts.
Exits matter more than entries
Most of a trend strategy's result comes from how it exits.
- Trailing ATR stop: trail the stop 2 to 3 x ATR behind price. Wider stops stay in trends longer but give back more at the end.
- Opposite signal: exit long on the opposite crossover or a break of the 10 or 20-bar low.
- No fixed target: taking profit at 2R cuts off exactly the large winners the strategy depends on. If you add a target, test the strategy with and without it.
Why trend following is hard to stick with
- Low win rates. It is common for a trend system to lose on most trades. The edge, if there is one, comes from the size of the winners.
- Long flat or losing periods. In sideways markets the strategy keeps getting stopped out. Months without a new equity high are normal.
- Giving back profit. Trailing stops mean you always exit after the trend has turned, so some open profit is always given back.
These are exactly the conditions that make traders abandon a strategy just before it works. Running Monte Carlo on the backtest shows how long the losing streaks and flat periods could plausibly be, so you know in advance what "normal" looks like.
Which markets and timeframes
Trend following is usually run on 4-hour and daily candles across many markets: indices, currencies, metals, energy, bonds and crypto. Spreading across markets matters because any one market may go years without a strong trend. On short intraday timeframes, noise and costs make trend following much harder.
How to test a trend following strategy
- Use a long history. A trend strategy needs many trends in the data. A year or two may contain only a handful.
- Test across several markets with the same rules. Tuning separate settings for each market is a common way to overfit.
- Include costs, and swap or financing for positions held overnight, because trend trades can last weeks.
- Hold back an unseen period. See out-of-sample testing.
- Check sensitivity. A 50/200 crossover should work about as well at 45/190 or 55/210. If it only works at one exact setting, it is probably luck. See how to tell if a backtest is overfit.
- Look at the worst drawdown and the longest flat period, not just the total return.
In Strategy Lab you can build a trend strategy without code from moving-average crossovers, swing breaks, ATR stops and trailing exits, with a higher-timeframe bias filter. You can also describe it to TES, the AI strategy coach. Strategy Lab backtests on candles up to daily over up to 20 years of data, includes commission, spread and overnight swap, and can run the same rules on up to 50 other markets to see whether the edge holds beyond one market.
Free tools for this: use the profit factor calculator to work out profit factor from your own trades and the Monte Carlo simulator to see the range of drawdowns your trade results could produce. They run in your browser, with no account needed.
Frequently asked questions
- What is a trend following strategy?
- A strategy that buys rising markets and sells falling ones, entering on signals such as moving-average crossovers or breakouts to new highs, and exiting with a trailing stop when the trend weakens. It aims to catch large moves rather than predict turning points.
- Does trend following still work?
- Trend following has had long good and bad periods. It tends to do well when markets make large sustained moves and badly in sideways markets. Whether a particular set of rules works is something to test on a long history across several markets.
- What is the best indicator for trend following?
- Moving averages and price-channel breakouts are the most common, with ATR for stops. The exit rules usually matter more than the entry indicator.
- Why do trend following strategies have low win rates?
- Because they enter many trends that fail and exit quickly with small losses, while a few trends run far enough to pay for them. A win rate below 40% can still be profitable if the average win is several times the average loss.
Keep reading
 Strategies
Algorithmic Trading Strategies: 6 Types Explained, With Rules You Can Test
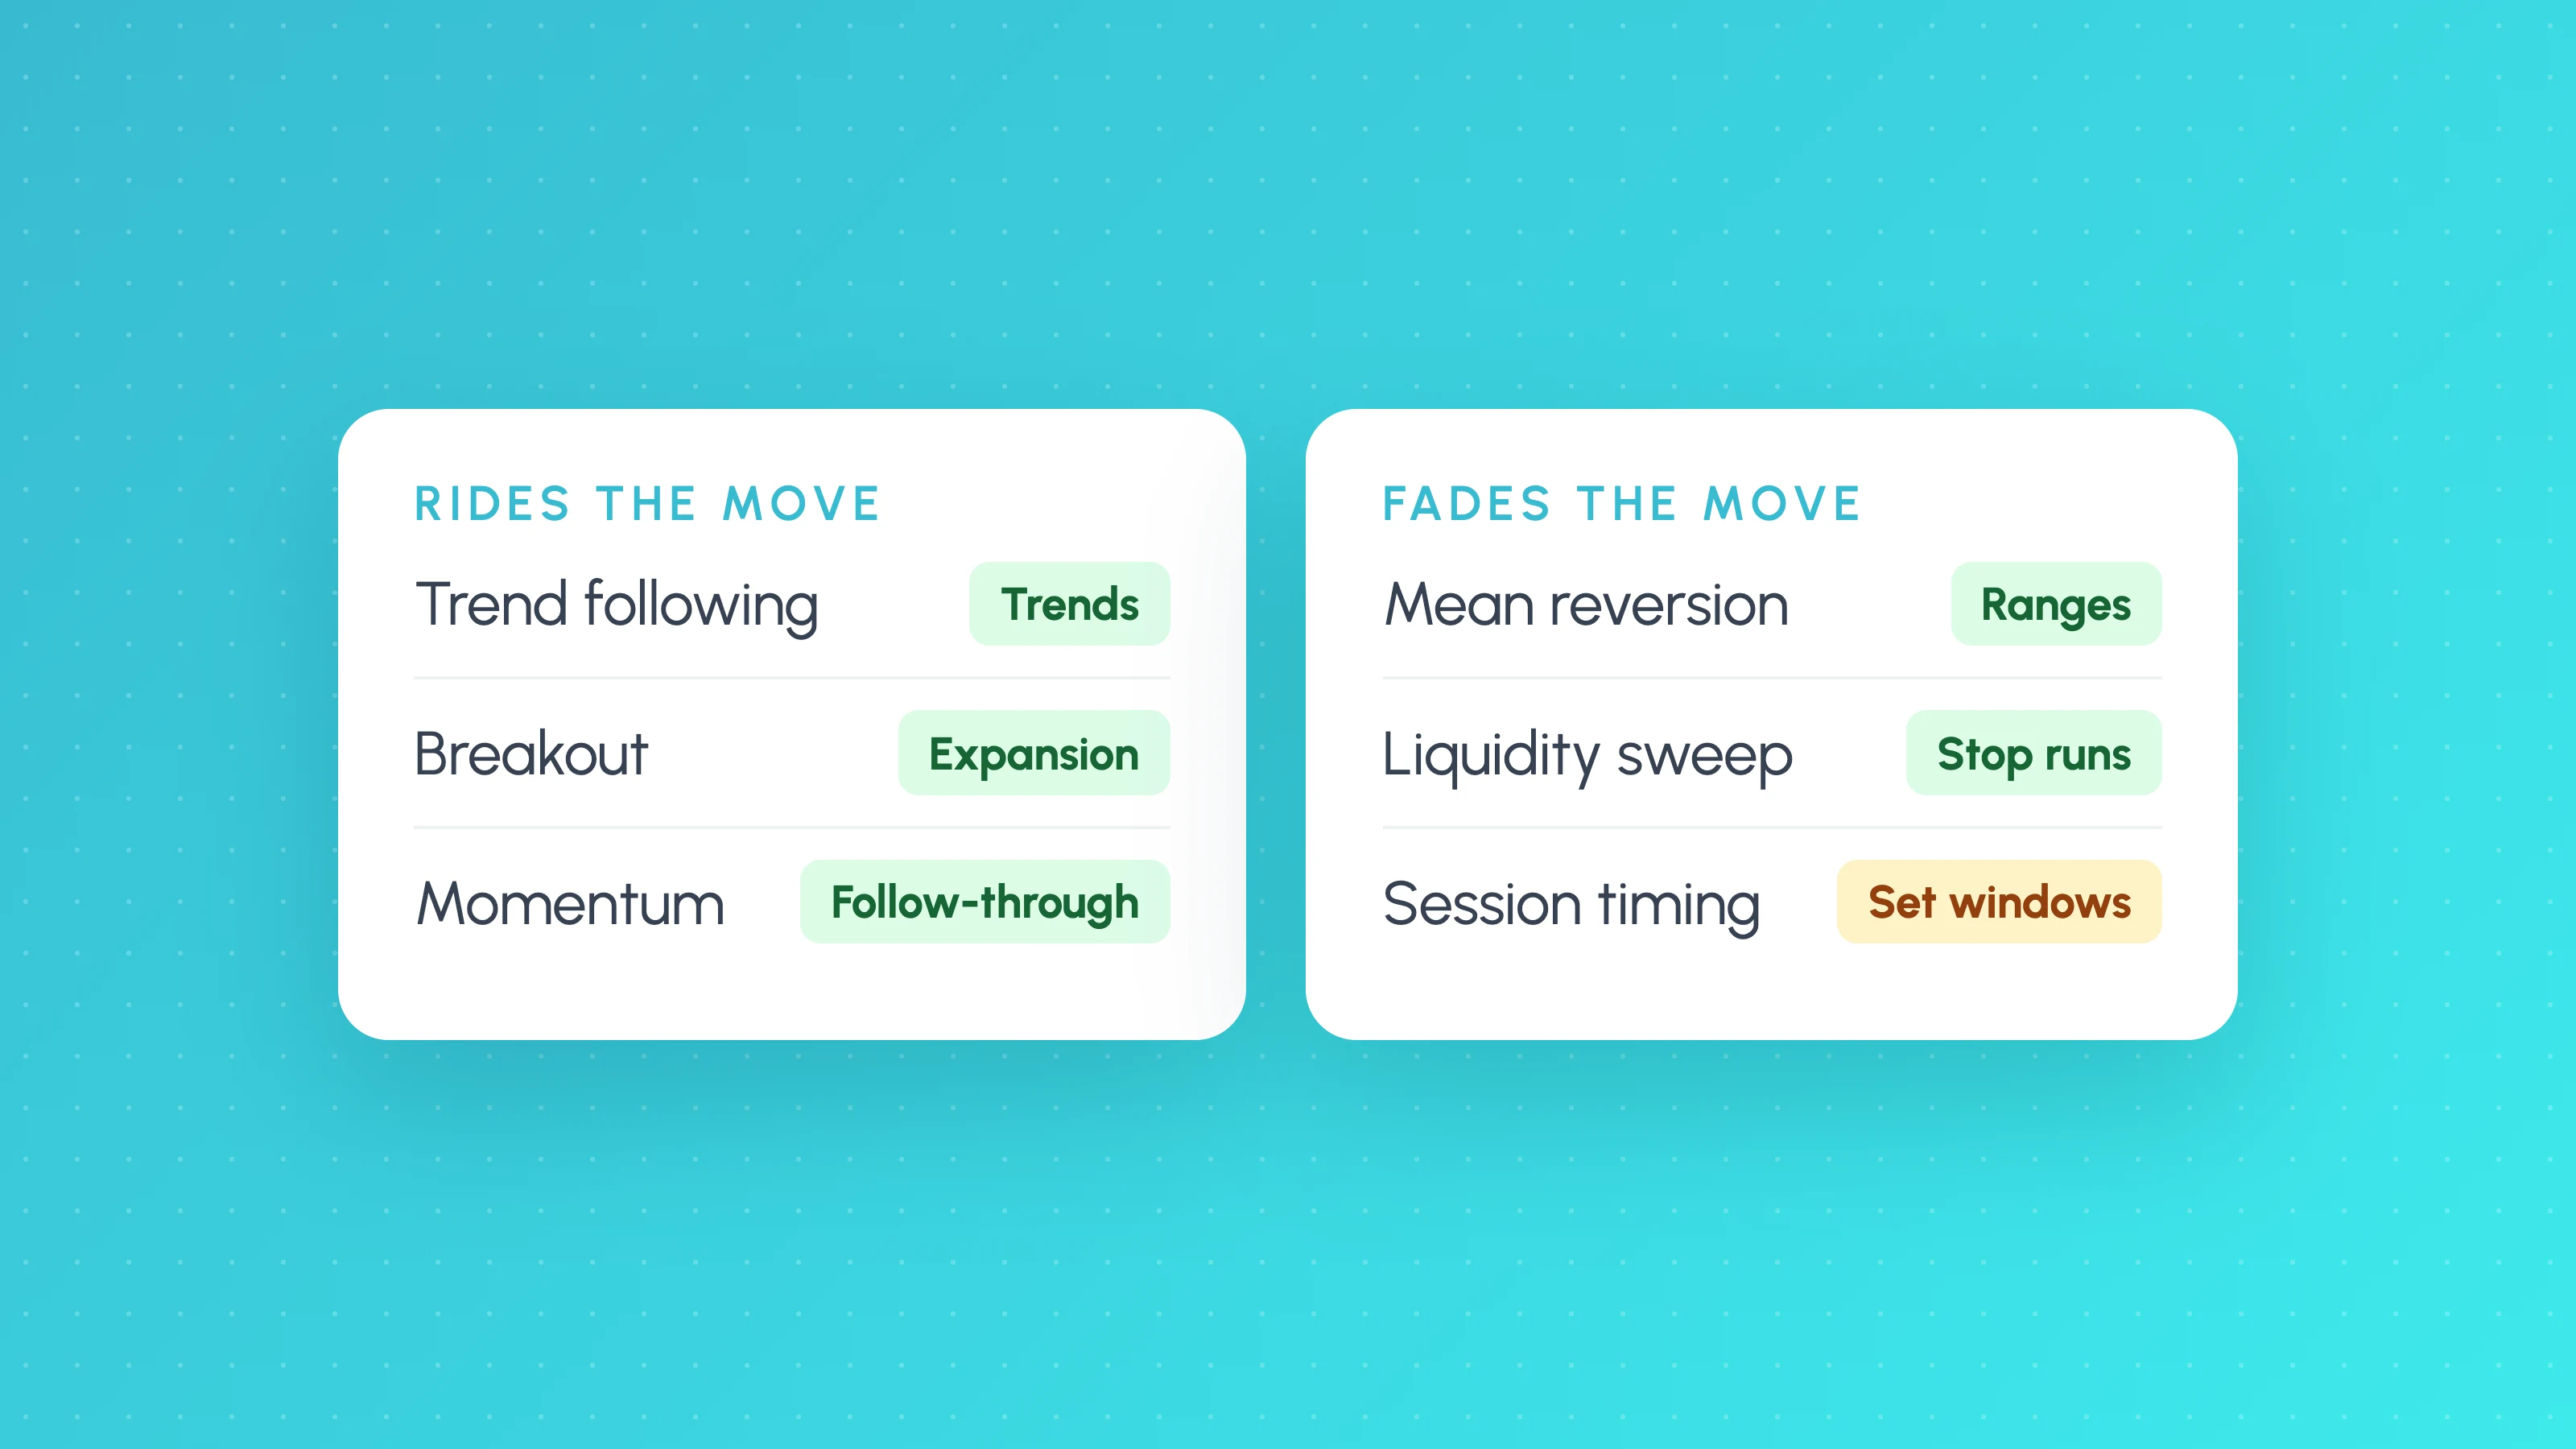
The main algorithmic trading strategies retail traders use: trend following, mean reversion, breakouts, momentum, session and liquidity sweep strategies, with example rules.
 Trading metrics
Monte Carlo Backtesting Explained: What It Tells You and What It Doesn't
Monte Carlo backtesting explained: trade shuffling vs block bootstrap, why to plan at half the edge, drawdown odds, minimum trade counts and what it can't show.
 Algo trading
Systematic vs Discretionary Trading: Which Suits You, and the Hybrid Path
Systematic vs discretionary trading compared: speed, testing, emotion and flexibility, how to turn your playbook into testable rules, and the hybrid path.