

Moving Average Crossover Strategy: Golden Cross, EMA Rules and Testing
Moving average crossover strategies explained: golden and death crosses, fast EMA crossovers for day trading, filters for whipsaws, and how to test a crossover properly.
By Hristo Skulev · Updated · 3 min read
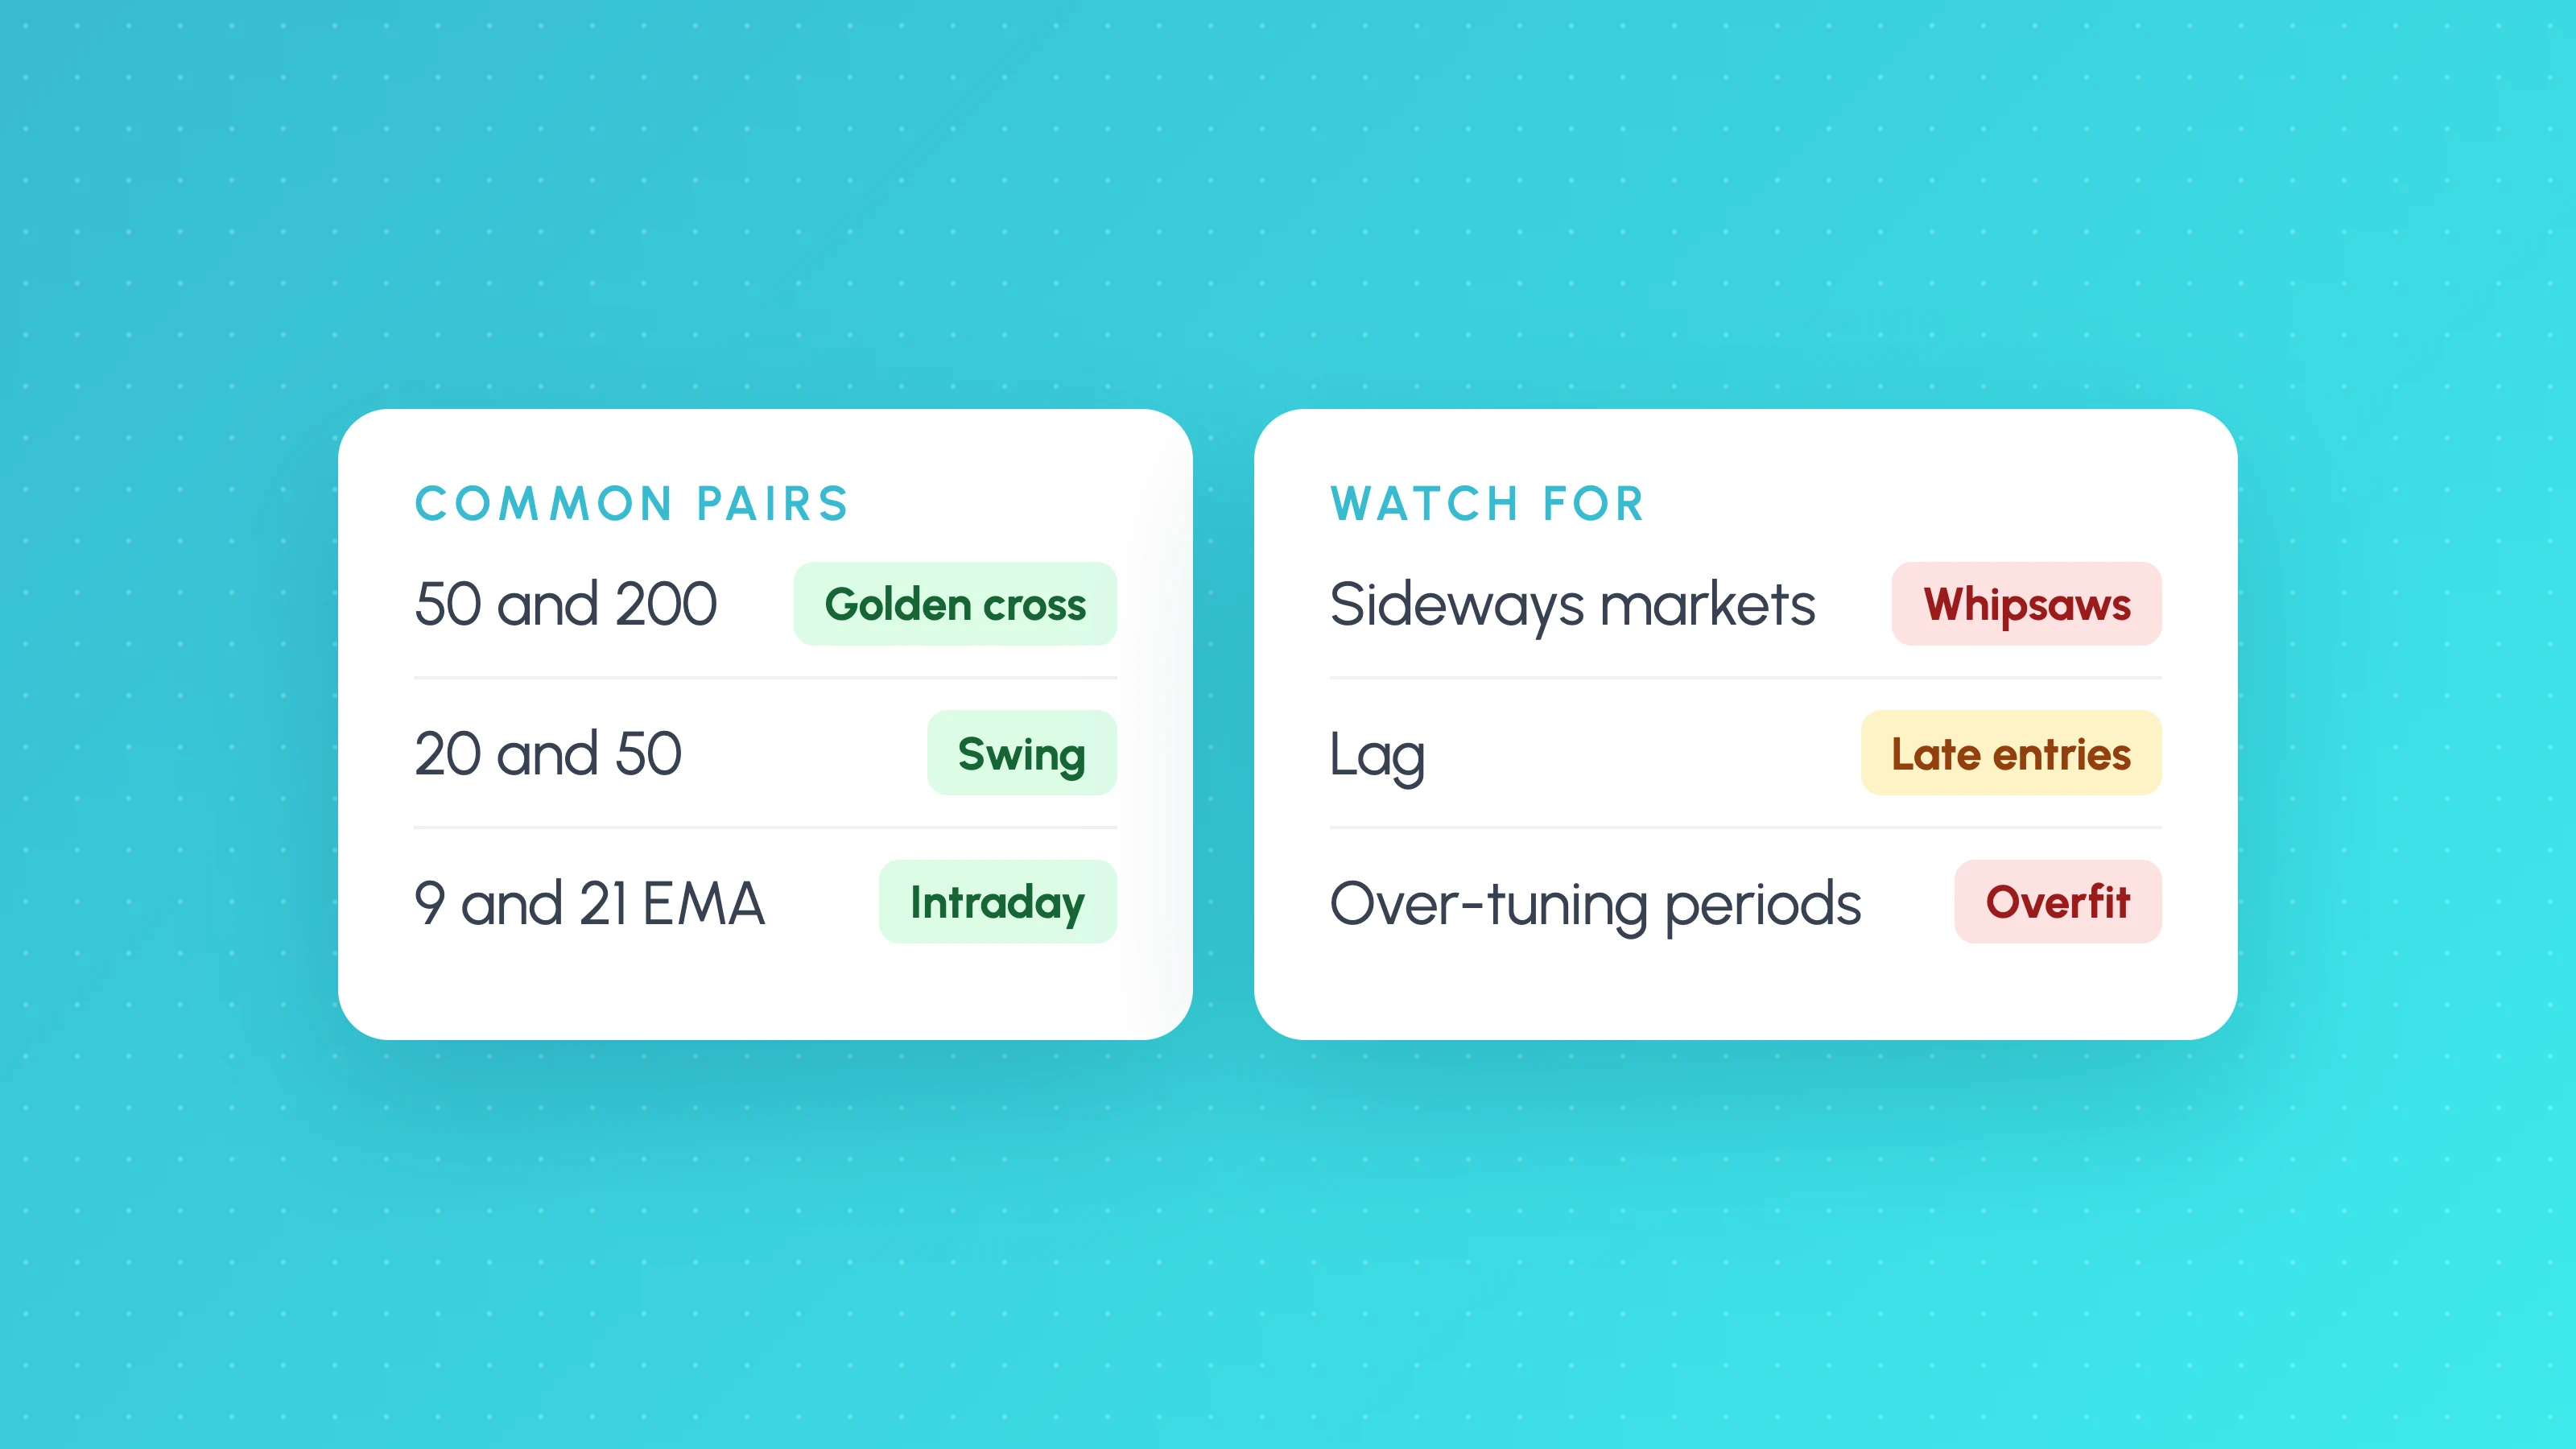
A moving average crossover strategy buys when a faster moving average crosses above a slower one and sells (or goes short) when it crosses below. The best-known version is the golden cross, when the 50-day moving average crosses above the 200-day, and its opposite, the death cross. Shorter versions, such as a 9 and 21-period exponential moving average (EMA) crossover, are used for intraday trading. Crossovers are simple and easy to automate, but they lag and get whipsawed in sideways markets, so the filter and exit rules decide whether they make money.
These are educational examples, not recommendations. Backtests are not future results, and leveraged trading carries a high risk of loss.
Common crossover pairs
| Pair | Typical use | Trades |
|---|---|---|
| 50 and 200 (simple) | Long-term trend on daily candles; the golden and death cross | Very few |
| 20 and 50 | Swing trading on 4-hour or daily candles | Some |
| 9 and 21 (exponential) | Intraday on 5 to 15-minute candles | Many |
An EMA weights recent prices more heavily than a simple moving average (SMA), so it reacts faster and whipsaws more.
Example rules to test
- Market and timeframe: an index or currency pair on 1-hour candles.
- Entry: buy when the 20 EMA closes above the 50 EMA; sell short on the opposite cross.
- Filter: only take trades in the direction of the daily 200-period moving average.
- Stop: 2 x ATR from entry.
- Exit: the opposite crossover, or a trailing ATR stop.
- Risk: a fixed percentage of the account per trade.
Filters that reduce whipsaws
- Higher-timeframe trend: trade only in the direction of a slower average on a higher timeframe.
- Market regime: skip trades when a regime filter says the market is ranging.
- Distance or confirmation: require the fast average to clear the slow one by a margin, or wait for a close beyond the most recent swing.
- Session: on intraday versions, avoid the quietest hours.
Where crossovers fail
- Sideways markets, where the averages cross back and forth and every signal loses a little.
- Lag, which means entries come after part of the move and exits after part of the reversal.
- Over-tuning. Searching every pair of periods until one looks great is a classic way to overfit. A 20/50 that works should also roughly work at 18/45 and 22/55. See how to tell if a backtest is overfit.
How to test a crossover strategy
- Fix the averages, timeframe, filter, stop, exit, sizing and costs.
- Backtest over many years and several markets, because crossovers depend on trends, which come and go.
- Hold back an unseen period. See out-of-sample testing.
- Check sensitivity to the periods, as above.
- Run Monte Carlo to see how long losing streaks could plausibly last. Trend strategies often have long flat spells; see the trend following strategy guide.
In Strategy Lab, SMA and EMA crossovers are built-in setups, with higher-timeframe bias and market-regime filters, ATR stops and trailing exits. You can build the rules without code or describe them to TES, the AI strategy coach, and run the same rules on up to 50 other markets to see whether the edge holds beyond one market.
Free tools for this: use the profit factor calculator to work out profit factor from your own trades and the Monte Carlo simulator to see the range of drawdowns your trade results could produce. They run in your browser, with no account needed.
Frequently asked questions
- What is the best moving average crossover strategy?
- There's no single best pair. The 50 and 200-day golden cross is used for long-term trends, and 9 and 21 EMAs for intraday trading. A trend or regime filter and a sensible exit usually matter more than the exact periods.
- What is a golden cross?
- When the 50-day moving average crosses above the 200-day moving average, read as a sign of a longer-term uptrend. The opposite, the 50-day crossing below the 200-day, is a death cross.
- Do moving average crossovers work?
- They can catch trends, but they lag and lose money in sideways markets. Whether a particular crossover works depends on the market, timeframe, filters and costs, which only a backtest with an unseen period can show.
- EMA or SMA for a crossover strategy?
- An EMA reacts faster, giving earlier signals and more whipsaws; an SMA is smoother and slower. Test both with the same rules and keep the one that holds up on unseen data.
Keep reading
 Strategies
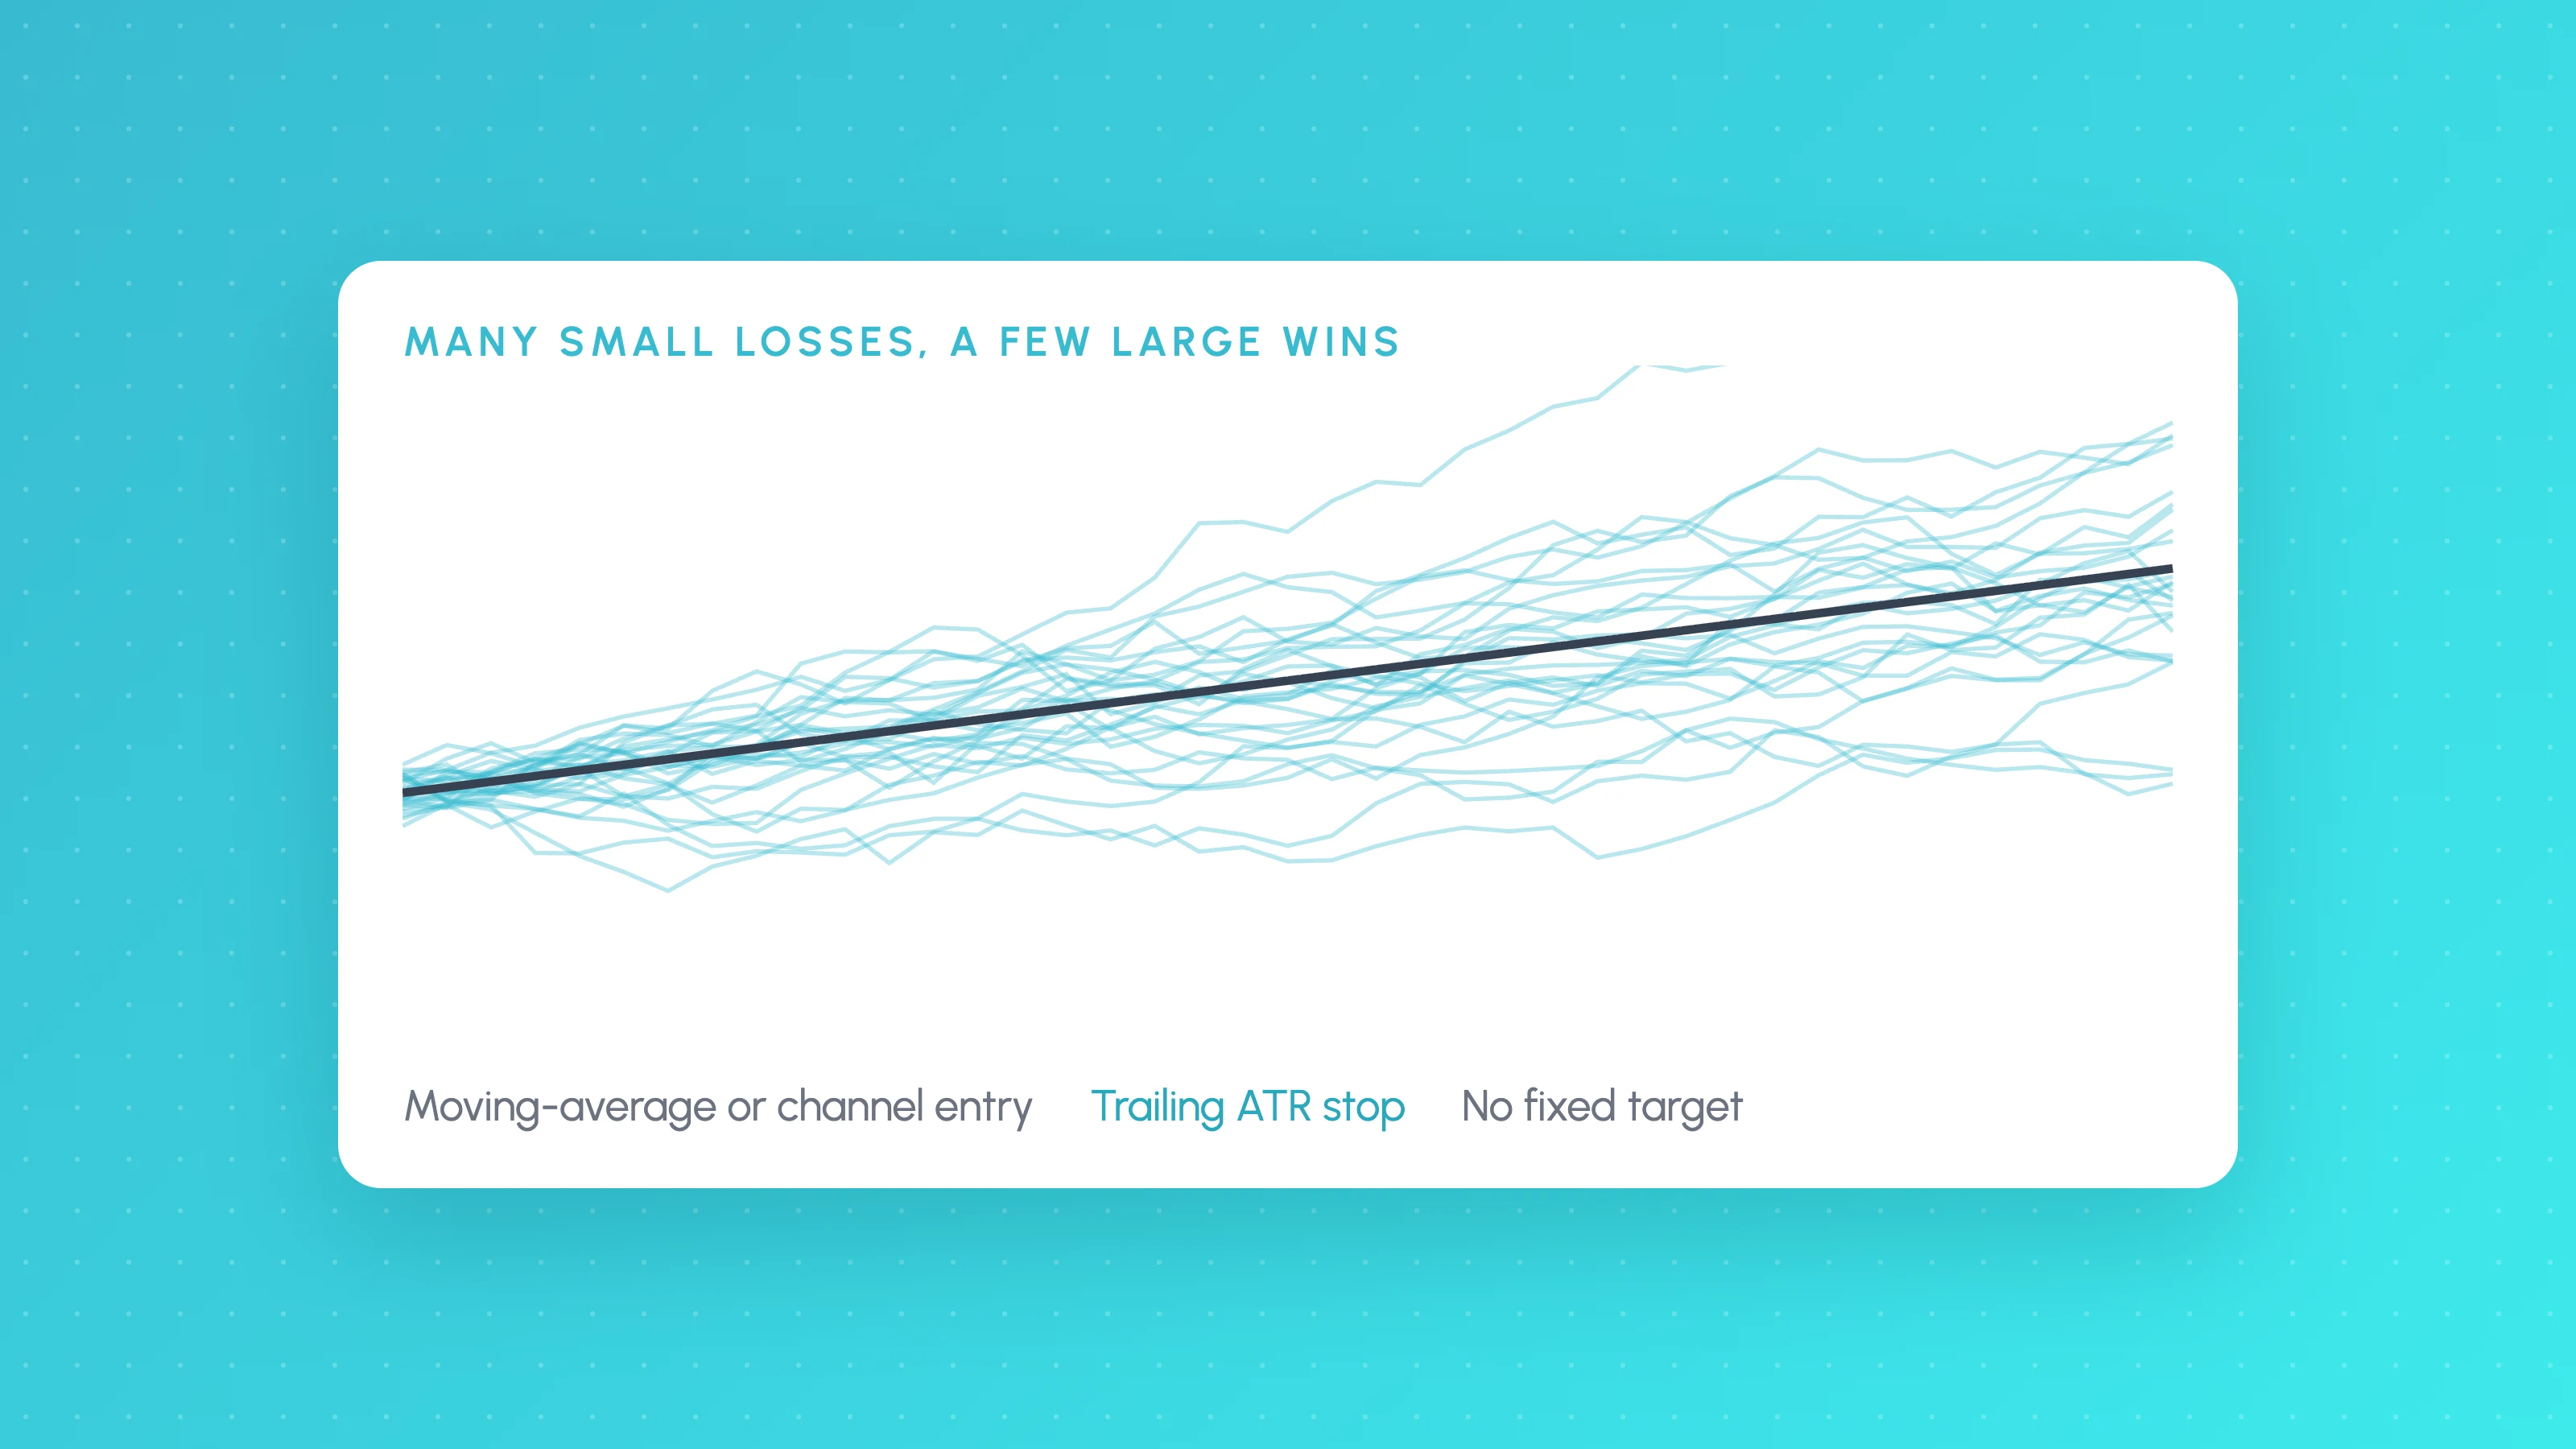
Trend Following Strategy: Rules, Examples and Why It's Hard to Stick With
Trend following trading explained: moving-average and channel breakout rules, ATR stops and trailing exits, why win rates are low, and how to test a trend strategy properly.
 Strategies
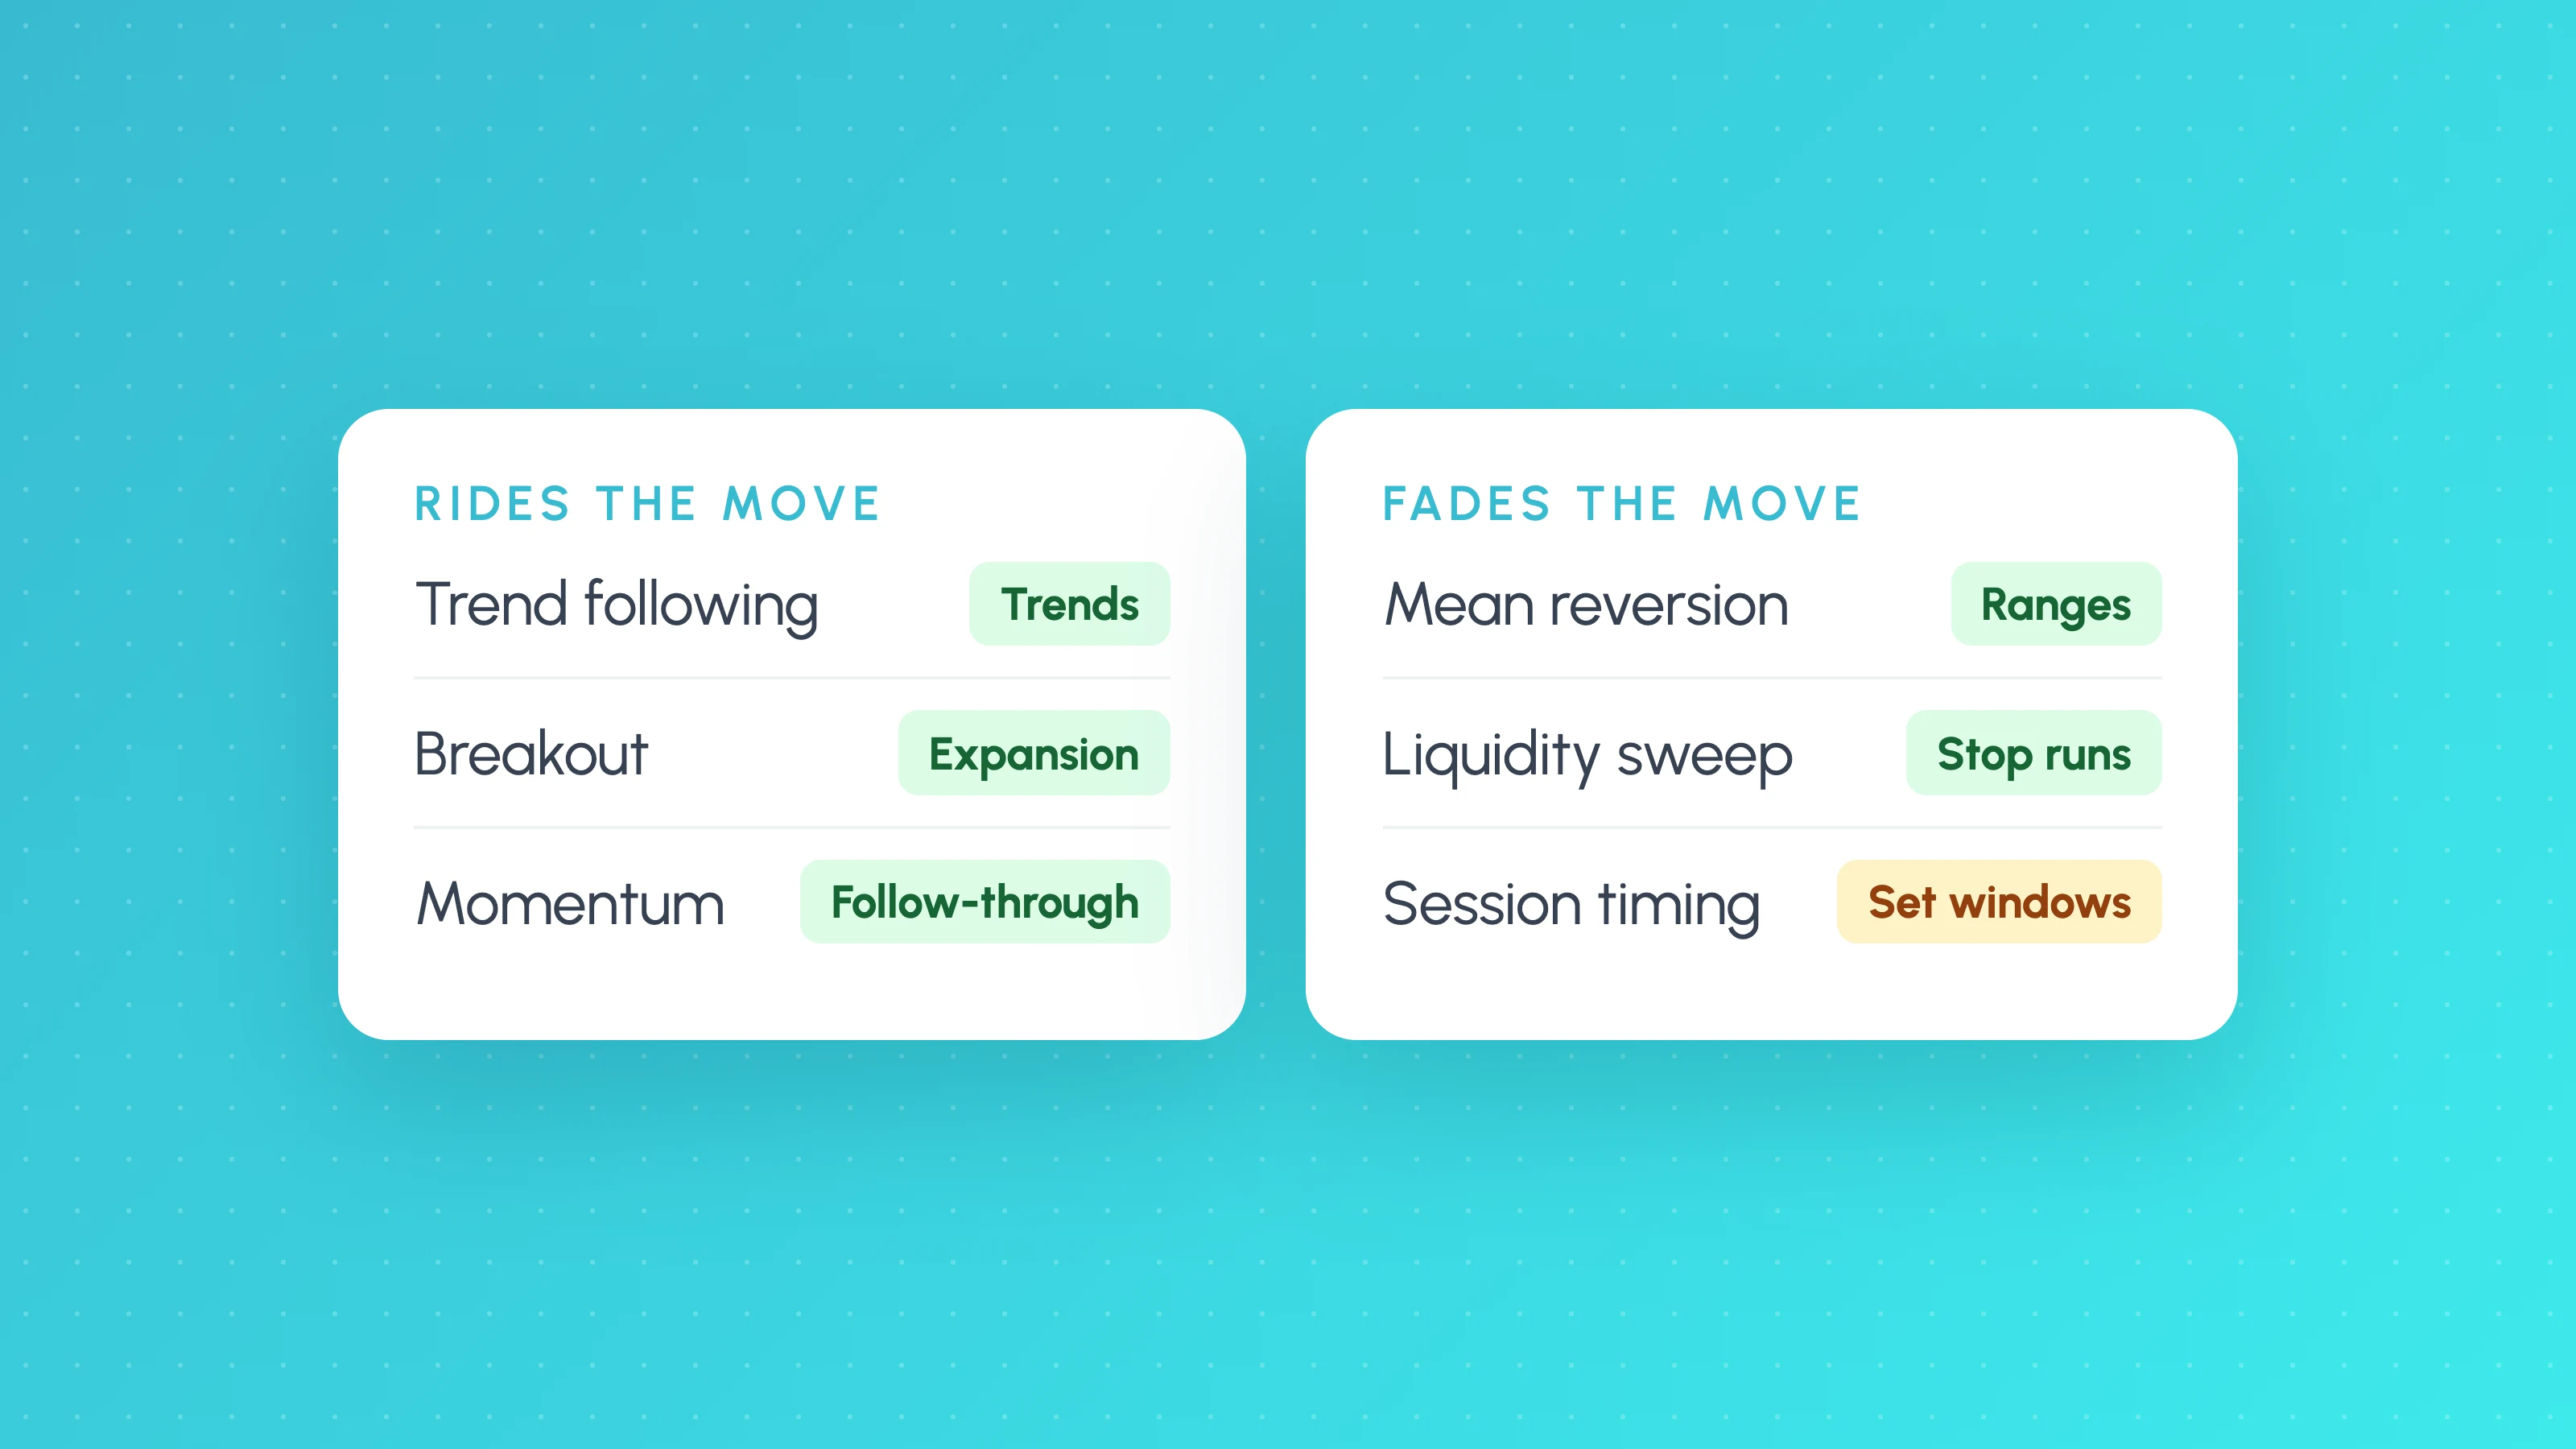
Algorithmic Trading Strategies: 6 Types Explained, With Rules You Can Test
The main algorithmic trading strategies retail traders use: trend following, mean reversion, breakouts, momentum, session and liquidity sweep strategies, with example rules.
 TradingView backtests
Is My Backtest Overfit? A Practical Checklist for Traders
How to tell if a backtest is overfit: too-good metrics, thin samples, fragile inputs, useless filters, out-of-sample and walk-forward tests, plus a checklist.