Nasdaq 100's worst day since 2020: what the 5 November sell-off means for futures algos and prop accounts
By Hristo Skulev · 12 November 2026

The Nasdaq 100 fell 6.36% to 26,629.81 on Thursday 5 November 2026, its worst day since 2020, as AI and chip stocks sold off: Nvidia fell 9.26% and the VanEck semiconductor ETF (SMH) 11.21%, according to investingLive. The S&P 500 fell 4.35% and the Dow 3.44%. The VXN, the Nasdaq 100's volatility index, jumped 52.55%, its fourth-largest one-day rise on record, according to Forex.com.
Markets bounced afterwards: the Nasdaq rose 1.09% on 6 November, and the Nasdaq 100 was up about 2.75% during the session on 9 November (investingLive).
Check the year on what you read
Many search results for "Nasdaq crash November" are from November 2025. If you're reading about the move, check the date. We couldn't confirm from a primary source the "VIX above 28" figure circulating on 5 November, so we've used the VXN figures above.
Why a day like this breaks prop accounts
Futures prop firms measure the daily loss limit during the day, on open equity, not only at the close. On a day when NQ falls more than 6% with volatility rising this fast:
- Stops slip. Fast markets fill stops beyond their price, so a planned 1R loss can become 1.5R or 2R.
- Strategies that buy dips keep buying. Mean reversion and grid-style bots add to losing positions in exactly this kind of move.
- Several positions lose together. NQ, ES and YM moved the same way, so a "diversified" futures bot had little diversification.
- The intraday low counts. Even if a position recovered by the close, an intraday dip through the daily loss limit can still breach the account.
For prop rules on bots, see prop firm algo rules in 2026 and prop firms that allow algo trading.
How to test your strategy against a day like 5 November
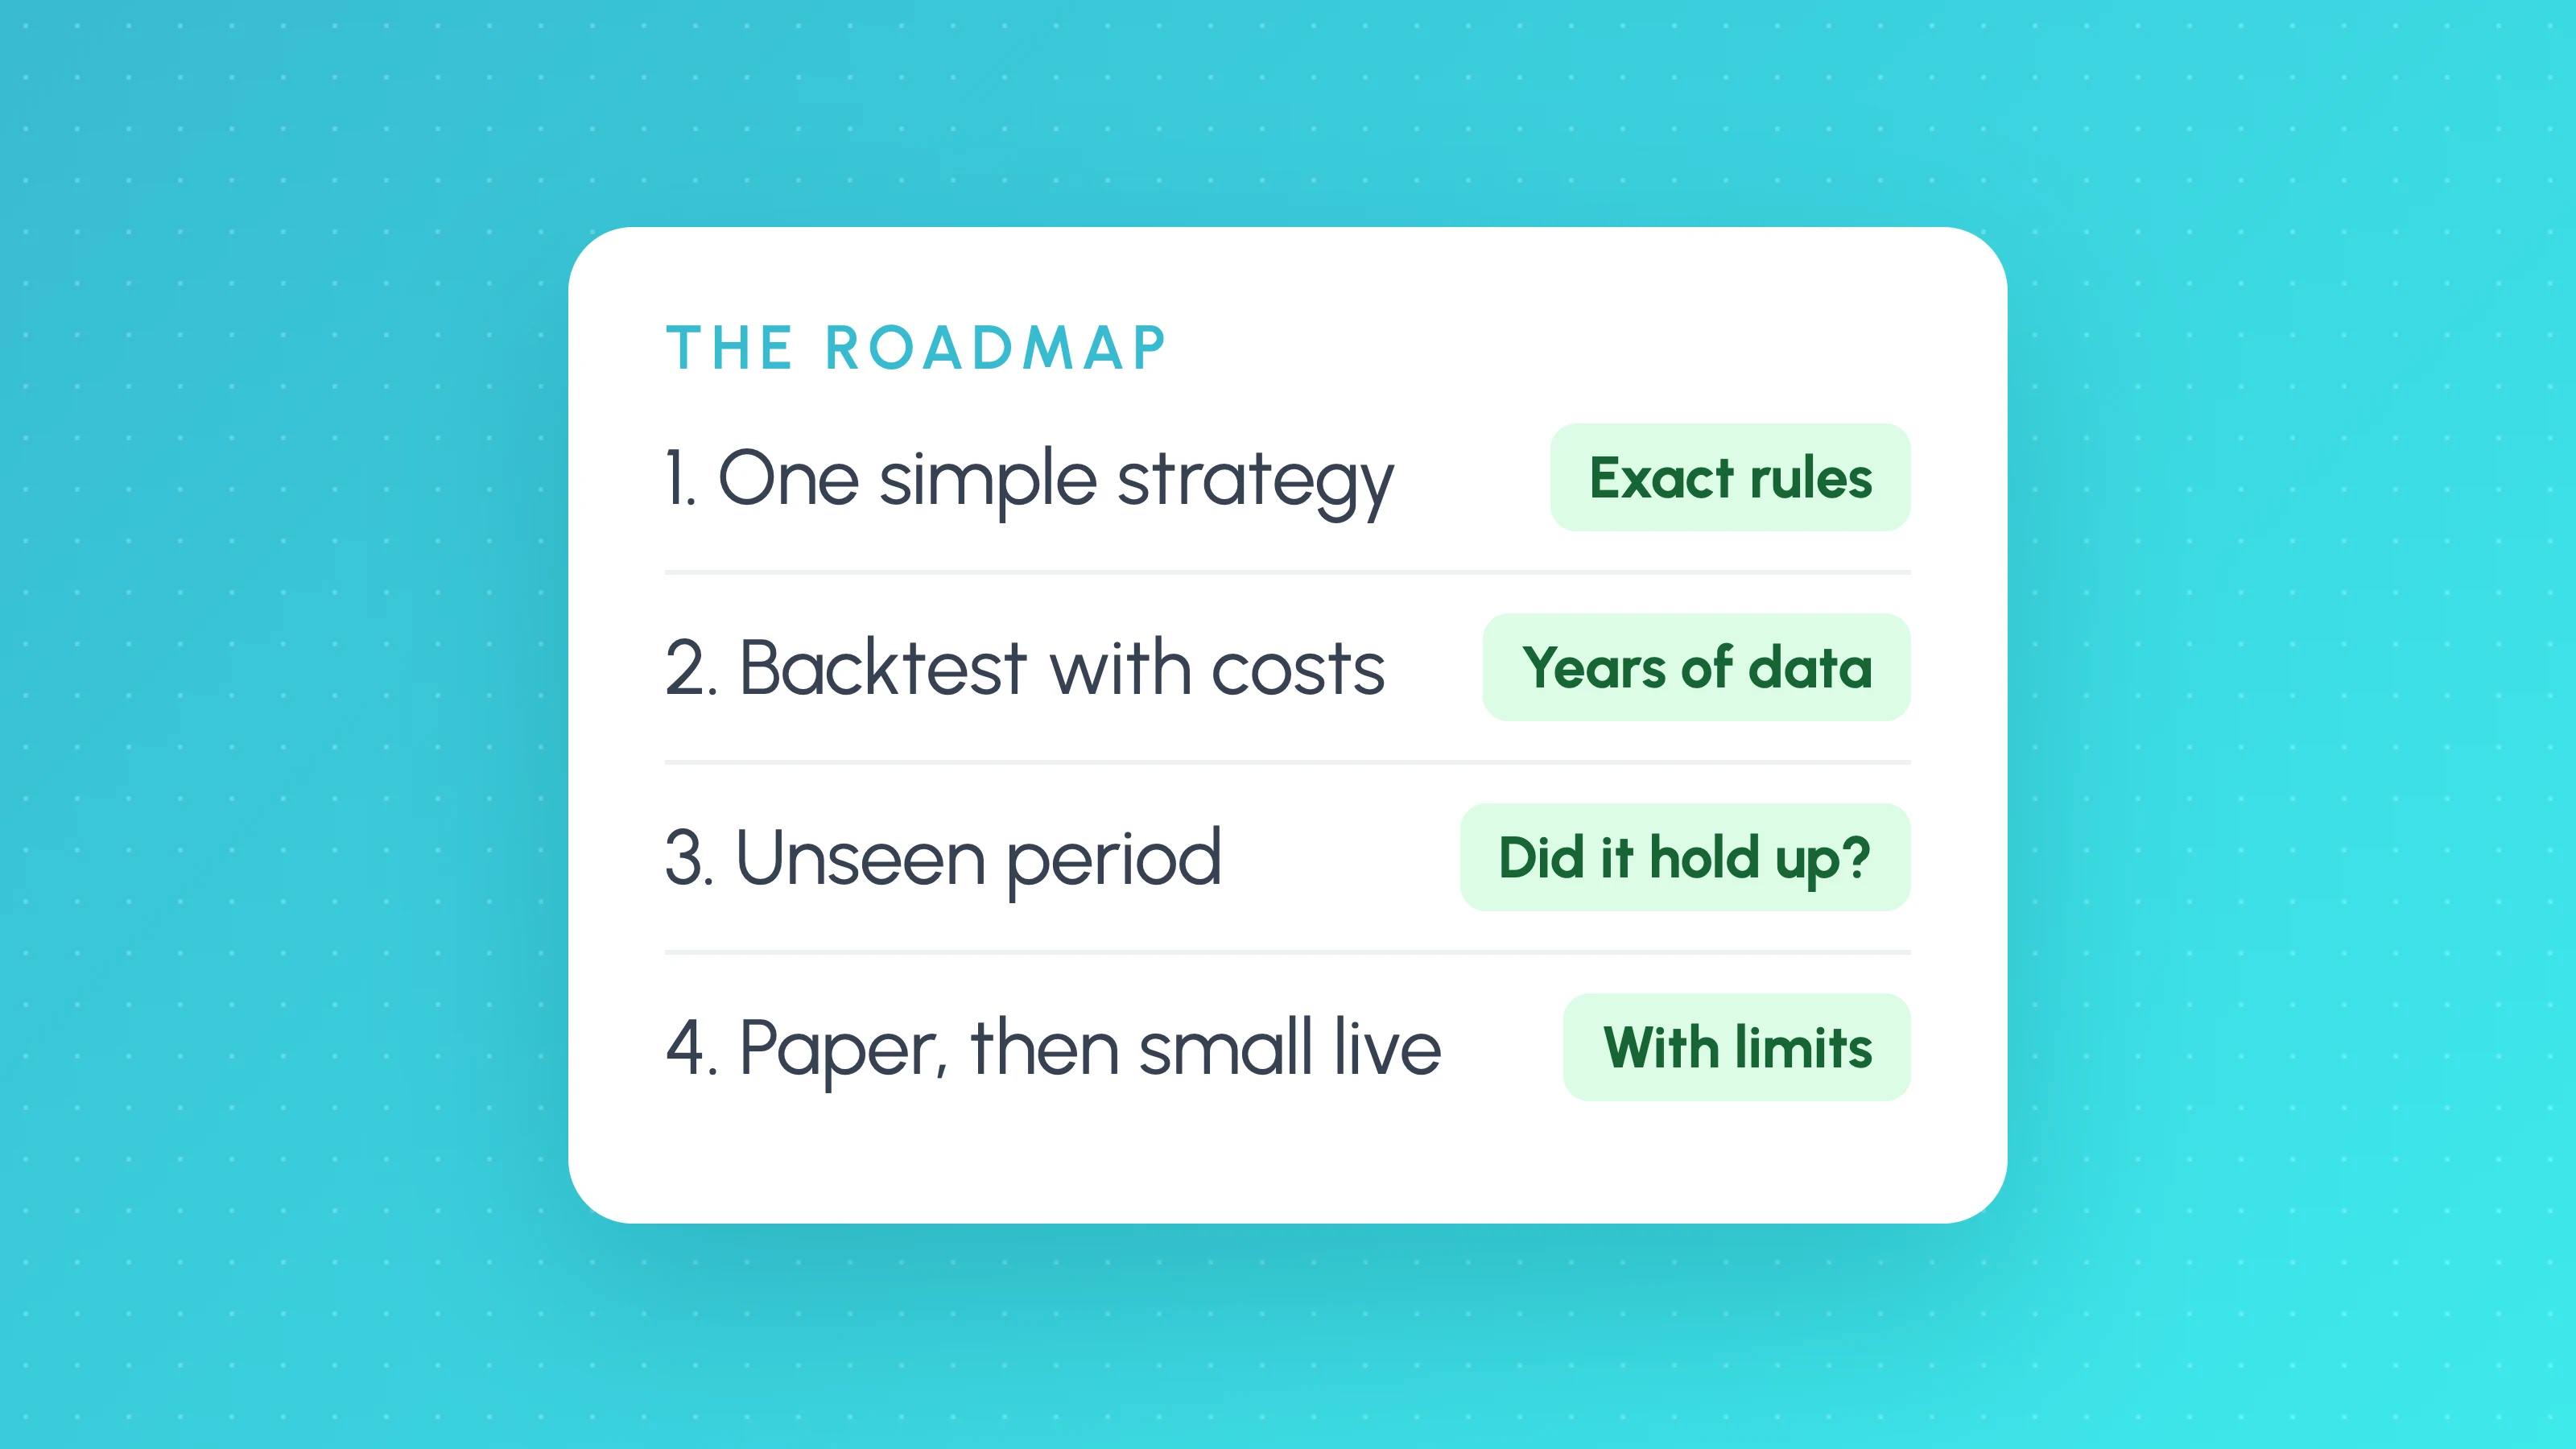
- Look at your strategy's worst days in the backtest, not just its average. Did it trade on days like this before, such as in 2020 or 2022?
- Check daily loss inside each day. A backtest that only reports closing balances hides intraday breaches.
- Test position size against the daily limit. If two or three normal stops plus slippage would breach it, size is too large for a prop account.
- Run Monte Carlo to see how often a bad cluster of trades lines up. See Monte Carlo backtesting.
The prop firm challenge simulator in Strategy Lab replays a strategy's backtest through FTMO, The5ers or Topstep rules from every week or month start, checking the limits inside every candle, so you can see whether a sell-off like this would have breached the daily loss limit, and how often.
Market data is from the sources linked above. Past moves don't predict future ones, and leveraged trading carries a high risk of loss.
 News
News · 29 Oct 2026 · 4 min read
Robinhood Agents: AI models that trade in your account. How to judge whether they work
Robinhood now lets AI models research and trade in a dedicated account, with approvals on by default. Here's what launched, what the public evidence on AI trading shows, and how to judge an agent's record.
 News
News · 12 Nov 2026 · 2 min read
TradingView adds custom second intervals from 1 to 299 seconds: who gets them and what it means for backtests
TradingView now lets Ultimate subscribers set custom chart intervals from 1 to 299 seconds, with standard second intervals from the Plus plan. Here's who gets what, and why second-level backtests need extra care with fills and costs.
 News
News · 26 Oct 2026 · 3 min read
TradingView launches an official MCP server: what it means for algo traders
TradingView now has an official MCP server for Claude, ChatGPT and other AI assistants. It's a strong research tool, but it never sees your strategy's trades. Here's what that means if you trade a system.