

Hyperliquid Trade History Export: CSV, API and Real PnL (2026)
Export your Hyperliquid trade and funding history to CSV, get past the row limits with the API, and work out real PnL after fees and funding, by session.
By Tessera Trades · Updated · 9 min read
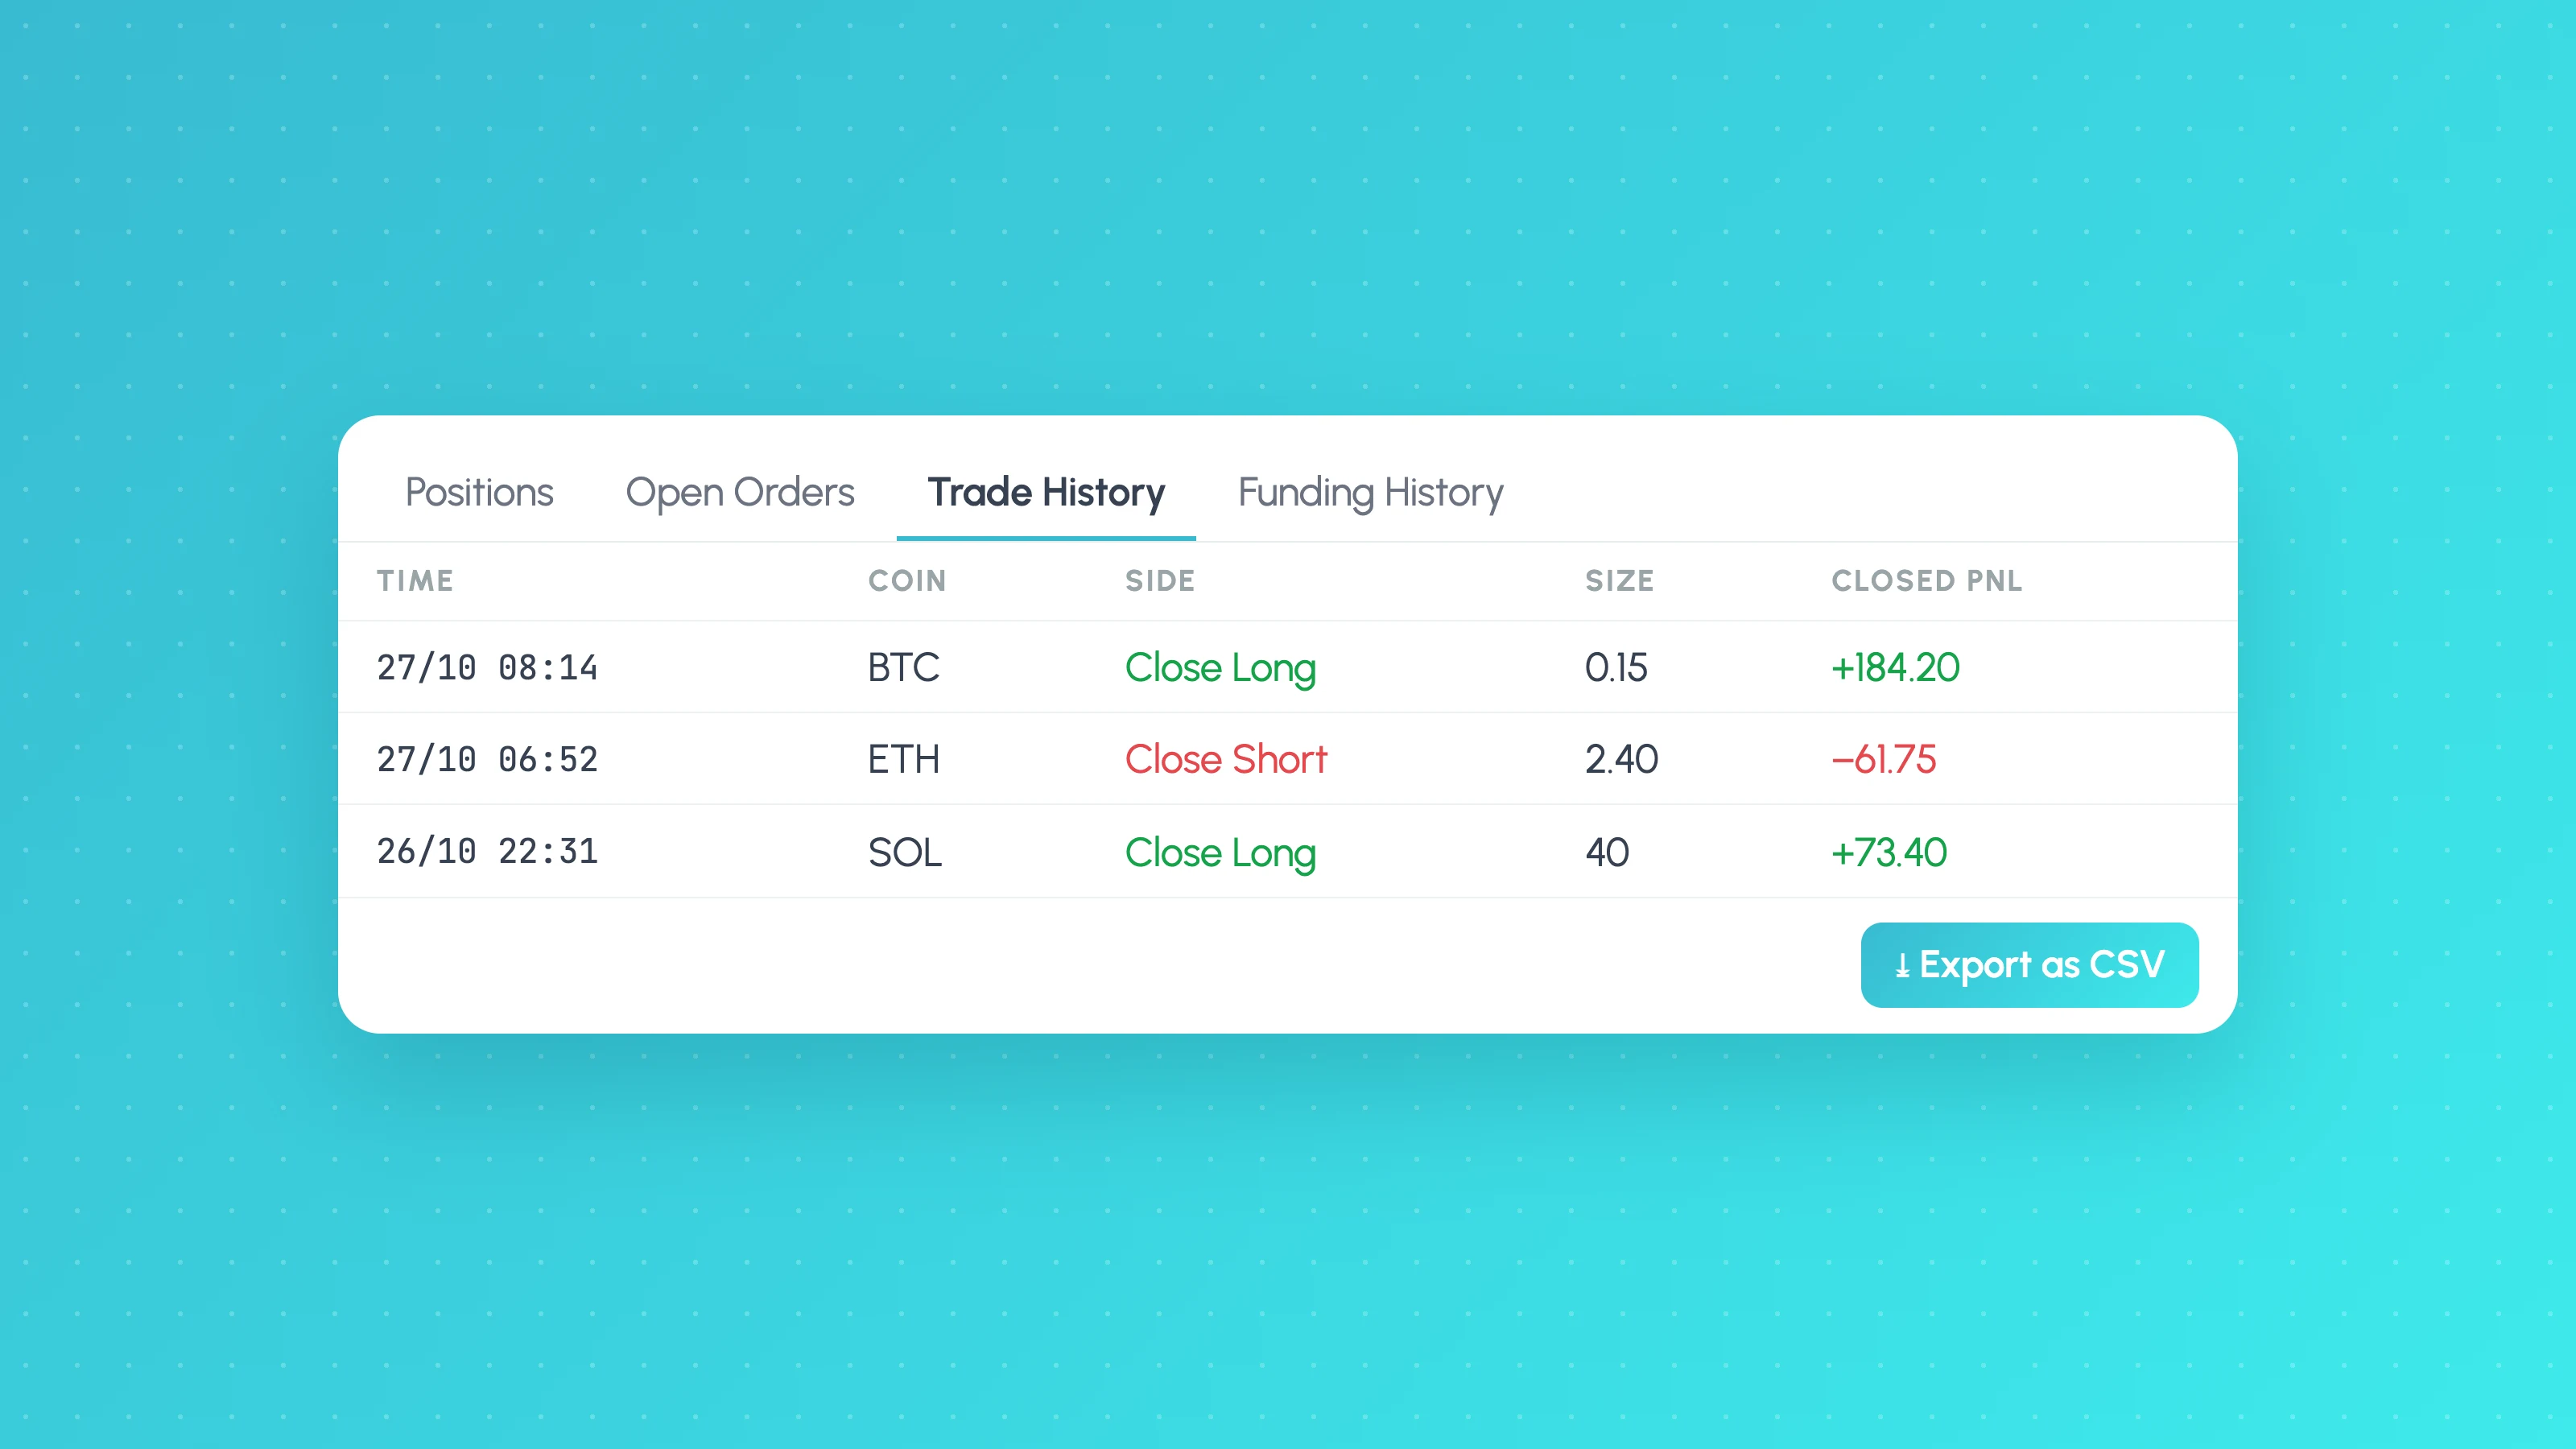
To export your Hyperliquid trade history, connect your wallet at app.hyperliquid.xyz, open the Trade History tab under the chart and click Export as CSV. Funding payments are in a separate Funding History tab with its own export, and for anything beyond the most recent fills you need the API, because both the app export and the API only reach back a limited number of rows.
That covers the download. The harder part is turning three separate files into a number you can trust: realised PnL after fees and funding, broken down by when and in what conditions you made or lost it. This guide covers both, as of October 2026.
Where the export lives in the Hyperliquid app
The account panel sits below the chart on the Trade page. As of October 2026 it has these tabs: Balances, Positions, Open Orders, TWAP, Chase, Trade History, Funding History and Order History.
- Go to app.hyperliquid.xyz/trade and connect the wallet you trade with (the actual account address, not an API or agent wallet).
- Click Trade History. Use the Type, Side, Role and Market filters if you only want part of it, and decide whether to tick Aggregate, which combines partial fills of the same order into one row.
- Click Export as CSV under the table. There is also an Export More link next to it for further export options.
- Click Funding History and use its Export as CSV link.
- Deposits, withdrawals and transfers are not in either file. Look for them on the Portfolio page or pull them from the API (below). They are not trades, but you need them to reconcile your balance.
Order History is useful for checking what you intended (limit price, trigger conditions, cancelled orders), but it is not what you analyse for PnL. Fills are what actually happened.
What each file contains
| File | One row per | Key columns in the app table | Use it for |
|---|---|---|---|
| Trade History | Fill (or aggregated order fill) | Time, Market, Direction, Price, Size, Trade Value, Fee, Closed PNL | Entries, exits, fees, price PnL |
| Funding History | Hourly funding payment on an open position | Time, Market, Size, Side, Payment, Rate | Funding paid or received |
| Order History | Order | Time, Type, Market, Direction, Size, Filled Size, Price, Reduce Only, Trigger Conditions, TP/SL, Status, Order ID | Checking intended vs actual execution |
| Deposits and withdrawals (Portfolio page or API) | Transfer | Time, amount, type | Reconciling balance, not performance |
The column names above are what the app's tables show. Header names inside the downloaded CSV can differ slightly, so check them before you build formulas on top.
Three things catch people out:
- A fill is not a trade. One market order can fill against several resting orders and produce several rows. Opening a position over three clicks and closing it over two gives you five rows for one round trip. For analysis you usually want round trips (open to flat), which you have to rebuild from the fills.
- Direction tells you what the fill did. Values like Open Long, Close Long, Open Short and Close Short show whether a fill added to or reduced the position, which is what you need to group fills into round trips.
- HIP-3 and spot markets look different. In the API, HIP-3 markets carry a dex prefix (such as
xyz:XYZ100) and spot pairs can appear as@plus an index. If you trade them, check they come through in your export and map them to readable names.
The row limit, and what to do about it
Several third-party tax and portfolio tools report that the app's CSV export stops at about 10,000 rows. Hyperliquid's own documentation does not state a limit for the app export, so treat 10,000 as reported, not confirmed.
What Hyperliquid does document is the API limit. The info endpoint docs say userFillsByTime returns at most 2,000 fills per response and that only the 10,000 most recent fills are available. userFills returns at most the 2,000 most recent fills. So for an active algo account, neither route gives you the whole history once you pass 10,000 fills.
The practical fix is boring: export on a schedule. If your strategy produces a few hundred fills a week, export monthly and keep every file. Deduplicate by the fill's trade ID (tid in the API) when you combine them, since consecutive exports will overlap.
The API alternative for larger histories
The API is public and needs no key for reading. You send a POST request to https://api.hyperliquid.xyz/info with a JSON body. For fills in a time window:
curl -s https://api.hyperliquid.xyz/info \
  -H "Content-Type: application/json" \
  -d '{"type":"userFillsByTime","user":"0xYourAddress","startTime":1759276800000,"aggregateByTime":true}'
startTime and the optional endTime are Unix timestamps in milliseconds, both inclusive. Each fill includes coin, px, sz, side, dir, time, startPosition, closedPnl, fee, feeToken, oid, tid, hash, crossed (true if you took liquidity) and, when non-zero, builderFee.
To page through more than 2,000 fills, take the time of the last fill returned, use it as the next startTime, and drop duplicate tid values, because the boundary is inclusive. A short Python version:
import requests

URL = "https://api.hyperliquid.xyz/info"
user, start, fills = "0xYourAddress", 0, {}

while True:
    batch = requests.post(URL, json={"type": "userFillsByTime", "user": user,
                                     "startTime": start, "aggregateByTime": True}).json()
    new = [f for f in batch if f["tid"] not in fills]
    if not new:
        break
    for f in new:
        fills[f["tid"]] = f
    start = max(f["time"] for f in batch)

print(len(fills), "fills")
Funding has its own endpoint, userFunding, which takes the same user, startTime and endTime parameters and returns each payment with the coin, the amount in USDC, the position size and the funding rate. Deposits, withdrawals and transfers come from userNonFundingLedgerUpdates. Both are documented on the perpetuals info page.
One gotcha from the docs: if you query an agent wallet's address instead of the master or sub-account address, you get an empty result.
How to compute realised PnL with fees and funding
Realised PnL on a perp round trip has three parts:
Net PnL = price PnL − trading fees ± funding
- Price PnL is (exit price − entry price) × size for a long, the reverse for a short.
- Fees are on every fill. As of October 2026, Hyperliquid's fee schedule starts at 0.045% taker and 0.015% maker on perps, based on rolling 14-day volume, with small maker rebates at high maker share. If you trade through a front end that charges a builder fee, the API's
feefield already includes it, per the docs. - Funding is paid every hour, peer to peer, as position size × oracle price × funding rate, according to Hyperliquid's funding docs. Positive funding means longs pay shorts.
Say you open 2 ETH long at 3,000 and close at 3,100, both as taker orders, and hold through 10 funding payments at 0.0013% per hour with ETH around 3,050:
| Part | Calculation | Amount (USDC) |
|---|---|---|
| Price PnL | (3,100 − 3,000) × 2 | +200.00 |
| Opening fee | 6,000 × 0.045% | −2.70 |
| Closing fee | 6,200 × 0.045% | −2.79 |
| Funding | 2 × 3,050 × 0.0013% × 10 hours | −0.79 |
| Net realised PnL | +193.72 |
On one swing trade, fees and funding look small. On a scalping algo with a 0.1% average move per trade, a 0.09% round-trip taker cost takes most of the edge, and funding can decide whether a slow carry-heavy strategy makes money at all. That is why you never judge an algo on gross PnL.
Check what Closed PNL includes before you subtract fees. Hyperliquid's entry price and PnL page describes closed PnL as a display value and gives a formula that mentions the fee, while several third-party data providers treat the API's closedPnl as before fees. Rather than guess, test it on one closing fill: if Closed PNL equals (exit − entry) × size exactly, fees are not included and you subtract the Fee column yourself. If it is lower by the fee, they are already in. Funding is never in the fills file, so add it from Funding History either way.
Analysing perps by session and volatility in a 24/7 market
Crypto never closes, but liquidity still has a daily rhythm. Most algos have hours where they earn and hours where they give it back, and the total hides that. Once you have round trips with net PnL, add these columns and pivot on them:
- Session (by UTC entry time). For example Asia 00:00 to 08:00, Europe 08:00 to 13:00, Europe and US overlap 13:00 to 16:00, US 16:00 to 21:00, late US 21:00 to 24:00. Hyperliquid timestamps are UTC milliseconds, so convert once and stay in UTC.
- Weekday and weekend. Weekends usually have thinner books and different behaviour around the Sunday evening open of traditional markets. Treat Saturday and Sunday as their own bucket.
- Volatility at entry. Compute ATR or the realised range over the previous 24 hours from candle data, then split trades into low, normal and high thirds.
- Funding regime. Bucket trades by the funding rate at entry (strongly positive, near zero, negative). It is a decent proxy for crowding, and it tells you whether funding is quietly paying for or eating your edge.
- Maker vs taker. The
crossedfield, or the Role filter in the app, shows whether you took liquidity. A strategy that only works when its exits fill as maker is fragile.
Put a trade count next to every bucket. A session with 12 trades and a great profit factor is a hypothesis, not a finding; our guide on backtest sample size covers how many you need. Then compare expectancy per bucket after costs, not win rate.
You can do all of this in a spreadsheet. Tessera Trades imports Hyperliquid trade history by file (see supported brokers and platforms) and builds the session, weekday, time of day, volatility and symbol breakdown for you, with the trade count behind each slice.
A checklist for a clean Hyperliquid export
| Step | Why |
|---|---|
| Use the master or sub-account address | Agent wallet addresses return nothing |
| Export Trade History and Funding History | Fills alone miss funding |
| Export on a schedule, keep every file | App export reportedly caps at about 10,000 rows; API is documented at 10,000 most recent fills |
| Deduplicate by trade ID | Overlapping exports and inclusive API time windows repeat fills |
| Rebuild round trips from fills | One position can be many rows |
| Test what Closed PNL includes | Avoid double-counting fees |
| Convert all times to UTC once | Session analysis depends on it |
If you also run strategies on MetaTrader, the same approach applies to an EA's tester report: see our guide to the MT5 Strategy Tester report export.
Get a free Entry Analysis report from your Hyperliquid history
Once your export is clean, the useful question is where the strategy makes and loses money. Upload your trade history to the free Entry Analysis report and you will see results by session, weekday, time of day and volatility, with the sample size behind each. No card needed.
For how Hyperliquid history fits into a journal, including what Tessera reads from the file, see the Hyperliquid trading journal page and the algo trading journal.
Frequently asked questions
- How do I export my Hyperliquid trade history?
- Connect your wallet at app.hyperliquid.xyz, open the Trade History tab below the chart and click Export as CSV. Funding payments are exported separately from the Funding History tab, and deposits and withdrawals are available from the Portfolio page or the API.
- Is there a limit on Hyperliquid CSV exports?
- Third-party tools report that the app export stops at about 10,000 rows, but Hyperliquid's docs do not state a limit for it. The API is documented: userFillsByTime returns up to 2,000 fills per request and only the 10,000 most recent fills are available, so export regularly if you trade often.
- Does the Hyperliquid trade history include funding?
- No. Funding payments are in the separate Funding History tab, or the userFunding API endpoint. To get true realised PnL on perps you need to combine both files, since funding is paid every hour on open positions.
- How do I calculate my Hyperliquid PnL?
- For each round trip, take price PnL, subtract trading fees, then add funding received or subtract funding paid. Check on one closing fill whether the Closed PNL column already includes the fee, so you do not subtract it twice.
- Can I use Hyperliquid data in a trading journal?
- Yes. Most journals and analytics tools accept the Trade History CSV, and some read fills from the public API. Check that the tool handles funding separately and groups fills into round trips, otherwise win rate and PnL per trade will be wrong.
Keep reading
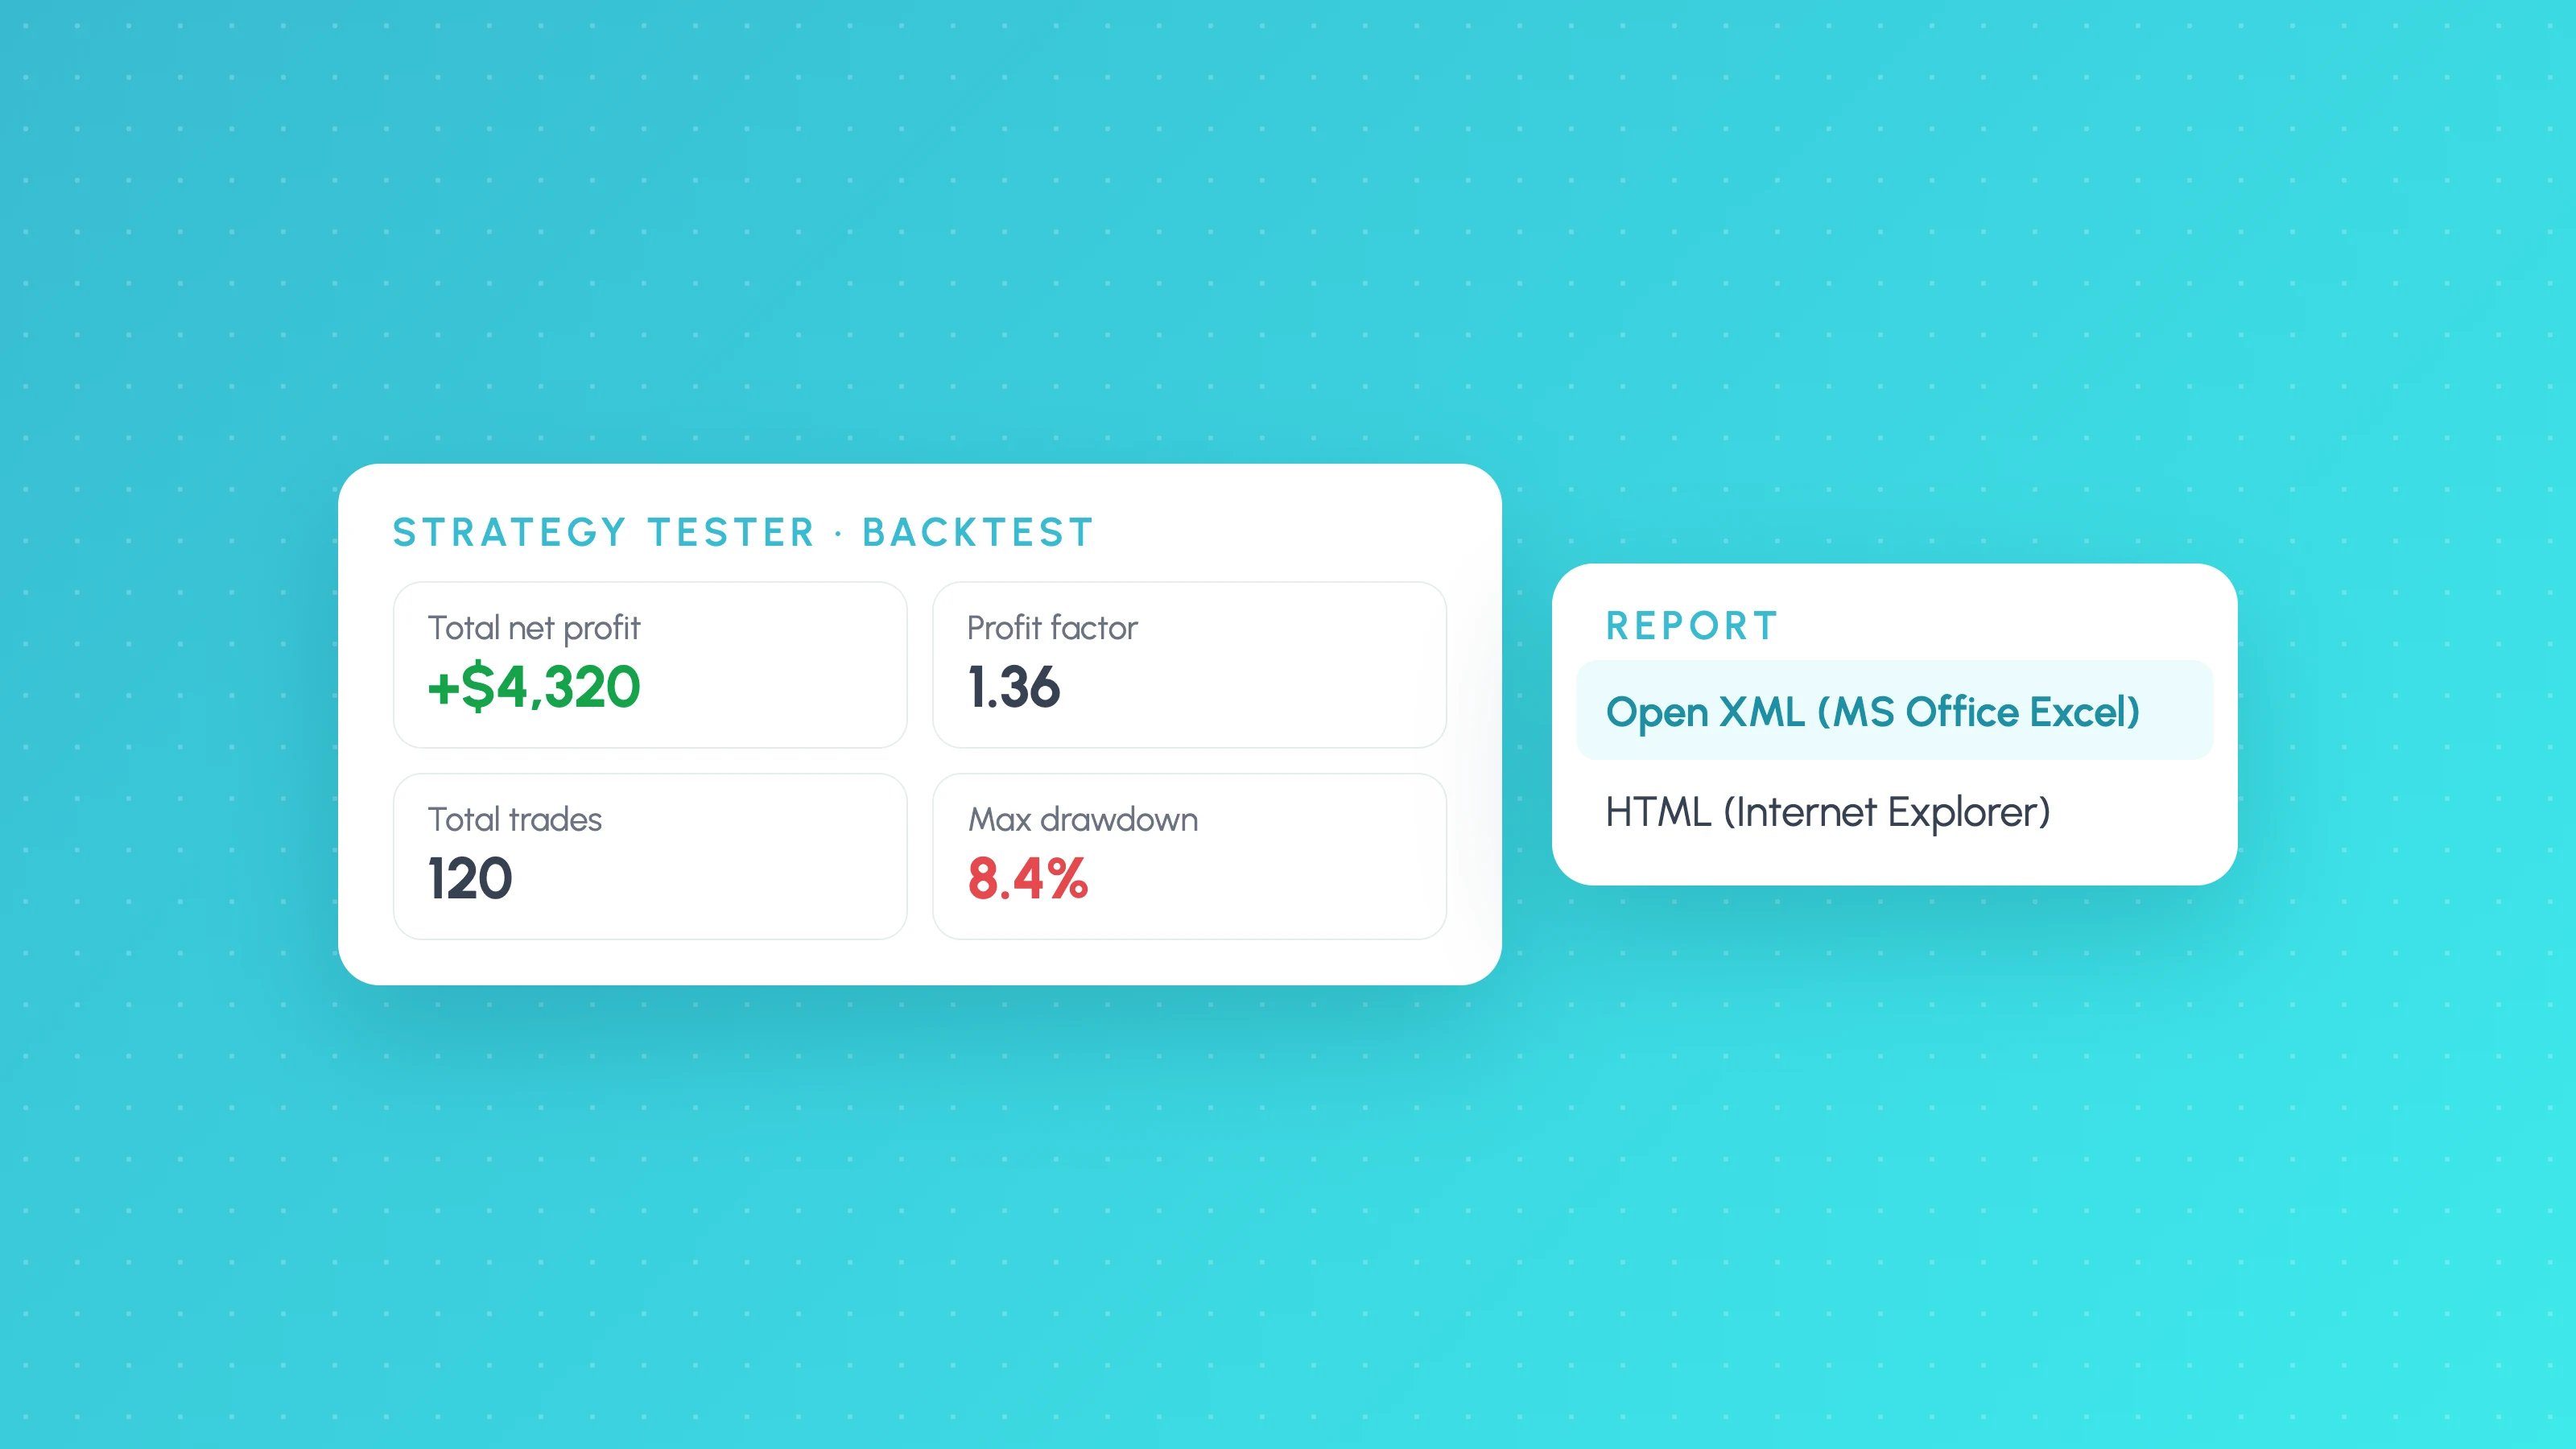 Platforms and exports
MT5 Strategy Tester Report Export: Excel, HTML and EA Analysis
Save your MT5 Strategy Tester report as Excel or HTML, understand deals, orders and positions, and break EA backtest results down by session and volatility.
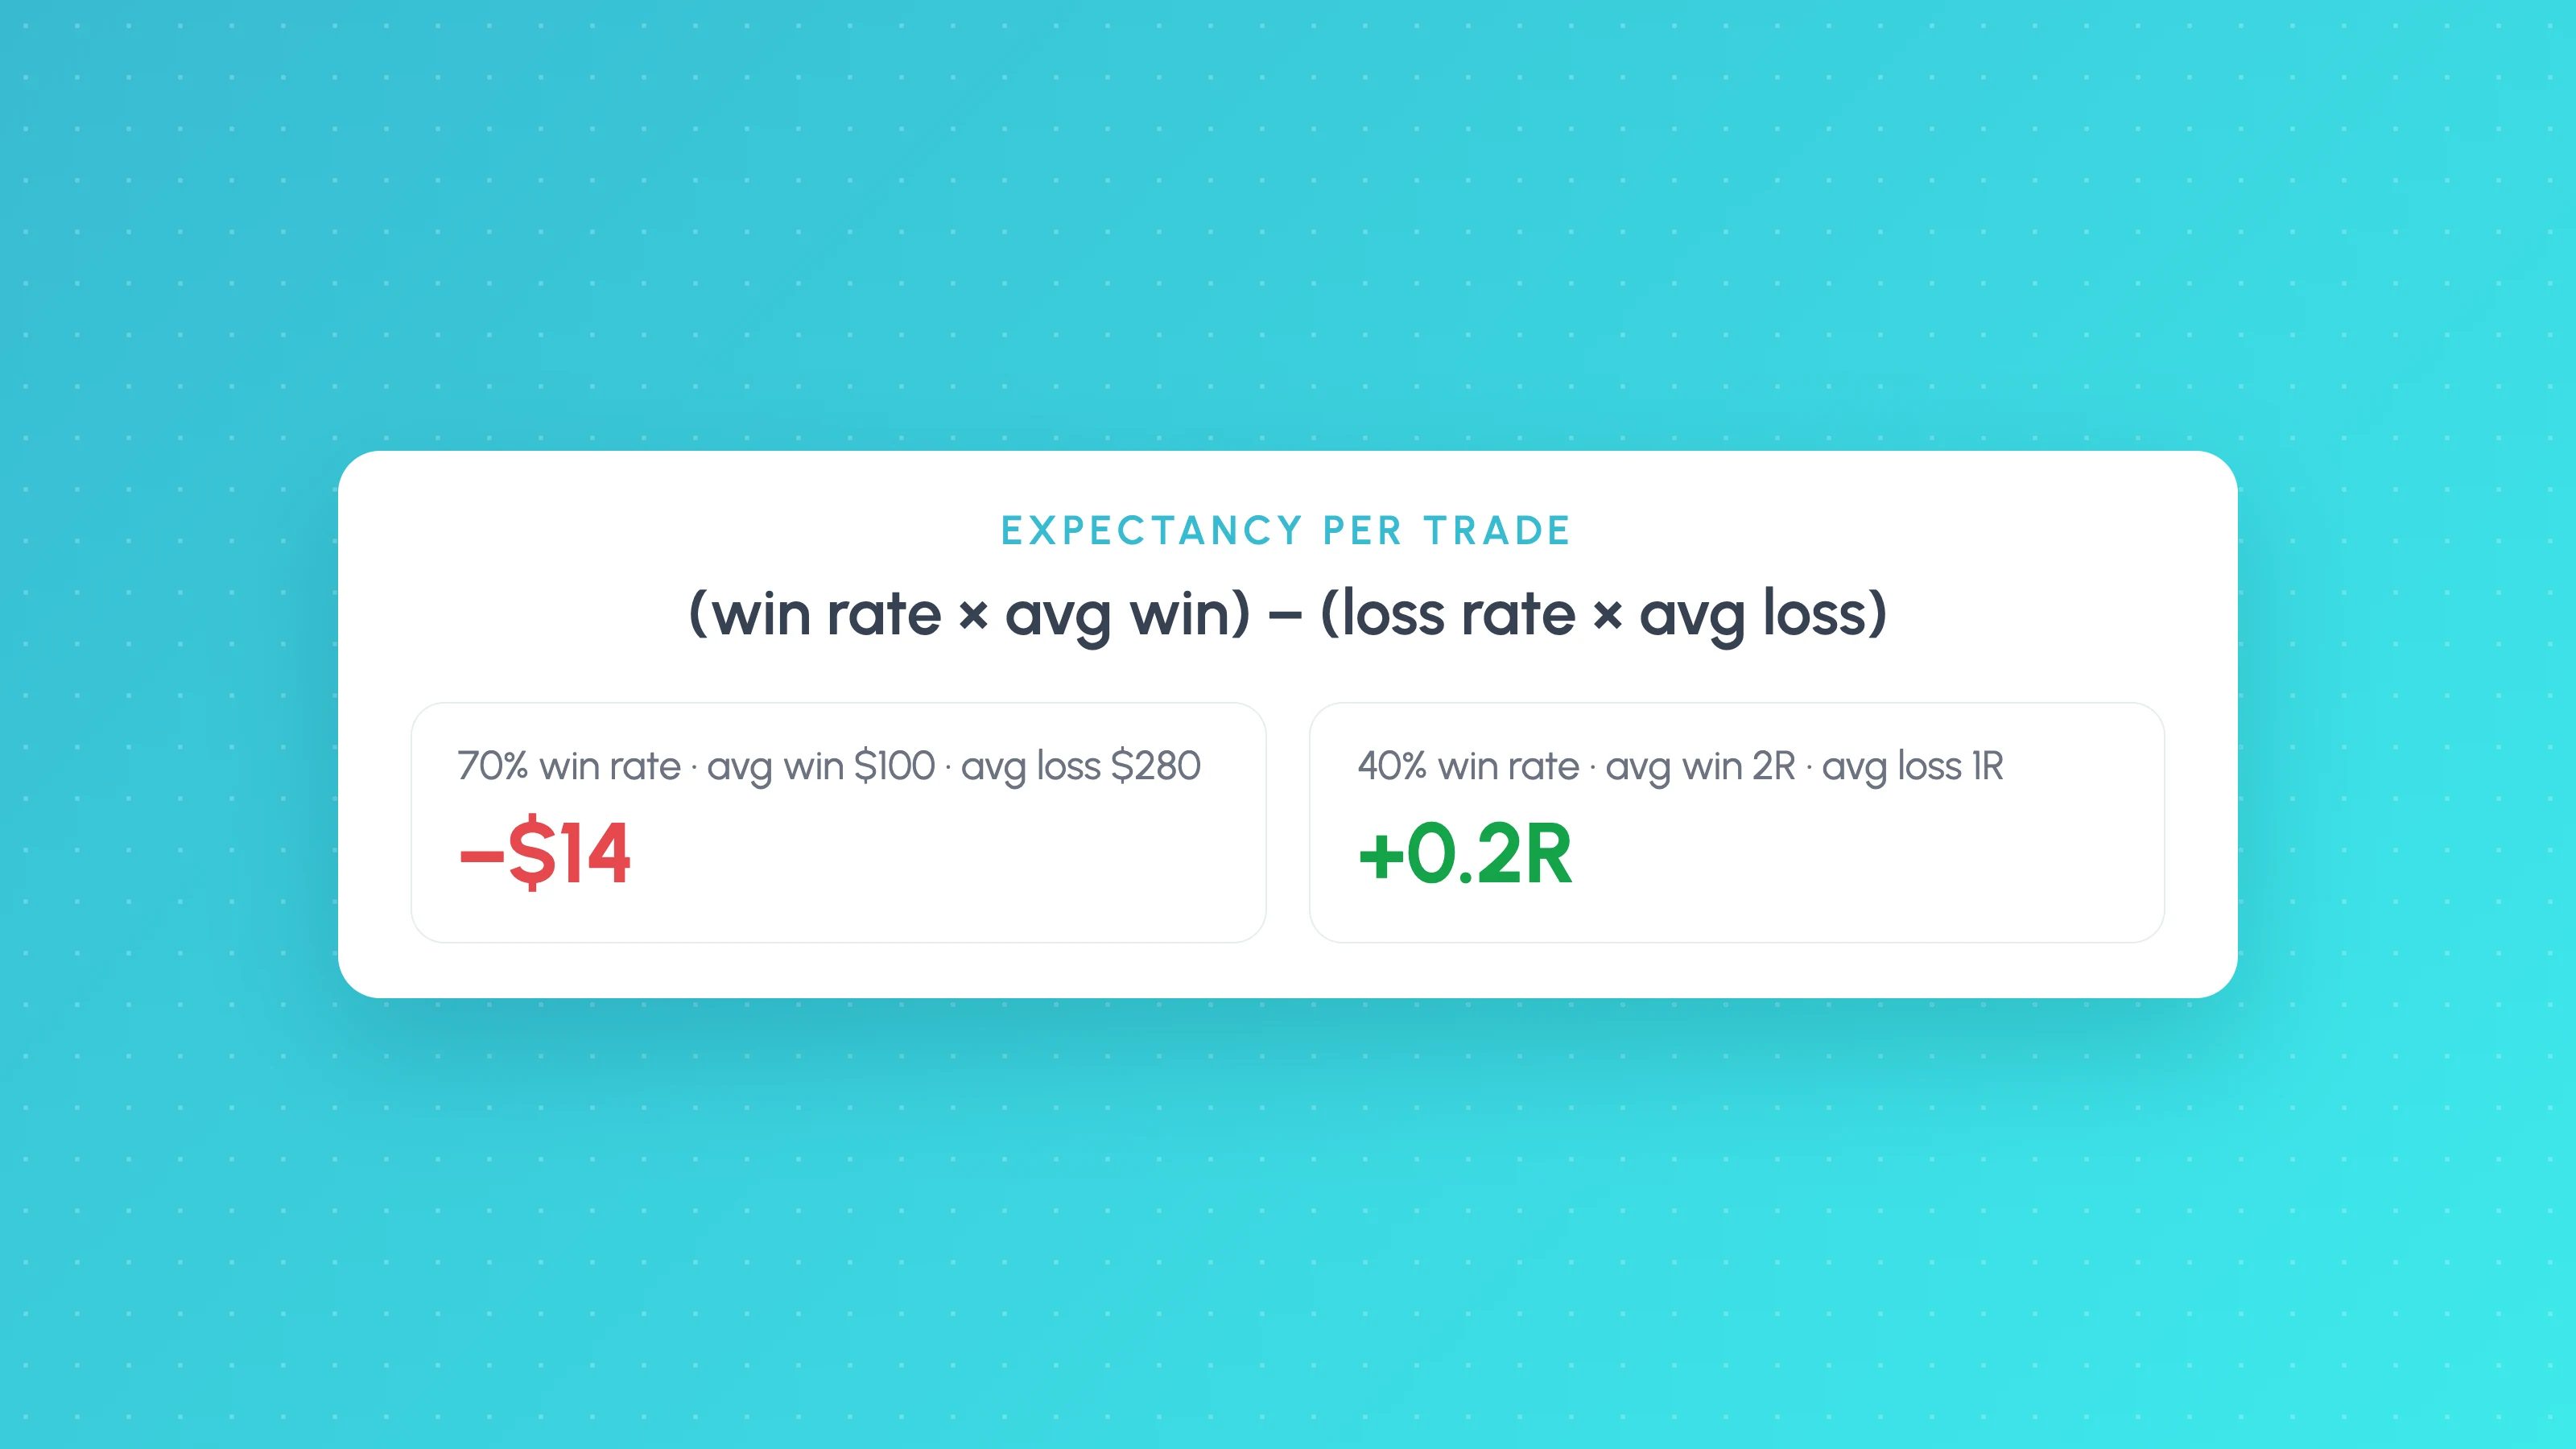 Trading metrics
Trading Expectancy Formula: In Currency and R, With Examples
Expectancy = win rate x average win minus loss rate x average loss. Worked examples in currency and R, why 70% win rates lose, and spreadsheet formulas.
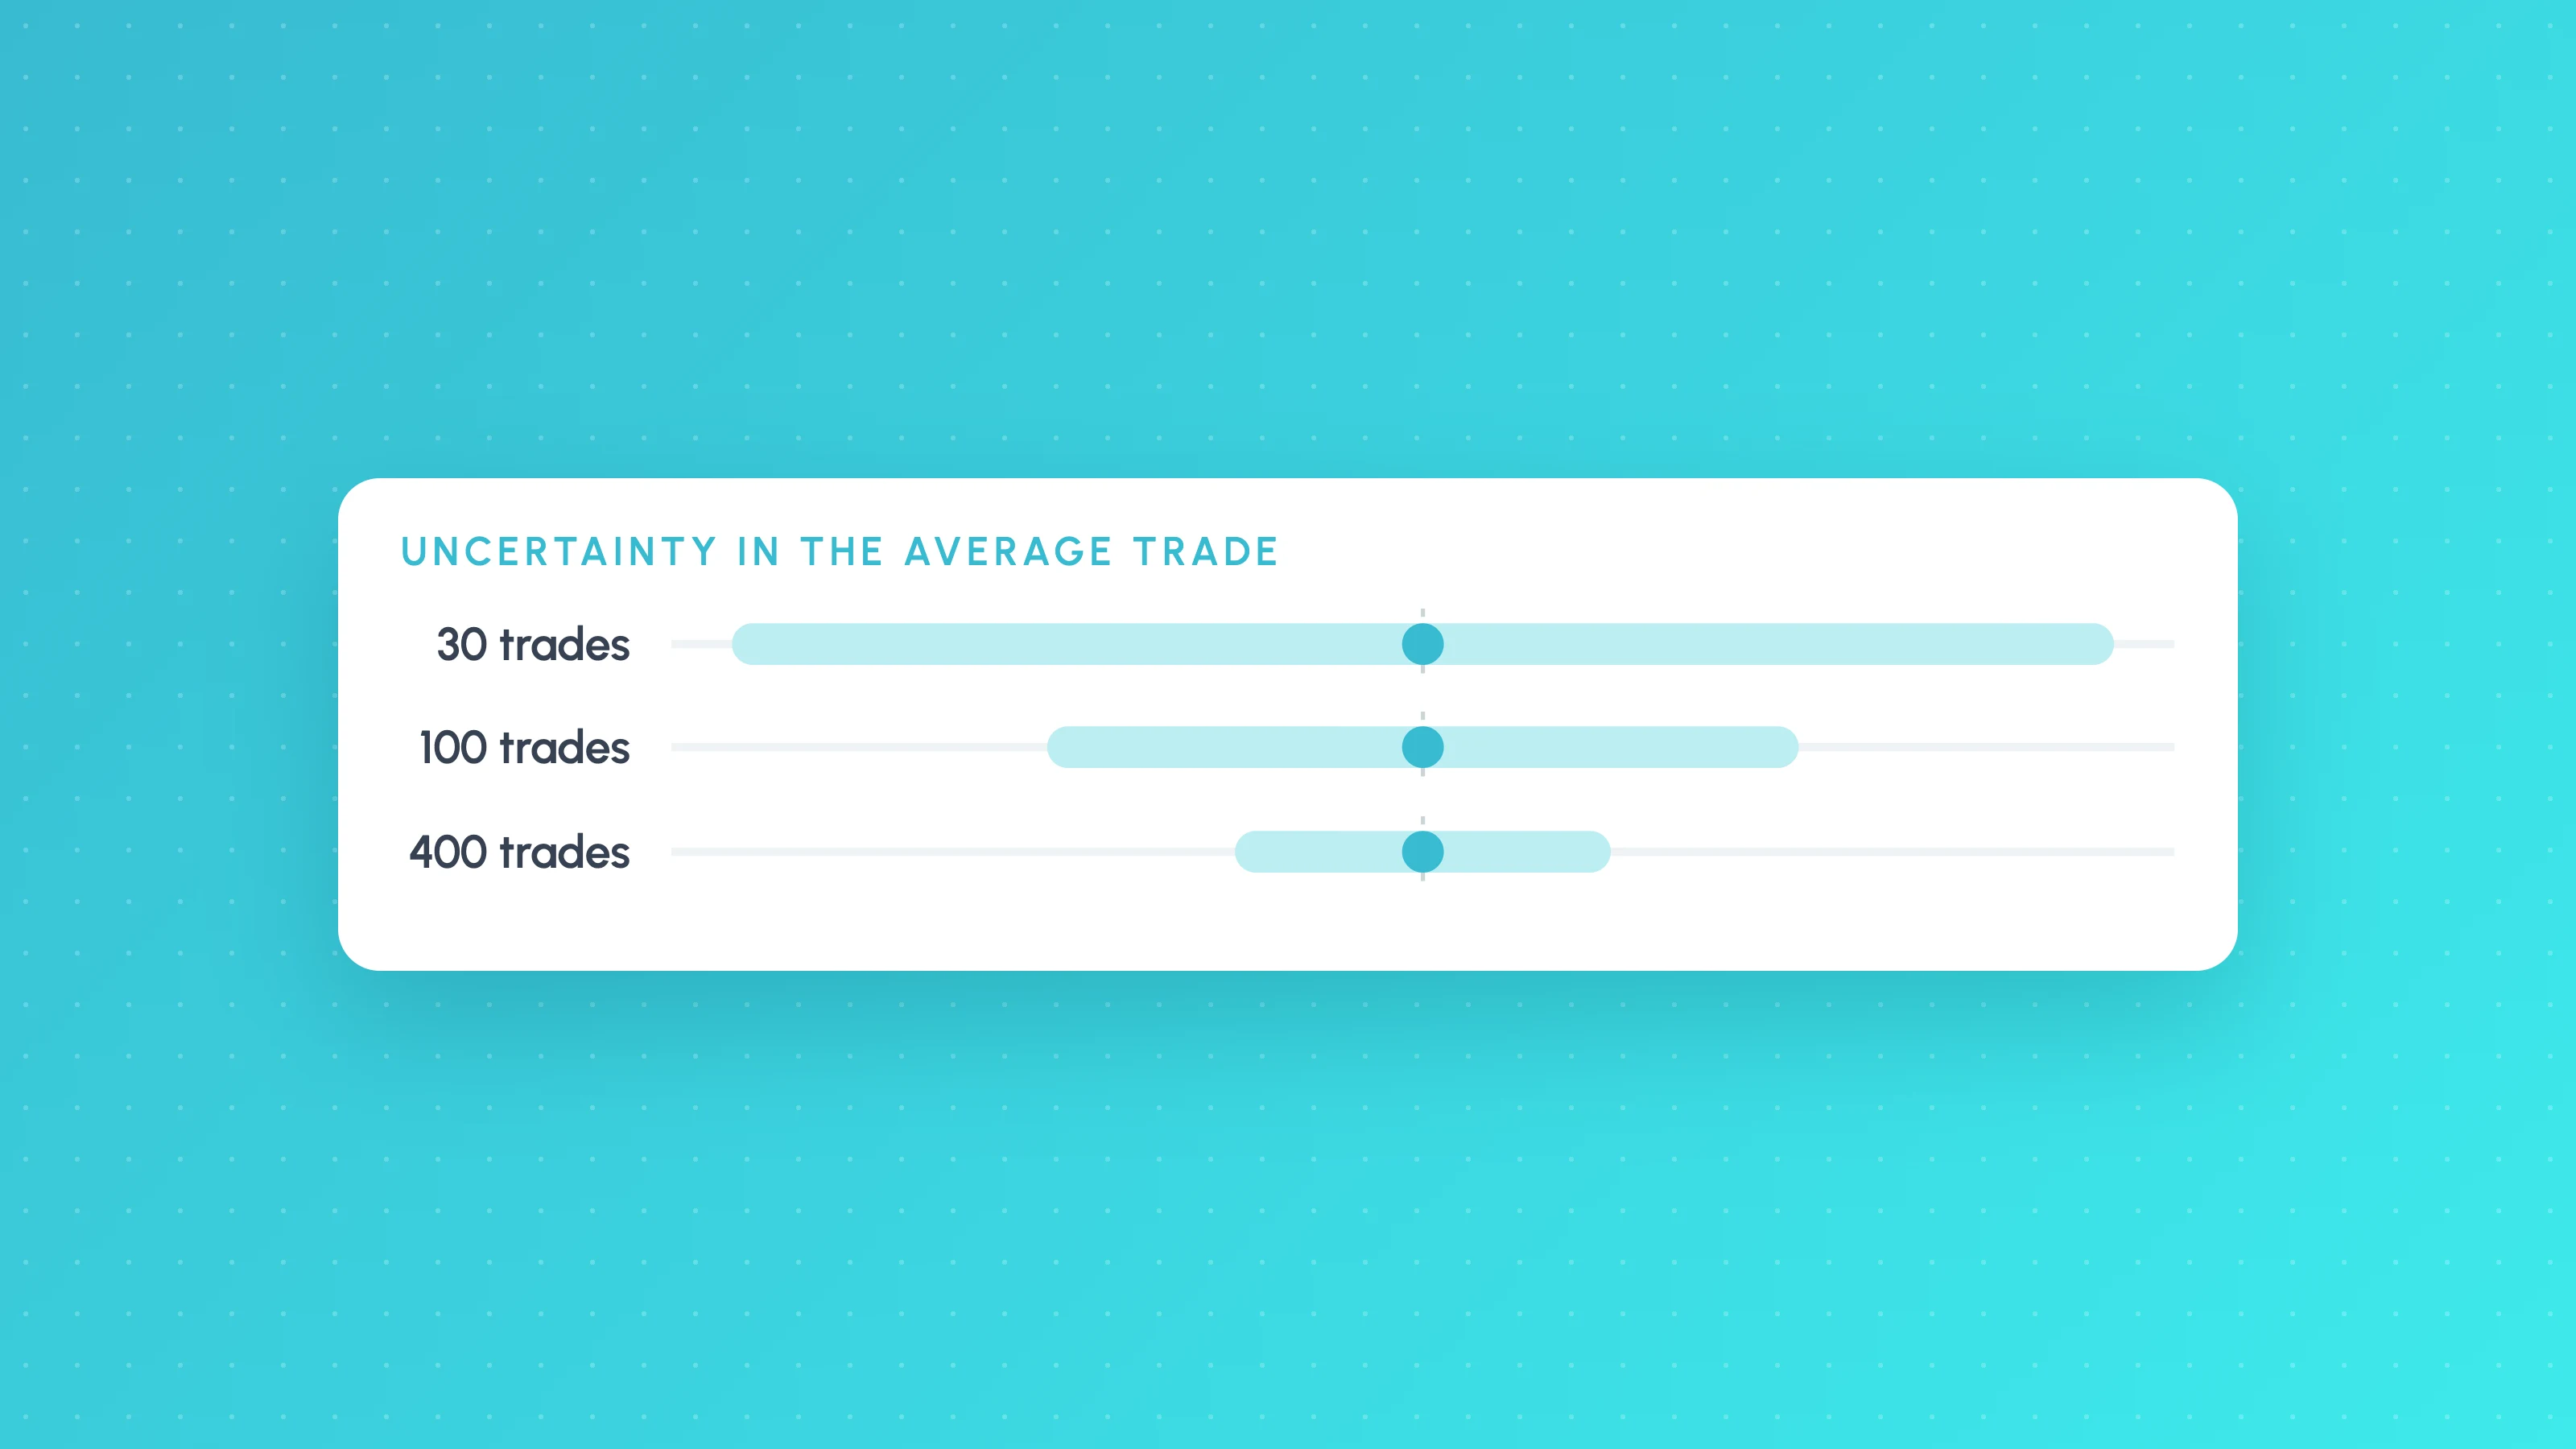 TradingView backtests
How Many Trades Do You Need for a Valid Backtest?
How many trades a backtest needs: rules of thumb, the t-statistic formula with a worked example, a table by edge size, per-bucket minimums and multiple testing.